
Prognostic Value of 18F–FDG–PET Parameters in Patients with Small Cell Lung Cancer: A Meta-Analysis and Review of Current Literature

 ,
, 
Abstract
:1. Introduction
2. Materials and Methods
2.1. Eligibility Criteria
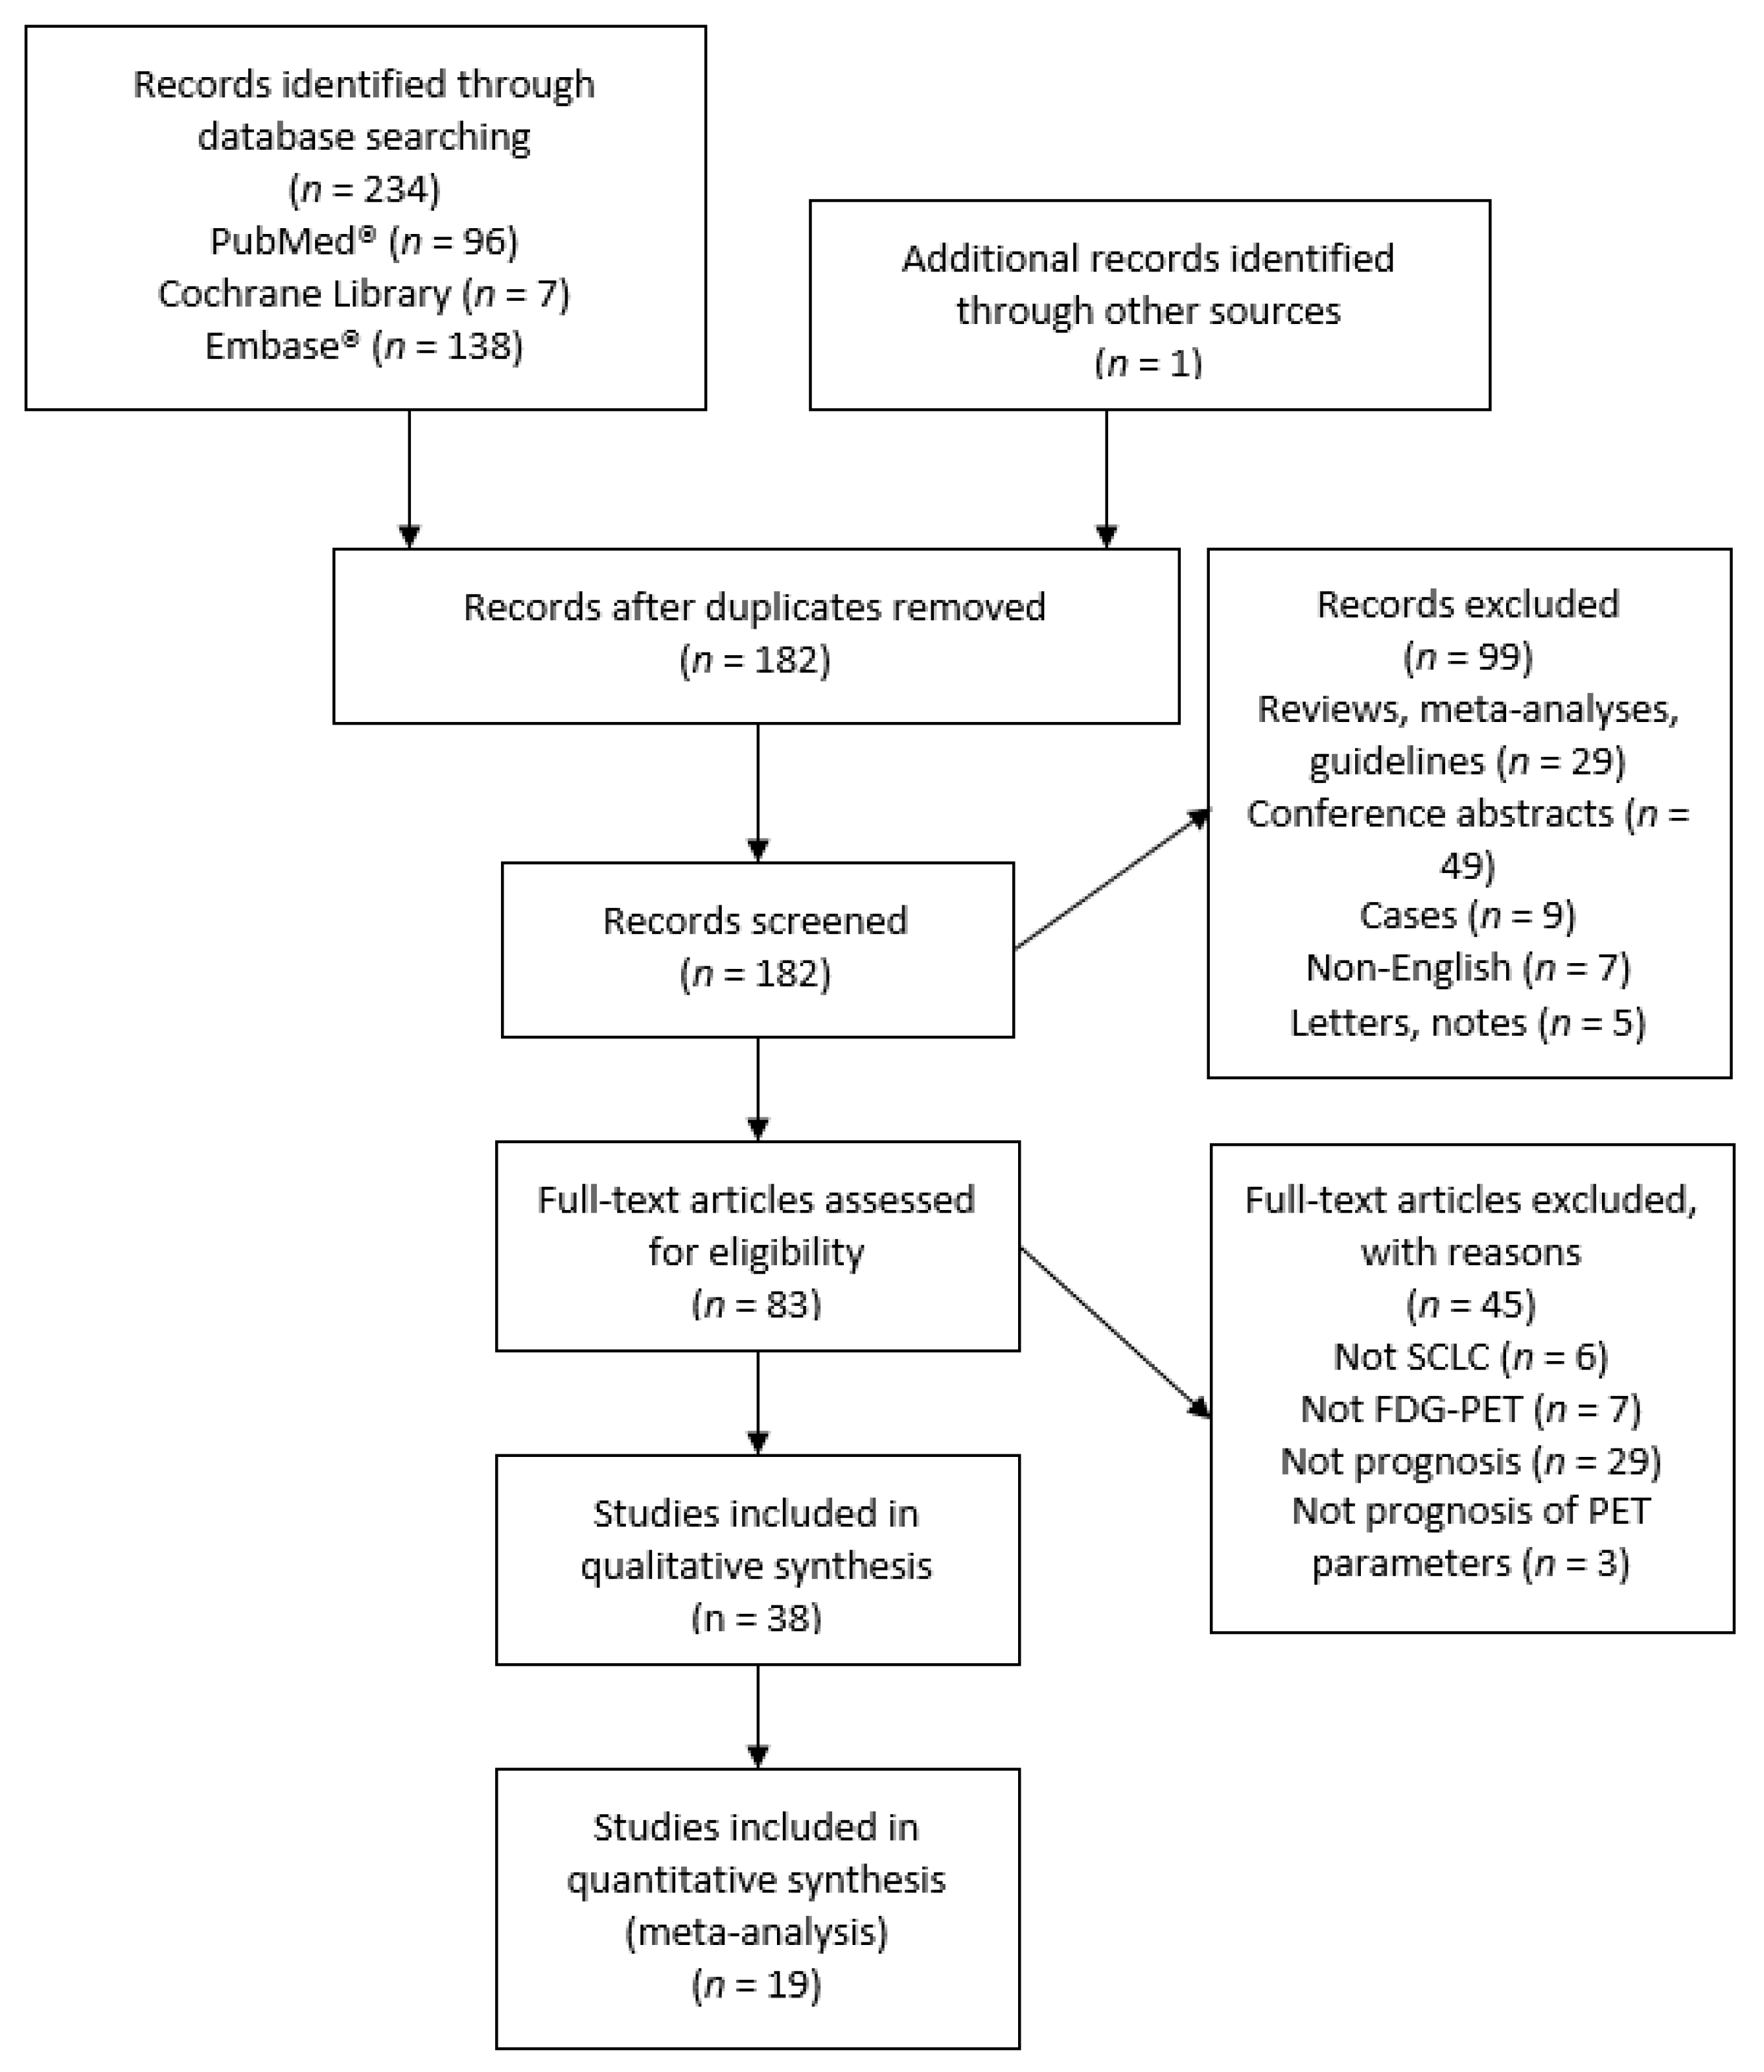
2.1.1. Search Strategy
2.1.2. Study Selection
2.2. Data
2.3. Statistics
3. Results
3.1. Quality of the Studies
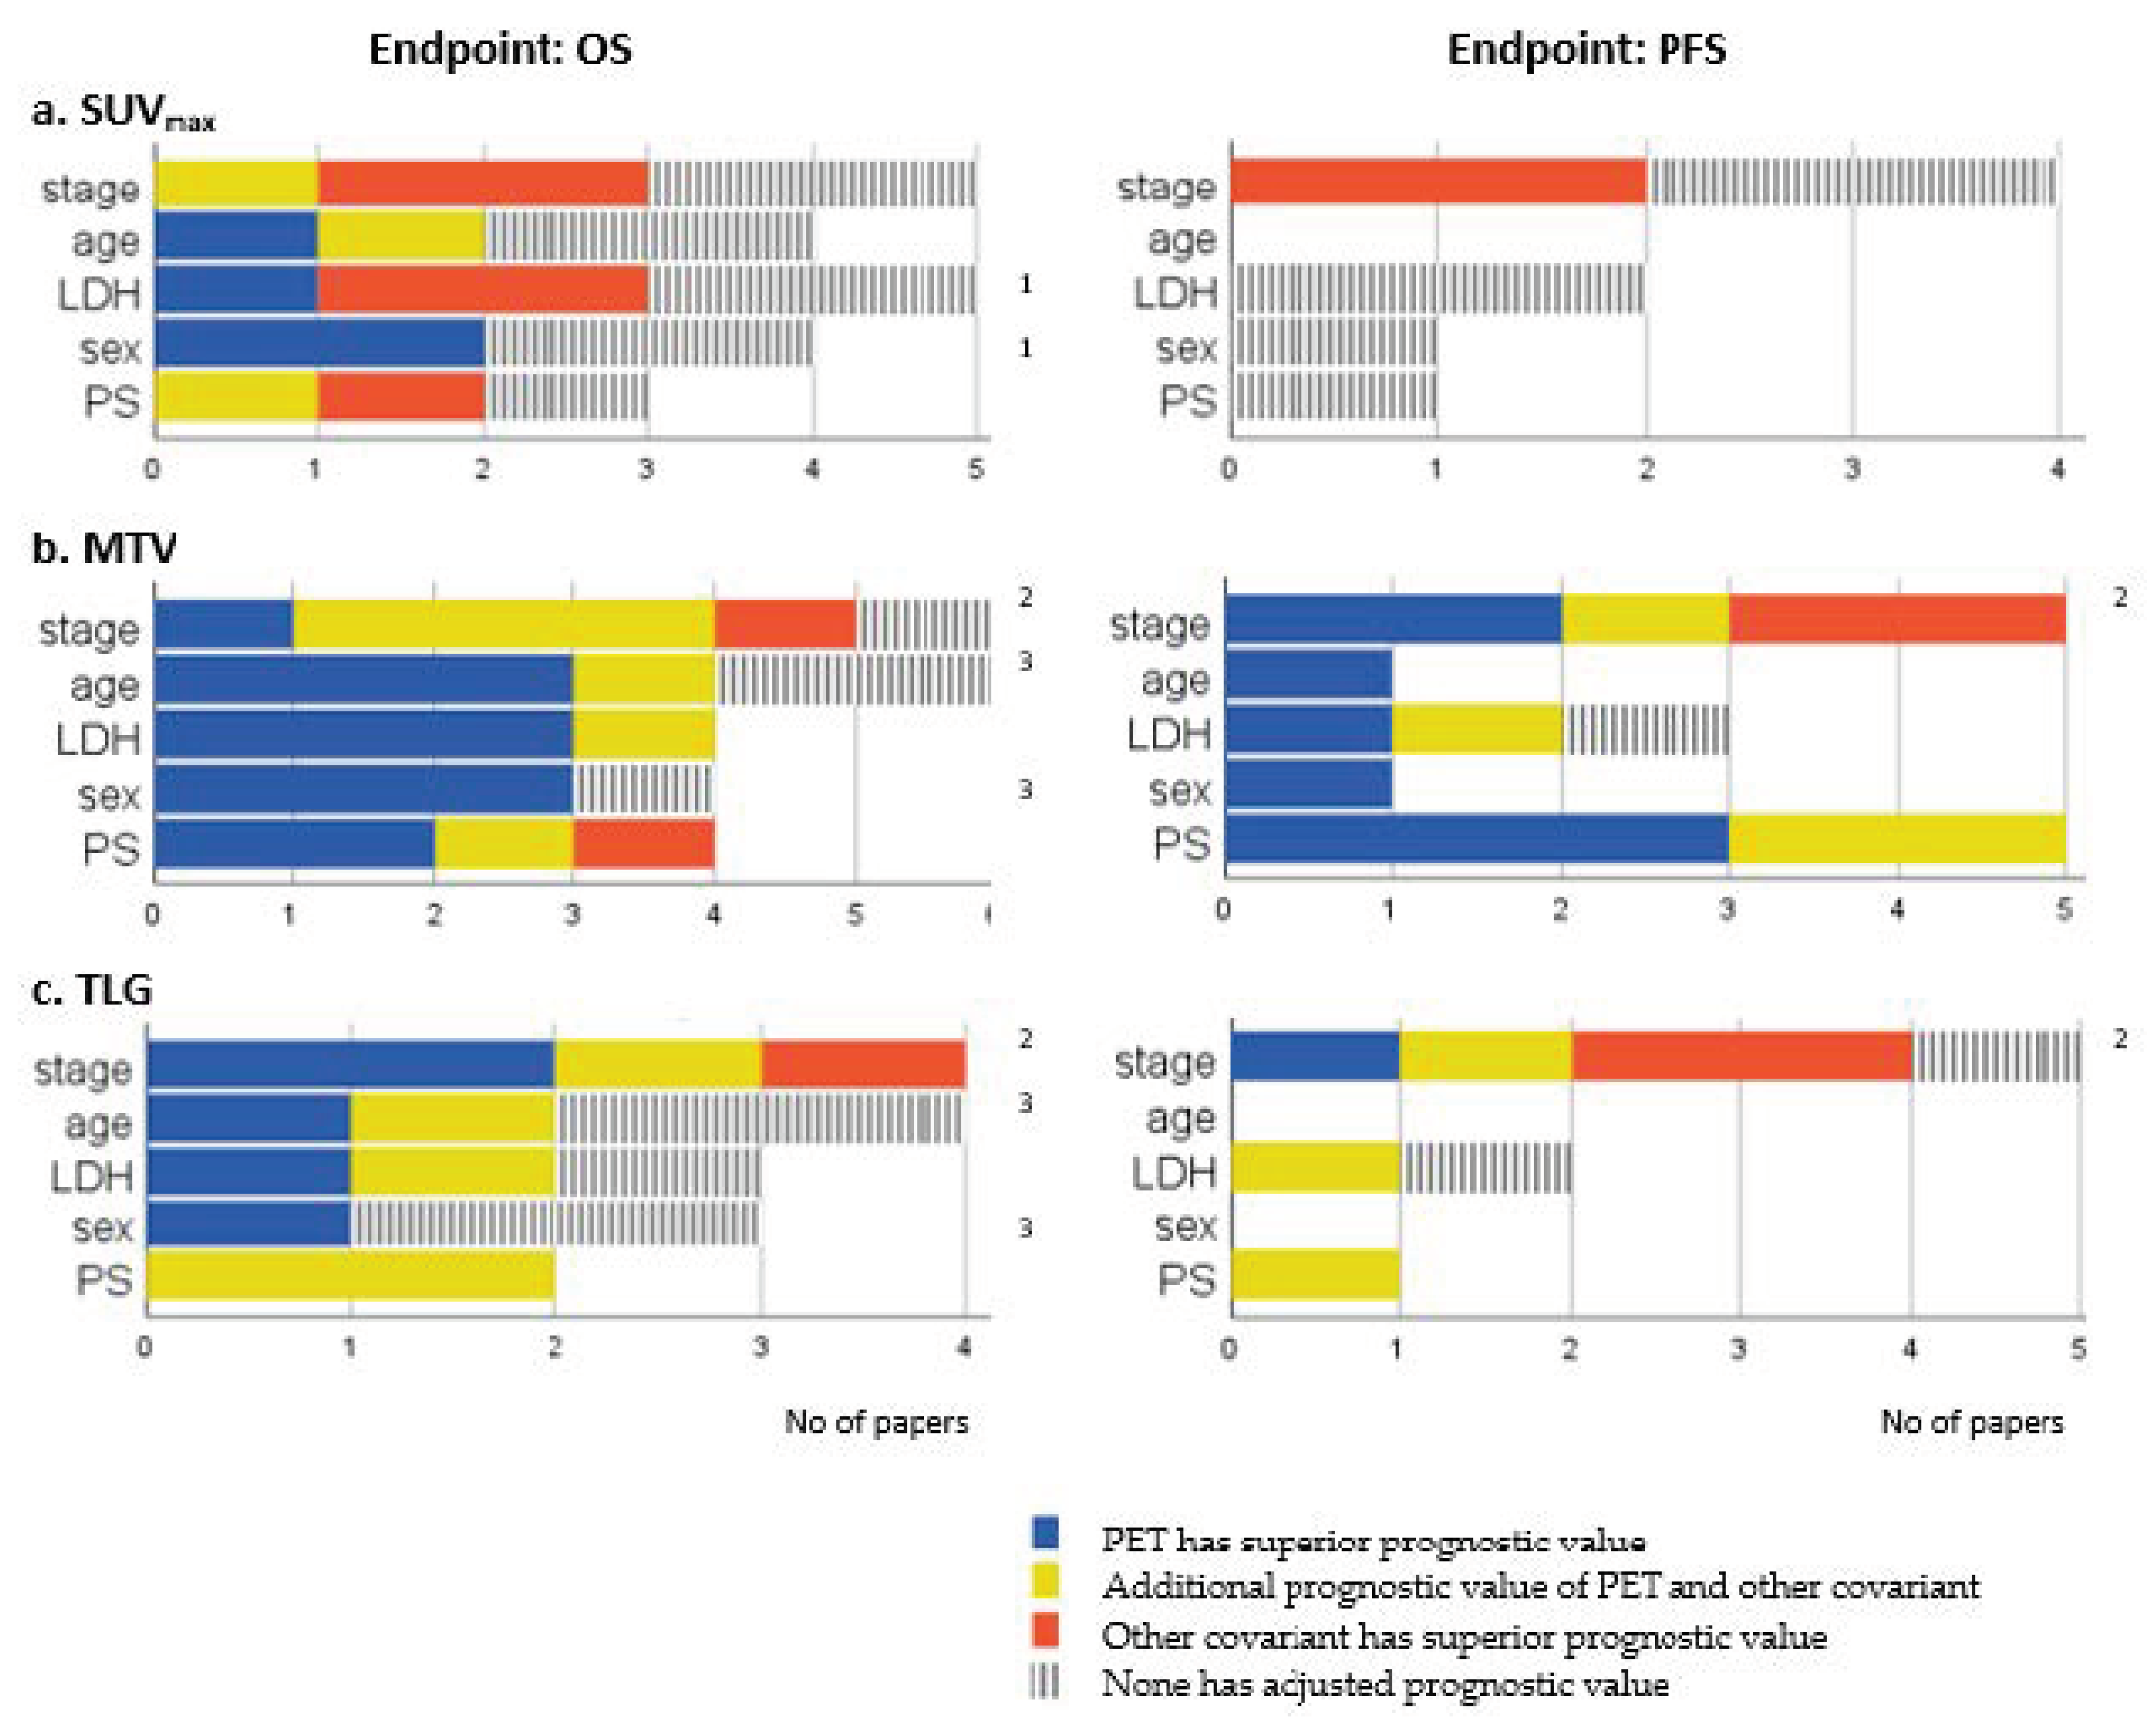
3.2. Qualitative Analysis: Prognostic Value of Baseline PET Parameters
3.2.1. Baseline SUV
3.2.2. Baseline MTV
3.2.3. Baseline PET Parameters Combining SUV with Tumor Volume
3.3. Qualitative Analysis: Prognostic Value of Post-Treatment PET Parameters
3.4. Qualitative Analysis: Prognostic Value of PET Parameter Change, Early and Final Response Evaluation
3.5. Qualitative Analysis: Prognostic Value of PET Parameters at Mixed Treatment Phases
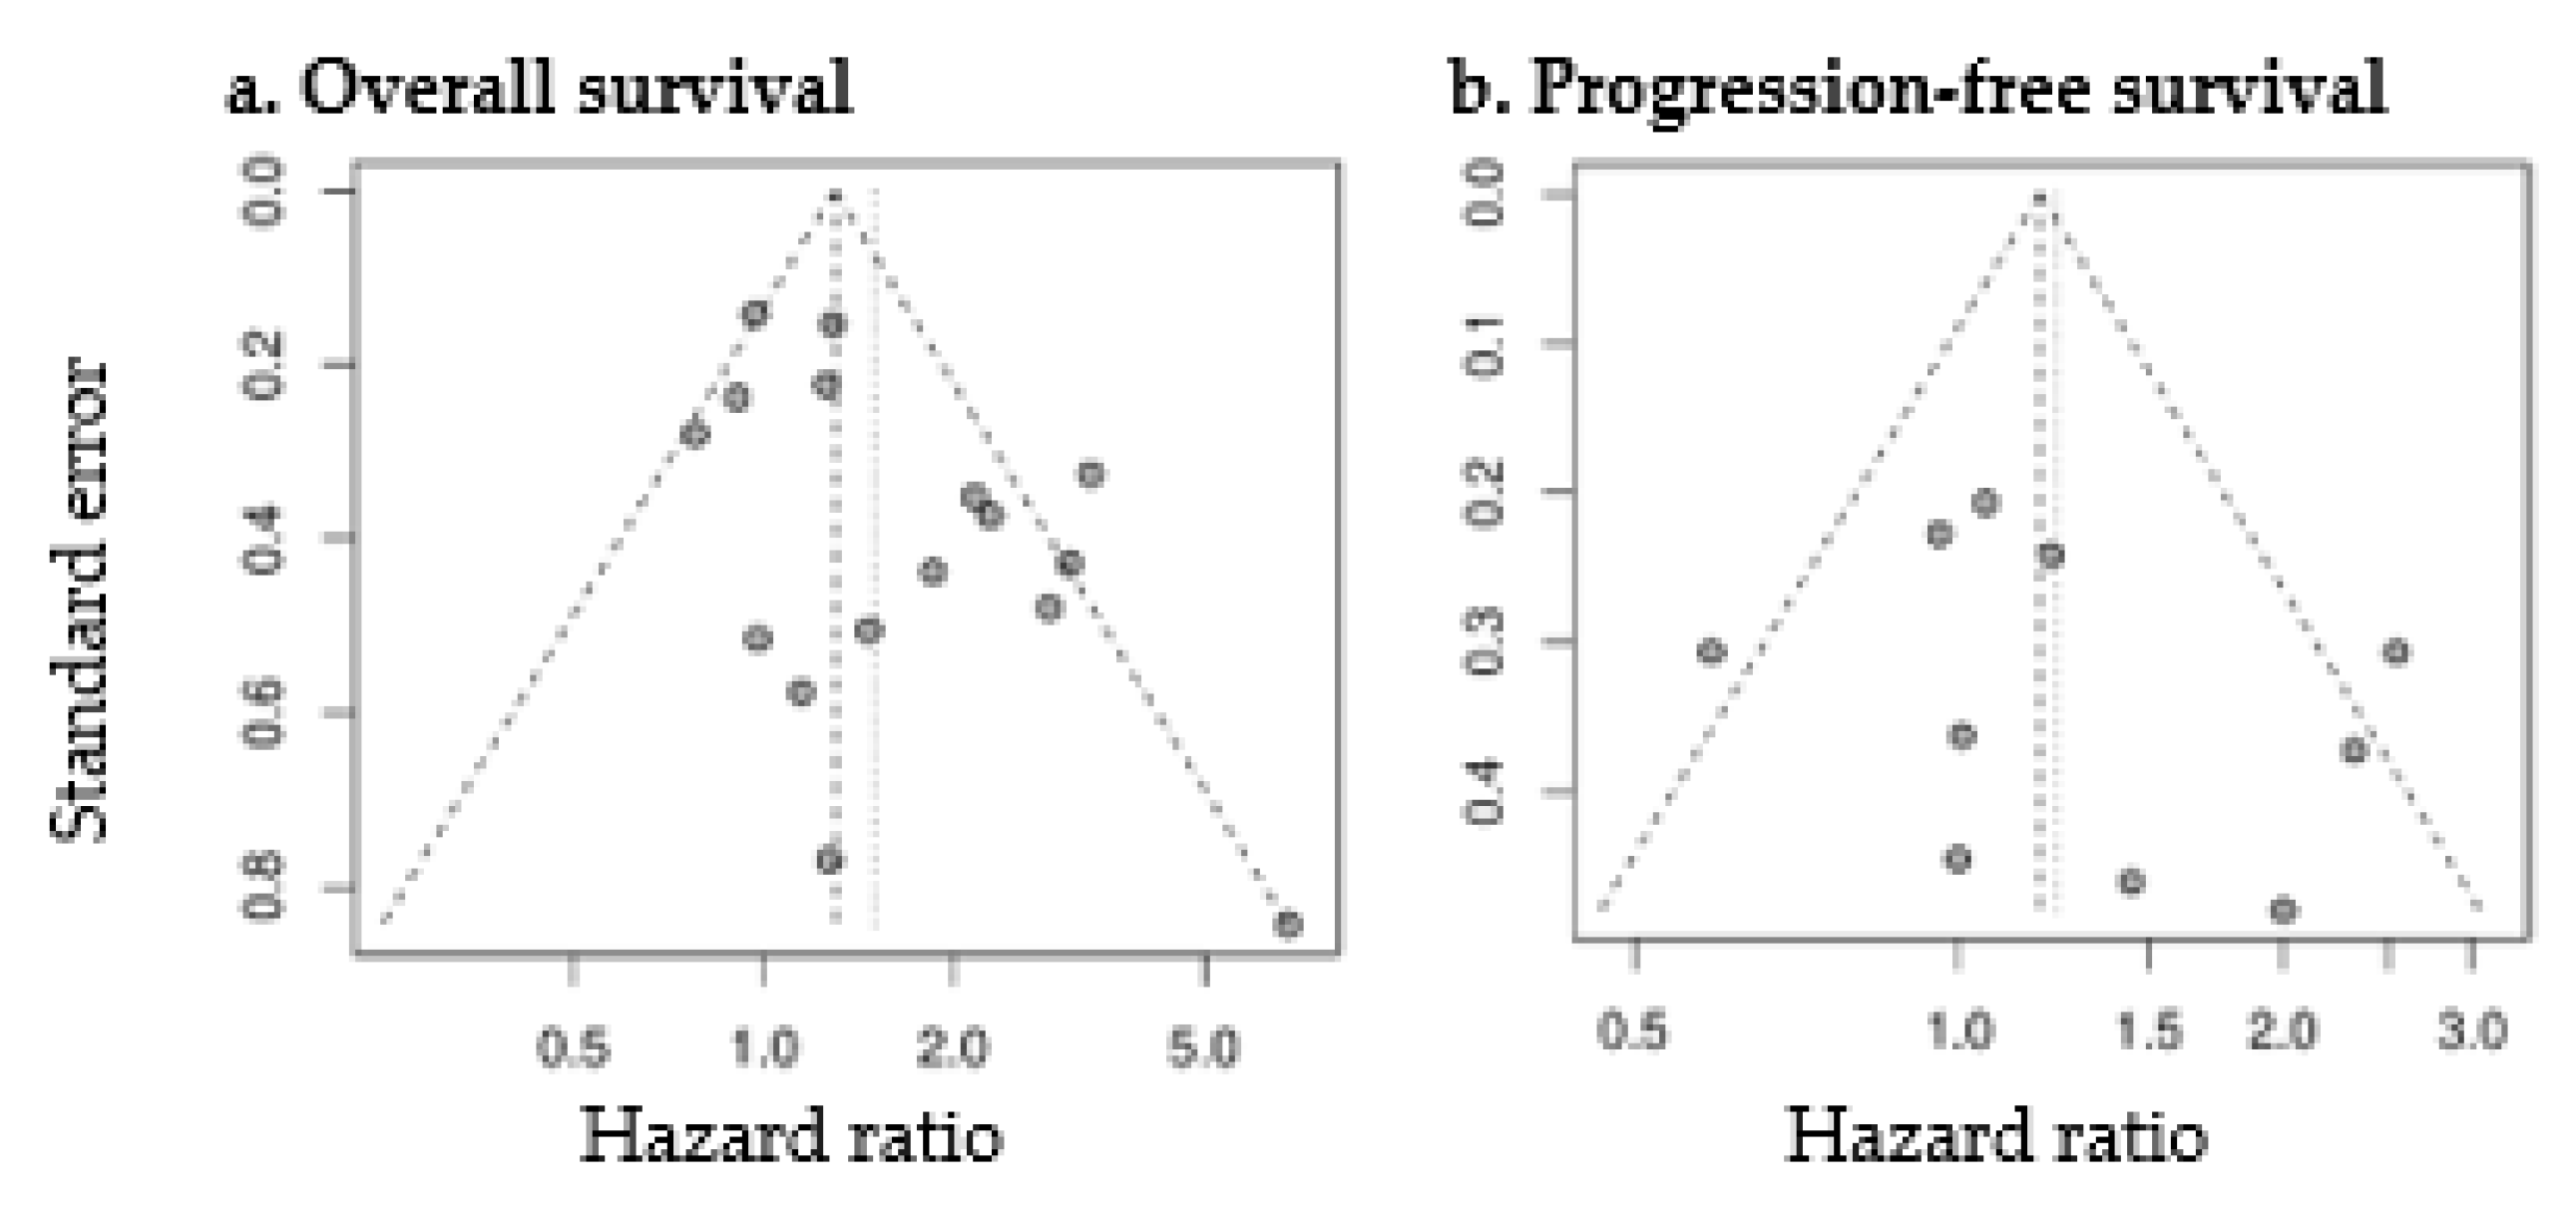
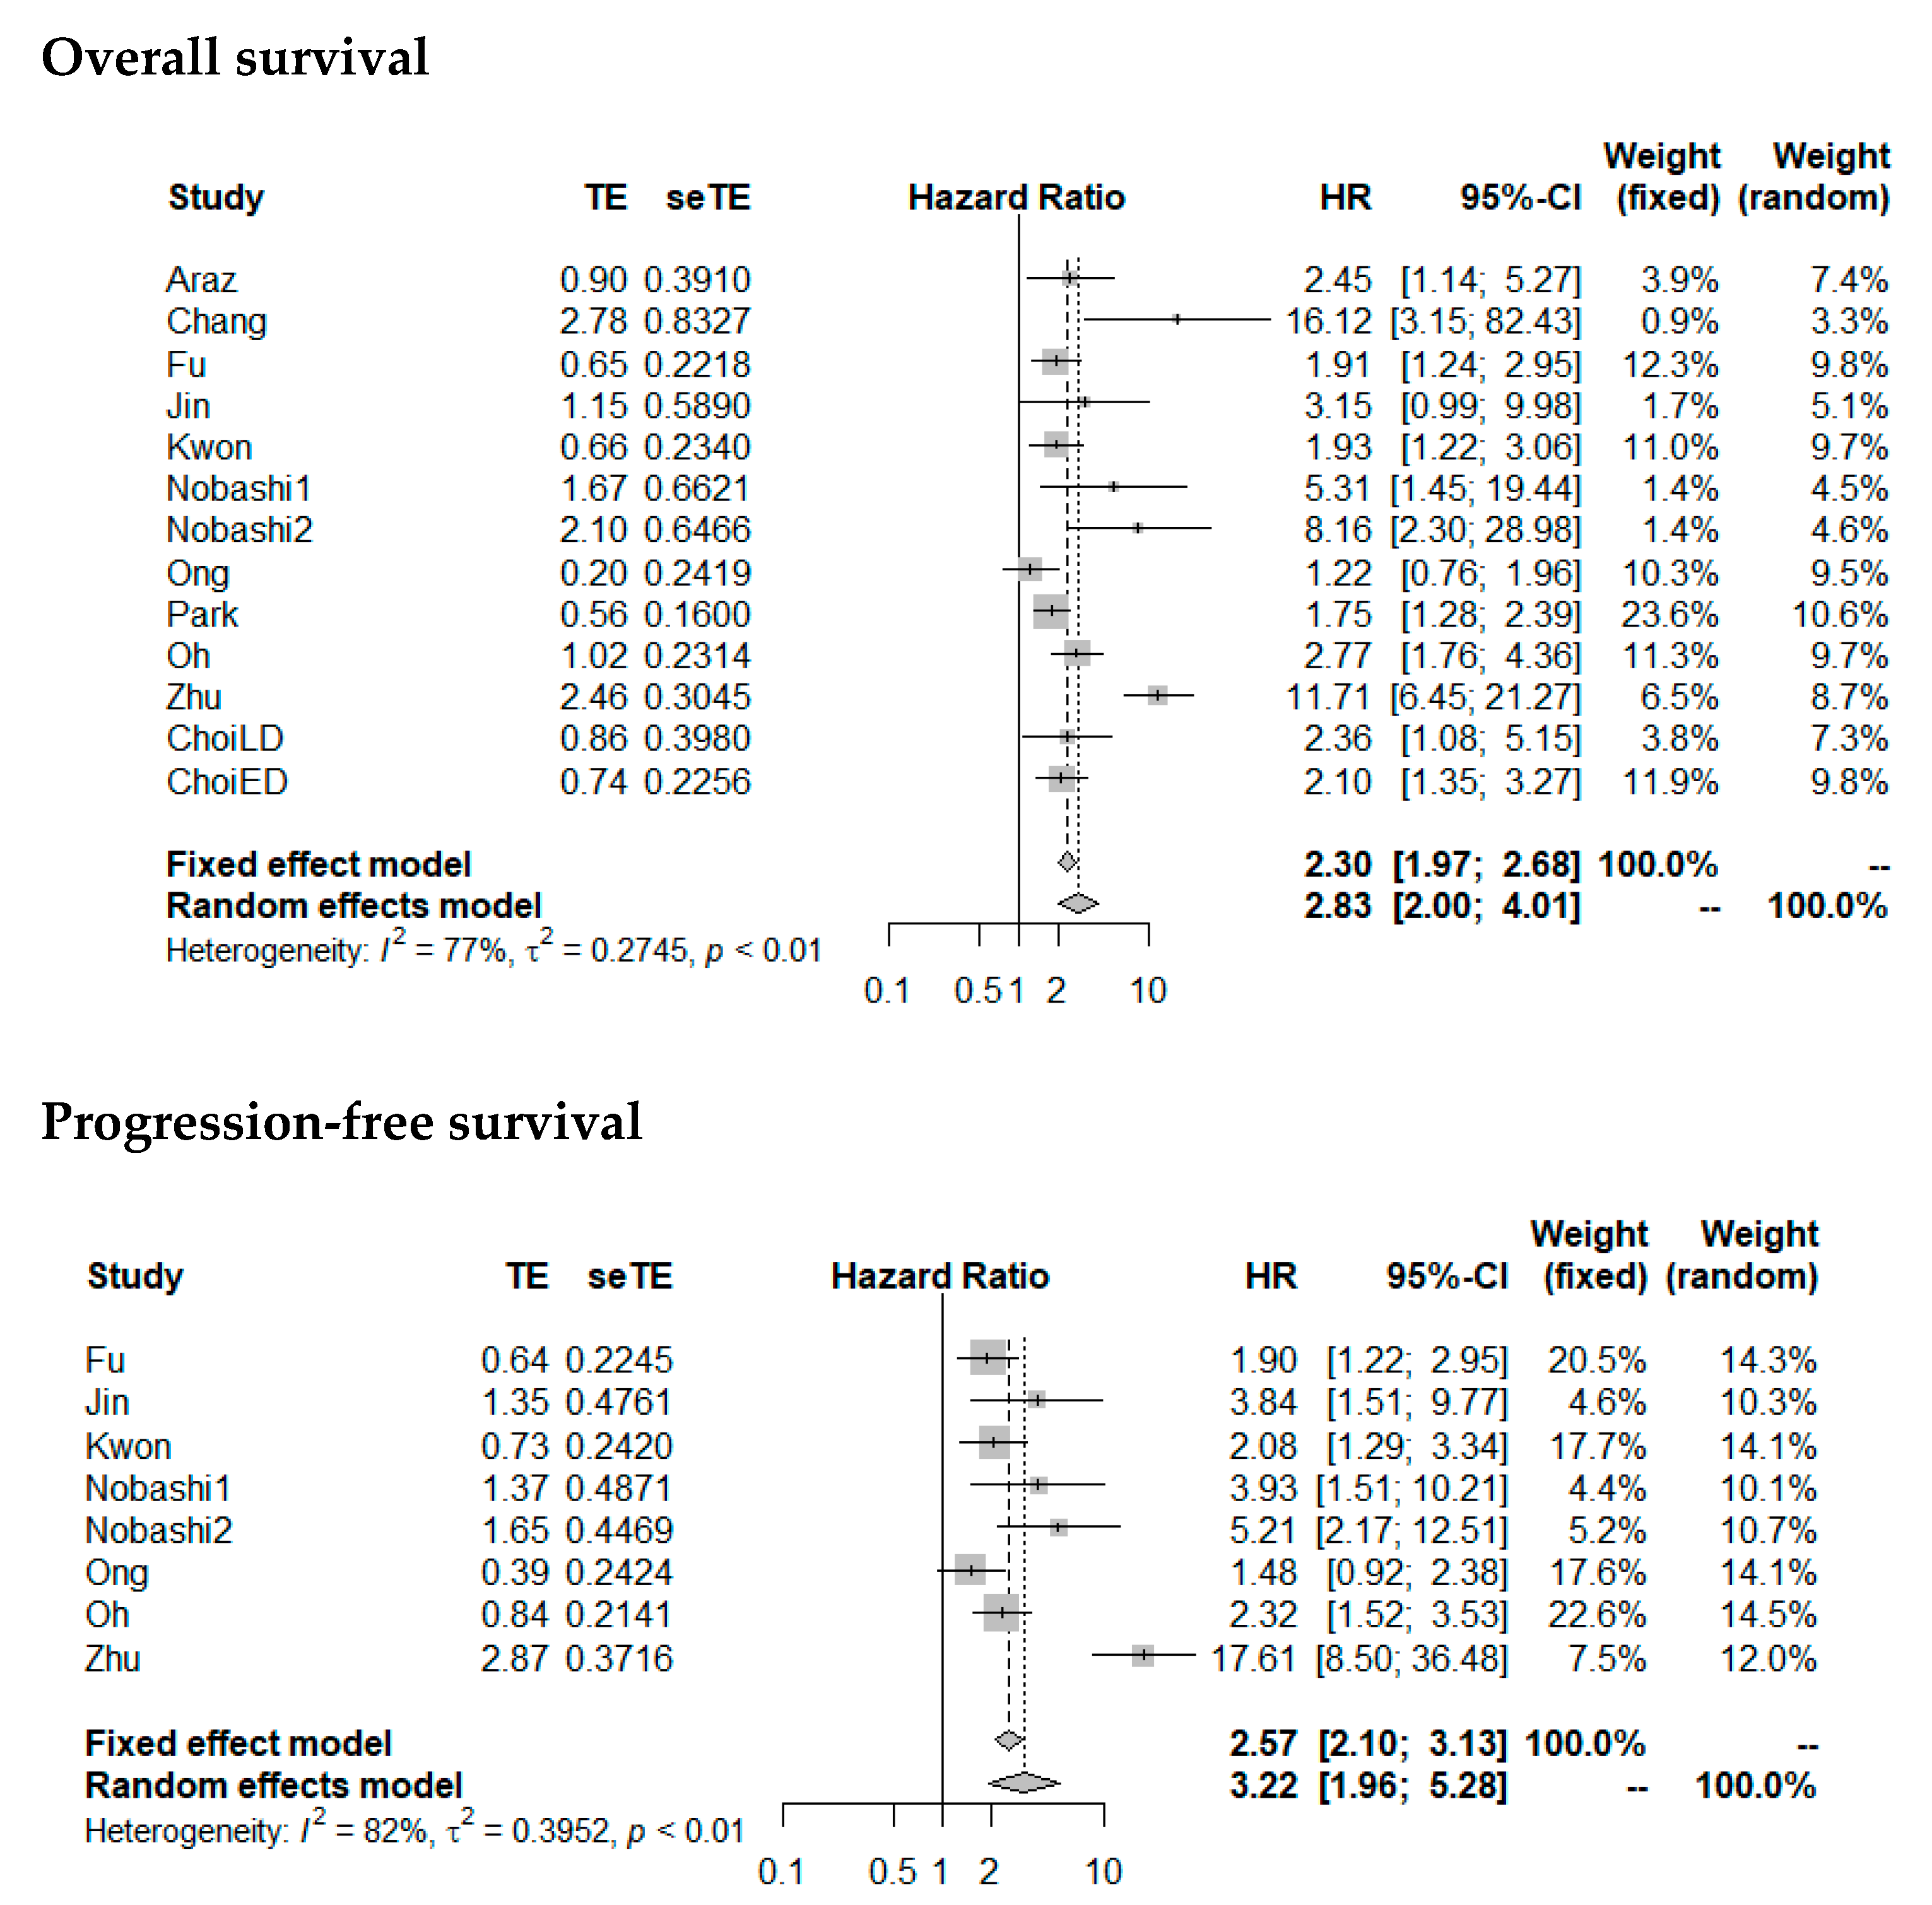
3.6. Quantitative Analysis: Prognostic Value of Baseline PET Parameters
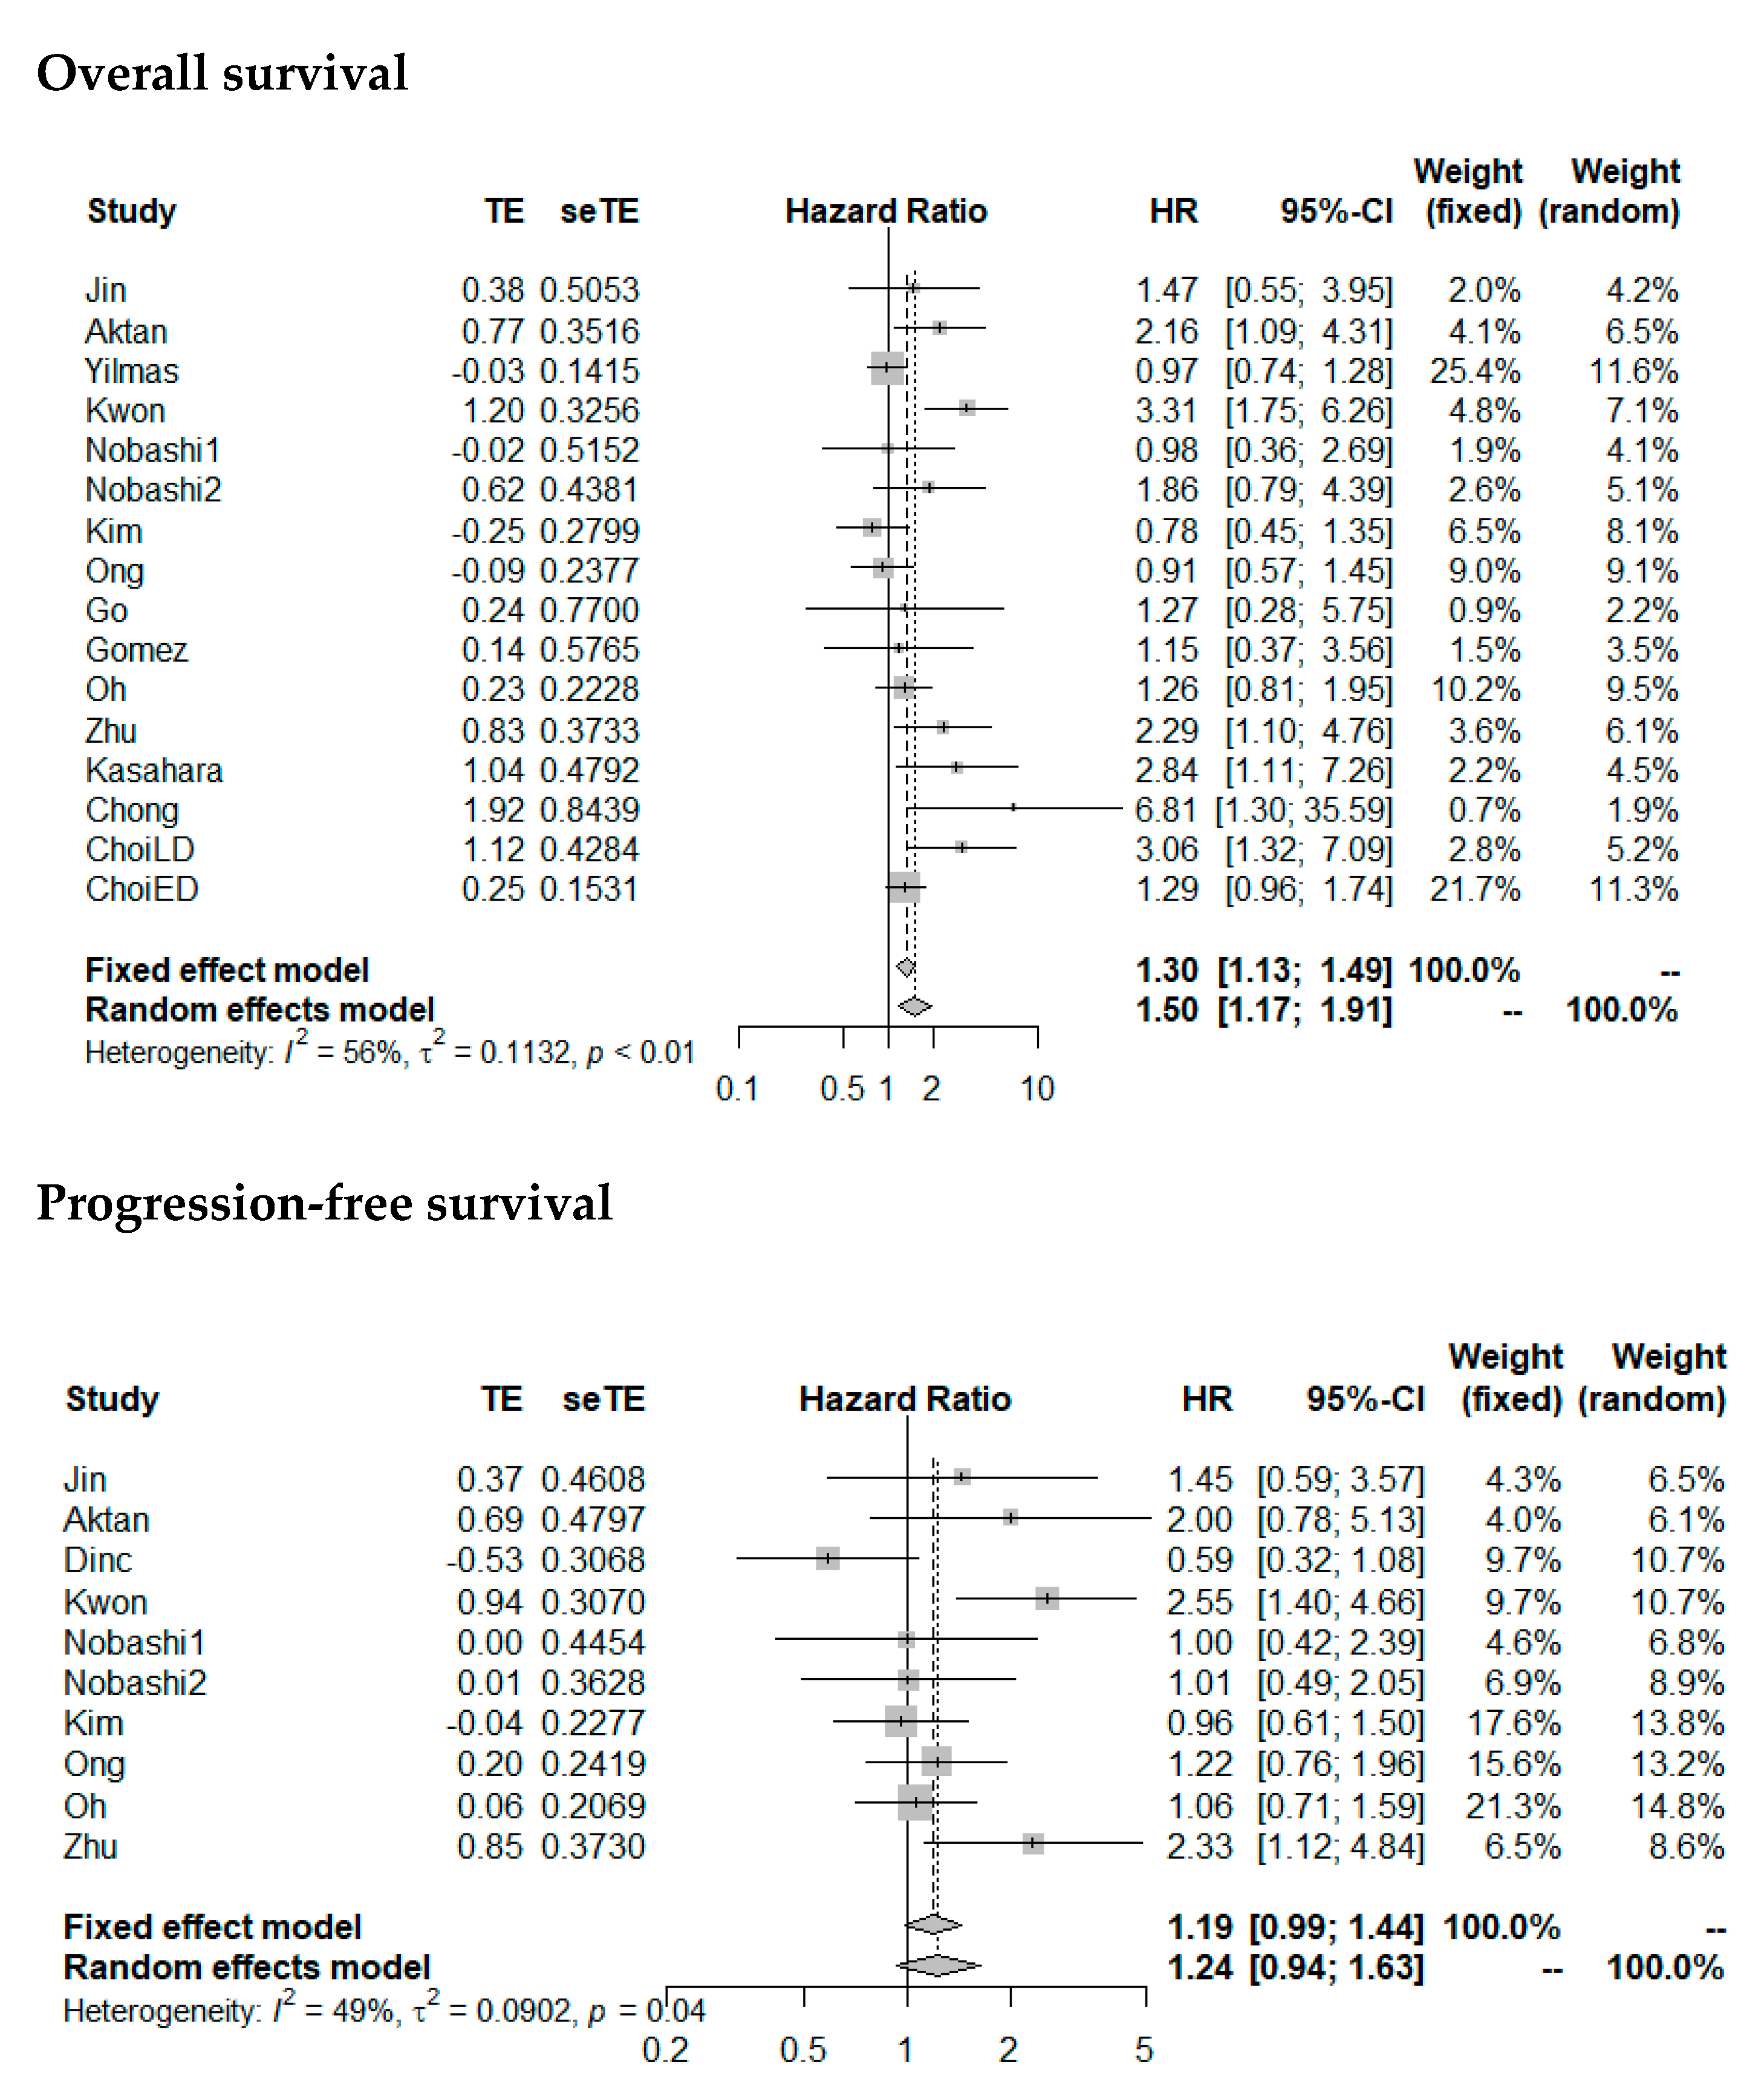
3.6.1. Baseline SUVmax
3.6.2. Baseline MTV
4. Discussion
5. Conclusions
Supplementary Materials
Author Contributions
Funding
Conflicts of Interest
References
- Dayen, C.; Debieuvre, D.; Molinier, O.; Raffy, O.; Paganin, F.; Virally, J.; Larive, S.; Desurmont-Salasc, B.; Perrichon, M.; Martin, F.; et al. New insights into stage and prognosis in small cell lung cancer: An analysis of 968 cases. J. Thorac. Dis. 2017, 9, 5101–5111. [Google Scholar] [CrossRef] [PubMed] [Green Version]
- Lattuca-Truc, M.; Timsit, J.F.; Levra, M.G.; Ruckly, S.; Villa, J.; Dumas, I.; Pinsolle, J.; Ferrer, L.; Guillem, P.; Moro-Sibilot, D.; et al. Trends in response rate and survival in small-cell lung cancer patients between 1997 and 2017. Lung Cancer 2019, 131, 122–127. [Google Scholar] [CrossRef] [PubMed]
- Yang, S.; Zhang, Z.; Wang, Q. Emerging therapies for small cell lung cancer. J. Hematol. Oncol. 2019, 12, 47. [Google Scholar] [CrossRef] [PubMed] [Green Version]
- Wang, S.; Zimmermann, S.; Parikh, K.; Mansfield, A.S.; Adjei, A.A. Current Diagnosis and Management of Small-Cell Lung Cancer. Mayo Clin. Proc. 2019, 94, 1599–1622. [Google Scholar] [CrossRef]
- Zhou, T.; Zhang, Z.; Luo, F.; Zhao, Y.; Hou, X.; Liu, T.; Wang, K.; Zhao, H.; Huang, Y.; Zhang, L. Comparison of First-Line Treatments for Patients with Extensive-Stage Small Cell Lung Cancer: A Systematic Review and Network Meta-analysis. JAMA Netw. Open 2020, 3, e2015748. [Google Scholar] [CrossRef]
- Ruben, J.D.; Ball, D.L. The efficacy of PET staging for small-cell lung cancer: A systematic review and cost analysis in the Australian setting. J. Thorac. Oncol. 2012, 7, 1015–1020. [Google Scholar] [CrossRef] [Green Version]
- Fischer, B.M.; Mortensen, J.; Langer, S.W.; Loft, A.; Berthelsen, A.K.; Petersen, B.I.; Daugaard, G.; Lassen, U.; Hansen, H.H. A prospective study of PET/CT in initial staging of small-cell lung cancer: Comparison with CT, bone scintigraphy and bone marrow analysis. Ann. Oncol. 2007, 18, 338–345. [Google Scholar] [CrossRef]
- Van Loon, J.; van Baardwijk, A.; Boersma, L.; Ollers, M.; Lambin, P.; De Ruysscher, D. Therapeutic implications of molecular imaging with PET in the combined modality treatment of lung cancer. Cancer Treat. Rev. 2011, 37, 331–343. [Google Scholar] [CrossRef]
- Langer, N.H.; Christensen, T.N.; Langer, S.W.; Kjaer, A.; Fischer, B.M. PET/CT in therapy evaluation of patients with lung cancer. Expert Rev. Anticancer Ther. 2014, 14, 595–620. [Google Scholar] [CrossRef]
- Fischer, B.M.; Mortensen, J.; Langer, S.W.; Loft, A.; Berthelsen, A.K.; Daugaard, G.; Lassen, U.; Hansen, H.H. PET/CT imaging in response evaluation of patients with small cell lung cancer. Lung Cancer 2006, 54, 41–49. [Google Scholar] [CrossRef]
- Hayden, J.A.; van der Windt, D.A.; Cartwright, J.L.; Cote, P.; Bombardier, C. Assessing bias in studies of prognostic factors. Ann. Intern. Med. 2013, 158, 280–286. [Google Scholar] [CrossRef] [PubMed]
- Oh, J.R.; Seo, J.H.; Chong, A.; Min, J.J.; Song, H.C.; Kim, Y.C.; Bom, H.S. Whole-body metabolic tumour volume of 18F-FDG PET/CT improves the prediction of prognosis in small cell lung cancer. Eur. J. Nucl. Med. Mol. Imaging 2012, 39, 925–935. [Google Scholar] [CrossRef] [PubMed]
- Oh, J.R.; Seo, J.H.; Hong, C.M.; Jeong, S.Y.; Lee, S.W.; Lee, J.; Min, J.J.; Song, H.C.; Bom, H.S.; Kim, Y.C.; et al. Extra-thoracic tumor burden but not thoracic tumor burden on (18)F-FDG PET/CT is an independent prognostic biomarker for extensive-disease small cell lung cancer. Lung Cancer 2013, 81, 218–225. [Google Scholar] [CrossRef] [PubMed]
- Kim, M.H.; Lee, J.S.; Mok, J.H.; Lee, K.; Kim, K.U.; Park, H.K.; Kim, S.J.; Lee, M.K. Metabolic burden measured by (18)f-fluorodeoxyglucose positron emission tomography/computed tomography is a prognostic factor in patients with small cell lung cancer. Cancer Res. Treat. 2014, 46, 165–171. [Google Scholar] [CrossRef] [PubMed]
- Kim, S.J.; Chang, S. Limited Prognostic Value of SUV max Measured by F-18 FDG PET/CT in Newly Diagnosed Small Cell Lung Cancer Patients. Oncol. Res. Treat. 2015, 38, 577–585. [Google Scholar] [CrossRef]
- Jin, F.; Qu, B.; Fu, Z.; Zhang, Y.; Han, A.; Kong, L.; Yu, J. Prognostic Value of Metabolic Parameters of Metastatic Lymph Nodes on (18)F-FDG PET/CT in Patients With Limited-stage Small-cell Lung Cancer With Lymph Node Involvement. Clin. Lung Cancer 2018, 19, e101–e108. [Google Scholar] [CrossRef]
- Gomez, D.R.; Gladish, G.W.; Wei, X.; Kotamarti, K.R.; Allen, P.K.; Cox, J.D.; O’Reilly, M.S.; Erasmus, J.J.; Fossella, F.V.; Komaki, R. Prognostic value of positron emission tomography/computed tomography findings in limited-stage small cell lung cancer before chemoradiation therapy. Am. J. Clin. Oncol. 2014, 37, 77–80. [Google Scholar] [CrossRef]
- Choi, E.K.; Park, M.; Im, J.J.; Chung, Y.A.; Oh, J.K. Prognostic value of (18)F-FDG PET/CT metabolic parameters in small cell lung cancer. J. Int. Med. Res. 2019. [Google Scholar] [CrossRef]
- Kasahara, N.; Kaira, K.; Yamaguchi, K.; Masubuchi, H.; Tsurumaki, H.; Hara, K.; Koga, Y.; Sakurai, R.; Higuchi, T.; Handa, T.; et al. Fluorodeoxyglucose uptake is associated with low tumor-infiltrating lymphocyte levels in patients with small cell lung cancer. Lung Cancer 2019, 134, 180–186. [Google Scholar] [CrossRef]
- Aktan, M.; Koc, M.; Kanyilmaz, G.; Yavuz, B.B. Prognostic value of pre-treatment (18)F-FDG-PET uptake in small-cell lung cancer. Ann. Nucl. Med. 2017, 31, 462–468. [Google Scholar] [CrossRef]
- Kwon, S.H.; Hyun, S.H.; Yoon, J.K.; An, Y.S.; Oh, Y.T.; Choi, J.H.; Park, K.J.; Lee, S.J. The Highest Metabolic Activity on FDG PET Is Associated with Overall Survival in Limited-Stage Small-Cell Lung Cancer. Medicine 2016, 95, e2772. [Google Scholar] [CrossRef]
- Van der Leest, C.; Smit, E.F.; Baas, J.; Versteijlen, R.J.; van Walree, N.; Hoogsteden, H.C.; Aerts, J.G. SUVmax during 18FDG-PET scanning in small cell lung cancer: Similar information as in non-small cell lung cancer? Lung Cancer 2012, 76, 67–71. [Google Scholar] [CrossRef]
- Zhu, D.; Ma, T.; Niu, Z.; Zheng, J.; Han, A.; Zhao, S.; Yu, J. Prognostic significance of metabolic parameters measured by (18)F-fluorodeoxyglucose positron emission tomography/computed tomography in patients with small cell lung cancer. Lung Cancer 2011, 73, 332–337. [Google Scholar] [CrossRef]
- Chong, S.; Lee, K.S.; Kim, B.T.; Choi, J.Y.; Yi, C.A.; Chung, M.J.; Oh, D.K.; Lee, J.Y. Integrated PET/CT of pulmonary neuroendocrine tumors: Diagnostic and prognostic implications. AJR Am. J. Roentgenol. 2007, 188, 1223–1231. [Google Scholar] [CrossRef]
- Ozdemir, O.; Batum, O.; Ermin, S.; Aksel, N.; Komurcuoglu, B.; Mertoglu, A.; Deniz, S.; Balci, G.; Koparal, H.; Ozbilek, E.; et al. Metabolic activity of primary tumour on PET/CT has a relationship with survival in stages I-III small-cell lung carcinoma. Clin. Respir. J. 2020. [Google Scholar] [CrossRef]
- Araz, M.; Soydal, C.; Ozkan, E.; Sen, E.; Nak, D.; Kucuk, O.N.; Gonullu, U.; Kir, K.M. Prognostic value of metabolic parameters on baseline 18F-FDG PET/CT in small cell lung cancer. Q. J. Nucl. Med. Mol. Imaging 2019. [Google Scholar] [CrossRef]
- Chang, H.; Lee, S.J.; Lim, J.; Lee, J.S.; Kim, Y.J.; Lee, W.W. Prognostic significance of metabolic parameters measured by (18)F-FDG PET/CT in limited-stage small-cell lung carcinoma. J. Cancer Res. Clin. Oncol. 2019. [Google Scholar] [CrossRef]
- Fu, L.; Zhu, Y.; Jing, W.; Guo, D.; Kong, L.; Yu, J. Incorporation of circulating tumor cells and whole-body metabolic tumor volume of (18)F-FDG PET/CT improves prediction of outcome in IIIB stage small-cell lung cancer. Chin. J. Cancer Res. 2018, 30, 596–604. [Google Scholar] [CrossRef]
- Kim, H.; Yoo, I.R.; Boo, S.H.; Park, H.L.; Kim, S.H. Prognostic Value of Pre- and Post-Treatment FDG PET/CT Parameters in Small Cell Lung Cancer Patients. Nucl. Med. Mol. Imaging 2018, 52, 31–38. [Google Scholar] [CrossRef]
- Yilmaz Demirci, N.; Yilmaz, U.; Biner Uslu, I.; Dikmen, A.; Yilmaz, A.; Erdogan, Y. Prognostic significance of standardised uptake value (SUVmax) measured on 18F-fluorodeoxyglucose positron emission tomography/computed tomography in patients with small cell lung cancer. Eur. J. Cancer Care 2017, 26. [Google Scholar] [CrossRef]
- Dinc, N.S.; Aydin, K.; Odabas, H.; Ercelep, O.; Tufan, G.; Seker, M.; Yasar, N.; Aydin, D.; Yuksel, S.; Mert, A.; et al. Pretreatment PET/CT Standardized Uptake Values Play a Role in Predicting Response to Treatment and Survival in Patients with Small Cell Lung Cancer. Oncol. Res. Treat. 2016, 39, 130–134. [Google Scholar] [CrossRef]
- Nobashi, T.; Koyasu, S.; Nakamoto, Y.; Kubo, T.; Ishimori, T.; Kim, Y.H.; Yoshizawa, A.; Togashi, K. Prognostic value of fluorine-18 fludeoxyglucose positron emission tomography parameters differs according to primary tumour location in small-cell lung cancer. Br. J. Radiol. 2016, 89, 20150618. [Google Scholar] [CrossRef] [Green Version]
- Zer, A.; Domachevsky, L.; Rapson, Y.; Nidam, M.; Flex, D.; Allen, A.M.; Stemmer, S.M.; Groshar, D.; Bernstine, H. The Role of 18F-FDG PET/CT on Staging and Prognosis in Patients with Small Cell Lung Cancer. Eur. Radiol. 2016, 26, 3155–3161. [Google Scholar] [CrossRef]
- Ong, L.T.; Dunphy, M.; Foster, A.; Woo, K.M.; Zhang, Z.; Perez, C.A.; Pietanza, C.M.; Rosenzweig, K.E.; Gelblum, D.Y.; Rimner, A.; et al. Prognostic Value of Preradiotherapy (18)F-FDG PET/CT Volumetrics in Limited-Stage Small-Cell Lung Cancer. Clin. Lung Cancer 2016, 17, 184–188. [Google Scholar] [CrossRef] [Green Version]
- Park, S.B.; Choi, J.Y.; Moon, S.H.; Yoo, J.; Kim, H.; Ahn, Y.C.; Ahn, M.J.; Park, K.; Kim, B.T. Prognostic value of volumetric metabolic parameters measured by [18F]fluorodeoxyglucose-positron emission tomography/computed tomography in patients with small cell lung cancer. Cancer Imag. 2014, 14, 2. [Google Scholar] [CrossRef] [Green Version]
- Lee, J.; Kim, J.O.; Jung, C.K.; Kim, Y.S.; Yoo, I.R.; Choi, W.H.; Jeon, E.K.; Hong, S.H.; Chun, S.H.; Kim, S.J.; et al. Metabolic activity on [18f]-fluorodeoxyglucose-positron emission tomography/computed tomography and glucose transporter-1 expression might predict clinical outcomes in patients with limited disease small-cell lung cancer who receive concurrent chemoradiation. Clin. Lung Cancer. 2014, 15, e13–e21. [Google Scholar] [CrossRef] [PubMed]
- Go, S.I.; Song, H.N.; Kang, J.H.; Kang, M.H.; Kim, M.J.; Jung, J.; Chung, S.I.; Choi, B.H.; Hwang, I.G.; Kim, S.H.; et al. The clinical impact of the sum of the maximum standardized uptake value on the pretreatment with F-FDG-PET/CT in small-cell lung cancer. Oncology 2014, 86, 1–9. [Google Scholar] [CrossRef] [PubMed]
- Inal, A.; Kucukoner, M.; Kaplan, M.A.; Urakci, Z.; Nas, N.; Guven, M.; Dostbil, Z.; Altindag, S.; Isikdogan, A. Is (18)F-FDG-PET/CT prognostic factor for survival in patients with small cell lung cancer? Single center experience. Rev. Port. Pneumol. 2013, 19, 260–265. [Google Scholar] [CrossRef] [Green Version]
- Jhun, B.W.; Lee, K.J.; Jeon, K.; Suh, G.Y.; Chung, M.P.; Kim, H.; Kwon, O.J.; Sun, J.M.; Ahn, J.S.; Ahn, M.J.; et al. Clinical applicability of staging small cell lung cancer according to the seventh edition of the TNM staging system. Lung Cancer 2013, 81, 65–70. [Google Scholar] [CrossRef] [PubMed]
- Lee, Y.J.; Cho, A.; Cho, B.C.; Yun, M.; Kim, S.K.; Chang, J.; Moon, J.W.; Park, I.K.; Choi, H.J.; Kim, J.H. High tumor metabolic activity as measured by fluorodeoxyglucose positron emission tomography is associated with poor prognosis in limited and extensive stage small-cell lung cancer. Clin. Cancer Res. 2009, 15, 2426–2432. [Google Scholar] [CrossRef] [Green Version]
- Pandit, N.; Gonen, M.; Krug, L.; Larson, S.M. Prognostic value of [18F]FDG-PET imaging in small cell lung cancer. Eur. J. Nucl. Med. Mol. Imaging 2003, 30, 78–84. [Google Scholar] [CrossRef]
- Quartuccio, N.; Evangelista, L.; Alongi, P.; Caobelli, F.; Altini, C.; Cistaro, A.; Lambertini, A.; Schiorlin, I.; Popescu, C.E.; Linguanti, F.; et al. Prognostic and diagnostic value of [18F]FDG-PET/CT in restaging patients with small cell lung carcinoma: An Italian multicenter study. Nucl. Med. Commun. 2019. [Google Scholar] [CrossRef]
- Ziai, D.; Wagner, T.; El Badaoui, A.; Hitzel, A.; Woillard, J.B.; Melloni, B.; Monteil, J. Therapy response evaluation with FDG-PET/CT in small cell lung cancer: A prognostic and comparison study of the PERCIST and EORTC criteria. Cancer Imag. 2013, 13, 73–80. [Google Scholar] [CrossRef]
- Onitilo, A.A.; Engel, J.M.; Demos, J.M.; Mukesh, B. Prognostic significance of 18 F-fluorodeoxyglucose—positron emission tomography after treatment in patients with limited stage small cell lung cancer. Clin. Med. Res. 2008, 6, 72–77. [Google Scholar] [CrossRef] [Green Version]
- Blum, R.; MacManus, M.P.; Rischin, D.; Michael, M.; Ball, D.; Hicks, R.J. Impact of positron emission tomography on the management of patients with small-cell lung cancer: Preliminary experience. Am. J. Clin. Oncol. 2004, 27, 164–171. [Google Scholar] [CrossRef]
- Van Loon, J.; Offermann, C.; Ollers, M.; van Elmpt, W.; Vegt, E.; Rahmy, A.; Dingemans, A.M.; Lambin, P.; De Ruysscher, D. Early CT and FDG-metabolic tumour volume changes show a significant correlation with survival in stage I-III small cell lung cancer: A hypothesis generating study. Radiother. Oncol. J. Eur. Soc. Ther. Radiol. Oncol. 2011, 99, 172–175. [Google Scholar] [CrossRef] [Green Version]
- Mirili, C.; Guney, I.B.; Paydas, S.; Seydaoglu, G.; Kapukaya, T.K.; Ogul, A.; Gokcay, S.; Buyuksimsek, M.; Yetisir, A.E.; Karaalioglu, B.; et al. Prognostic significance of neutrophil/lymphocyte ratio (NLR) and correlation with PET-CT metabolic parameters in small cell lung cancer (SCLC). Int. J. Clin. Oncol. 2019, 24, 168–178. [Google Scholar] [CrossRef]
- Reymen, B.; Van Loon, J.; van Baardwijk, A.; Wanders, R.; Borger, J.; Dingemans, A.M.; Bootsma, G.; Pitz, C.; Lunde, R.; Geraedts, W.; et al. Total gross tumor volume is an independent prognostic factor in patients treated with selective nodal irradiation for stage I to III small cell lung cancer. Int. J. Radiat. Oncol. Biol. Phys. 2013, 85, 1319–1324. [Google Scholar] [CrossRef]
- Arslan, N.; Tuncel, M.; Kuzhan, O.; Alagoz, E.; Budakoglu, B.; Ozet, A.; Ozguven, M.A. Evaluation of outcome prediction and disease extension by quantitative 2-deoxy-2-[18F] fluoro-D-glucose with positron emission tomography in patients with small cell lung cancer. Ann. Nucl. Med. 2011, 25, 406–413. [Google Scholar] [CrossRef]
- Zhu, D.; Wang, Y.; Wang, L.; Chen, J.; Byanju, S.; Zhang, H.; Liao, M. Prognostic value of the maximum standardized uptake value of pre-treatment primary lesions in small-cell lung cancer on 18F-FDG PET/CT: A meta-analysis. Acta Radiol. 2017, 284185117745907. [Google Scholar] [CrossRef]
- Im, H.J.; Pak, K.; Cheon, G.J.; Kang, K.W.; Kim, S.J.; Kim, I.J.; Chung, J.K.; Kim, E.E.; Lee, D.S. Prognostic value of volumetric parameters of (18)F-FDG PET in non-small-cell lung cancer: A meta-analysis. Eur. J. Nucl. Med. Mol. Imaging 2015, 42, 241–251. [Google Scholar] [CrossRef]
- Xie, M.; Wu, K.; Liu, Y.; Jiang, Q.; Xie, Y. Predictive value of F-18 FDG PET/CT quantization parameters in diffuse large B cell lymphoma: A meta-analysis with 702 participants. Med. Oncol. 2015, 32, 446. [Google Scholar] [CrossRef]
- Bonomo, P.; Merlotti, A.; Olmetto, E.; Bianchi, A.; Desideri, I.; Bacigalupo, A.; Franco, P.; Franzese, C.; Orlandi, E.; Livi, L.; et al. What is the prognostic impact of FDG PET in locally advanced head and neck squamous cell carcinoma treated with concomitant chemo-radiotherapy? A systematic review and meta-analysis. Eur. J. Nucl. Med. Mol. Imaging 2018, 45, 2122–2138. [Google Scholar] [CrossRef] [Green Version]
- Wen, W.; Xuan, D.; Hu, Y.; Li, X.; Liu, L.; Xu, D. Prognostic value of maximum standard uptake value, metabolic tumor volume, and total lesion glycolysis of positron emission tomography/computed tomography in patients with breast cancer: A systematic review and meta-analysis. PLoS ONE 2019, 14, e0225959. [Google Scholar] [CrossRef]
- Cheng, G.; Huang, H. Prognostic Value of (18)F-Fluorodeoxyglucose PET/Computed Tomography in Non-Small-Cell Lung Cancer. PET Clin. 2018, 13, 59–72. [Google Scholar] [CrossRef]
- Han, S.; Woo, S.; Suh, C.H.; Kim, Y.J.; Oh, J.S.; Lee, J.J. A systematic review of the prognostic value of texture analysis in (18)F-FDG PET in lung cancer. Ann. Nucl. Med. 2018, 32, 602–610. [Google Scholar] [CrossRef]
- Krarup, M.M.K.; Nygard, L.; Vogelius, I.R.; Andersen, F.L.; Cook, G.; Goh, V.; Fischer, B.M. Heterogeneity in tumours: Validating the use of radiomic features on (18)F-FDG PET/CT scans of lung cancer patients as a prognostic tool. Radiother. Oncol. J. Eur. Soc. Ther. Radiol. Oncol. 2020, 144, 72–78. [Google Scholar] [CrossRef]
- Finkle, J.H.; Penney, B.C.; Pu, Y. An updated and validated PET/CT volumetric prognostic index for non-small cell lung cancer. Lung Cancer 2018, 123, 136–141. [Google Scholar] [CrossRef]
- Riley, R.D.; Moons, K.G.M.; Snell, K.I.E.; Ensor, J.; Hooft, L.; Altman, D.G.; Hayden, J.; Collins, G.S.; Debray, T.P.A. A guide to systematic review and meta-analysis of prognostic factor studies. BMJ 2019, 364, k4597. [Google Scholar] [CrossRef] [Green Version]
- Sterne, J.A.; Sutton, A.J.; Ioannidis, J.P.; Terrin, N.; Jones, D.R.; Lau, J.; Carpenter, J.; Rucker, G.; Harbord, R.M.; Schmid, C.H.; et al. Recommendations for examining and interpreting funnel plot asymmetry in meta-analyses of randomised controlled trials. BMJ 2011, 343, d4002. [Google Scholar] [CrossRef] [Green Version]
- Debray, T.P.A.; Moons, K.G.M.; Riley, R.D. Detecting small-study effects and funnel plot asymmetry in meta-analysis of survival data: A comparison of new and existing tests. Res. Synth. Methods 2018, 9, 41–50. [Google Scholar] [CrossRef] [Green Version]


| PET Parameters in Included Studies | Definition | |
|---|---|---|
| SUV: Standardized uptake value | FDG uptake measured as the ratio of radioactivity in a region of interest (ROI) (voxel, cm3, tumor) and the mean radioactivity across the whole body | |
| SUVmax | The highest single-voxel SUV in a predefined ROI | |
| tSUVmax | SUVmax in the primary tumor | |
| nSUVmax | SUVmax in regional lymph node metastases | |
| mSUVmax | SUVmax in distant metastases | |
| tnSUVmax | SUVmax in the primary tumor and regional lymph node metastases | |
| wbSUVmax | SUVmax in all malignant lesions throughout the whole body | |
| thoracicSUVmax | SUVmax in intrathoracic malignant lesions (lung, pleura, mediastinum) | |
| extrathoracicSUVmax | SUVmax in extrathoracic malignant lesions | |
| tn-meanSUVmax | Average of SUVmax from primary tumor and regional lymph node metastases | |
| wb-meanSUVmax | Average of SUVmax from each malignant lesion throughout the whole body | |
| wb-sumSUVmax | Sum of all SUVmax from each malignant lesion throughout the whole body | |
| ΔtSUVmax | Change of tSUVmax (e.g., from baseline to end of therapy) | |
| SUVpeak | Average of SUV within a small region of interest (e.g., 1 cm3) centered at the most active area in the tumor | |
| tSUVpeak | SUVpeak in the primary tumor | |
| wbSUVpeak | SUVpeak in all malignant lesions throughout the whole body | |
| ΔtSUVpeak | Change of tSUVpeak (e.g., from baseline to end of therapy) | |
| SUVmean | Average of SUV in an MTV; suffix indicates delineation method for MTV | |
| tSUVmean2.5 | SUVmean in MTV2.5 in the primary tumor | |
| tSUVmean40 | SUVmean in MTV40 in the primary tumor | |
| tSUVmean42 | SUVmean in MTV42 in the primary tumor | |
| nSUVmean2.5 | SUVmean in MTV2.5 in regional lymph node metastases | |
| nSUVmean40 | SUVmean in MTV40 in regional lymph node metastases | |
| mSUVmean40 | SUVmean in MTV40 in distant metastases | |
| wbSUVmean2.5 | SUVmean from all MTV2.5s throughout the whole body | |
| wbSUVmean(software) | SUVmean from all MTVsoftware throughout the whole body | |
| thoracicSUVmean(software) | SUVmean from MTVsoftware in intrathoracic malignant lesions (lung, pleura, mediastinum) | |
| wb-meanSUVmean2.5 | Average of SUVmean from each MTV2.5 throughout the whole body | |
| SULpeak | SUVpeak in a 1 cm3 sphere normalized to lean body mass; recommended by PERCIST | |
| Wb-sumSULpeak | Sum of maximum 5 SULpeak’s throughout the whole body | |
| ΔtSULpeak | Change of SULpeak (e.g., from baseline to end of therapy in the primary tumor) | |
| SUVmax(glu) | SUVmax corrected for blood glucose level | |
| tSUVmax(glu) | SUVmax(glu) in the primary tumor | |
| SUVmax(liver) | SUVmax corrected for SUV in the liver | |
| tSUVmax(liver) | SUVmax(liver) in the primary tumor | |
| ΔtSUVmax(liver) | Change of tSUVmax(liver) (e.g., from baseline to end of therapy) | |
| Δtn-meanSUVmax(liver) | Change of average of SUVmax(liver)s in primary tumor and regional lymph node metastases (e.g., from baseline to end of therapy) | |
| PET-positive | Presence of PET-vivid lesion | |
| wbPET-positive | PET-vivid lesions throughout the whole body | |
| tPET-positive | PET-vivid primary tumor | |
| nPET-positive | PET-vivid regional lymph node metastases | |
| mPET-positive | PET-vivid distant metastases | |
| MTV: Metabolic tumor volume | Tumor volume defined by FDG–PET; delineation of the tumor volume can be defined with a preset threshold, software based, or it can be determined visually | |
| MTV with fixed threshold | MTV delineated with a fixed threshold | |
| tMTV2.5 | MTV with SUV > 2.5 in the primary tumor | |
| nMTV2.5 | MTV with SUV > 2.5 in regional lymph nodes | |
| tnMTV2.5 | MTV with SUV > 2.5 in the primary tumor and regional lymph nodes | |
| wbMTV2.5 | MTV with SUV > 2.5 throughout the whole body | |
| ΔtnMTV2.5 | Change of tnMTV2.5 (e.g., from baseline to end of therapy) | |
| tMTV3.0 | MTV with SUV > 3.0 in the primary tumor | |
| wbMTV3.0 | MTV with SUV > 3.0 throughout the whole body | |
| thoracicMTV3.0 | MTV with SUV > 3.0 in intrathoracic malignant lesions (lung, pleura, mediastinum) | |
| ExtrathoracicMTV3.0 | Volume with SUV > 3.0 in extrathoracic malignant lesions | |
| hottest-tumorMTV3.0 | MTV with SUV > 3.0 in the hottest tumor throughout the whole body | |
| MTV with relative threshold | MTV delineated with a threshold relative to SUVmax | |
| tMTV40 | MTV with SUV > 40% of SUVmax in the primary tumor | |
| nMTV40 | MTV with SUV > 40% of SUVmax in regional lymph node metastases | |
| mMTV40 | MTV with SUV > 40% of SUVmax in distant metastases | |
| wbMTV40 | MTV with SUV > 40% of SUVmax throughout the whole body | |
| tMTV42 | MTV with SUV > 42% of SUVmax in the primary tumor | |
| tnMTV42 | MTV with SUV > 42% of SUVmax in the primary tumor and regional lymph node metastases | |
| wbMTV50 | MTV with SUV > 50% of SUVmax throughout the whole body | |
| ΔtnMTV40 | Change of MTV with SUV > 40% of SUVmax in primary tumor and regional lymph node metastases (e.g., from baseline to end of therapy) | |
| ΔtnMTV50 | Change of MTV with SUV > 50% of SUVmax in primary tumor and regional lymph node metastases (e.g., from baseline to end of therapy) | |
| MTV with software-based delineation | MTV delineated by software; studies included all used an isocontouring method with liver as background | |
| wbMTVsoftware | Software-based MTV throughout the whole body | |
| thoracicMTVsoftware | Software-based MTV in all intrathoracic malignant lesions (lung, pleura, mediastinum) | |
| GTV: gross tumor volume | Tumor volume used for radiotherapy planning consisting of regional lymph nodes defined before chemotherapy and tumor volume defined by PET post-chemotherapy | |
| GTV | ||
| TLG: Total lesion glycolysis | Parameter combining FDG uptake and tumor volume; calculated by multiplication of MTV and SUVmean within the MTV | |
| tTLG2.5 | MTV2.5 × SUVmean2.5 in primary tumor | |
| nTLG2.5 | MTV2.5 × SUVmean2.5 in regional lymph nodes | |
| tnTLG2.5 | MTV2.5 × SUVmean2.5 in primary tumor and regional lymph nodes | |
| wbTLG2.5 | MTV2.5 × SUVmean2.5 throughout the whole body | |
| ΔtnTLG2.5 | Change of tnTLG2.5 (e.g., from baseline to end of therapy) | |
| tTLG3.0 | TLG3.0 × SUVmean3.0 in primary tumor | |
| wbTLG3.0 | TLG3.0 × SUVmean3.0 throughout the whole body | |
| hottest-tumorTLG3.0 | TLG3.0 × SUVmean3.0 in the hottest tumor throughout the whole body | |
| tTLG40 | MTV40 × SUVmean40 in primary tumor | |
| nTLG40 | MTV40 × SUVmean40 in regional lymph node metastases | |
| mTLG40 | MTV40 × SUVmean40 in distant metastases | |
| wbTLG40 | MTV40 × SUVmean40 throughout the whole body | |
| tTLG42 | MTV42 × SUVmean42 in primary tumor | |
| tnTLG42 | MTV42 × SUVmean42 in primary tumor and regional lymph node metastases | |
| wbTLG50 | MTV50 × SUVmean50 throughout the whole body | |
| wbTLGsoftware | MTVsoftware × SUVmean(software) throughout the whole body | |
| thoracicTLGsoftware | MTVsoftware × SUVmean(software) in intrathoracic malignant lesions (lung, pleura, mediastinum) | |
| Study | Patients | Therapy | Endpoints | Univariate Analysis | Multivariate Analysis | ||||
|---|---|---|---|---|---|---|---|---|---|
| N (LD/ED) | CCRT/Cht/RT | SUVmax | Other Uptake Values | MTV | Compound Parameters | PET Parameters | Other Covariates | ||
| Özdemir 2020 [25] | 153 (153/0) | 94/59/0 | PFS OS | tSUVmax: n.s nSUVmax: n.s. | tSUVmax: OS nSUVmax: n.s. | LDH: n.s. Sex: n.s. Albumin: n.s. Cht: regimen: n.s. Treatment response: PFS + OS RT: PFS + OS | |||
| 119 (0/119) | 0/119/0 | PFS OS | tSUVmax: n.s nSUVmax: n.s. mSUVmax: n.s. | tSUVmax: n.s nSUVmax: n.s. mSUVmax: n.s. | LDH: OS Sex: n.s. Albumin: n.s. Cht: regimen: n.s. Treatment response: PFS + OS | ||||
| Choi 2019 [18] | 50 (50/0) | 38/11/1 | OS | tSUVmax: OS | tMTV3.0: n.s. wbMTV3.0: OS | tTLG3.0: n.s. wbTLG3.0: OS | tSUVmax: OS wbMTV3.0: n.s. wbTLG3.0: n.s. | Age n.s. Sex: n.s. | |
| 68 (0/68) | 0/65/3 | OS | wbSUVmax: n.s. | hottest-tumorMTV3.0: n.s. wbMTV3.0: OS | hottest-tumorTLG3.0: n.s. wbTLG3.0: OS | wbMTV3.0: OS wbTLG3.0: OS | Age: n.s. LDH: n.s. Sex: n.s. | ||
| Kasahara 2019 [19] | 98 (40/58) | NA | OS | tSUVmax: OS LD: tSUVmax: OS ED: tSUVmax: n.s. | tSUVmax: OS LD: tSUVmax: OS | Stage: OS PS: OS PD-L1: OS | |||
| Araz 2019 [26] | 38 (15/23) | 17/19/0 Sur: 2 | OS | wbSUVmax: n.s | wbSUVmean(software): n.s. wbSUVpeak: n.s. | wbMTVsoftware: OS | wbTLGsoftware: n.s. | wbSUVmax: n.s. wbSUVmean(software): n.s. wbSUVpeak: n.s. wbMTVsoftware: OS wbTLG: n.s. | Age: n.s. LDH: n.s. Sex: n.s. |
| Chang 2019 [27] | 30 (30/0) | 30/0/0 | PFS OS | tSUVmax: n.s. | tSUVmax(glu): PFS + OS | tMTV2.5: OS | tTLG2.5. OS | tSUVmax(glu): PFS tMTV2.5: OS tTLG: n.s. | None |
| Fu 2018 [28] | 129 (129/0) | 129/0/0 | PFS OS | wbMTV3.0: PFS + OS | wbMTV3.0: PFS + OS | Age: n.s. Sex: n.s. PS: n.s. Cht regimen: n.s. CTC: PFS + OS | |||
| Jin 2018 [16] | 46 (46/0) | 46/0/0 | OS PFS | tSUVmax: n.s. nSUVmax: n.s. | tSUVmean2.5: n.s. nSUVmean2.5: n.s. | tMTV2.5: n.s. nMTV2.5: PFS + OS tnMTV2.5: PFS + OS | tTLG2.5: n.s. nTLG2.5: PFS + OS tnTLG2.5: PFS + OS | nMTV2.5: PFS + OS tnMTV2.5: n.s. nTLG2.5: PFS + OS tnTLG2.5: n.s. | PS: PFS + OS N1 station involvement: n.s. Subcarinal LN metastases: PFS + OS |
| Kim H 2018 [29] | 59 (27/32) | 22/37/0 | OS PFS | tSUVmax: n.s. | tSUVpeak: n.s. | tnMTV2.5: PFS | tnTLG2.5: PFS | tnMTV2.5: n.s. tnTLG2.5: n.s. | Stage: PFS LDH: n.s. RECIST: PFS |
| Aktan 2017 [20] | 46 (46/0) | 46/0/0 | OS PFS | tSUVmax: OS nSUVmax: OS | tSUVmax: n.s. nSUVmax: OS | Age: OS | |||
| Yilmaz Demirci 2017 [30] | 142 (60/82) | 38/104/0 | OS | tSUVmax: n.s. | tSUVmax: n.s. | Stage: n.s. Age: n.s. LDH: OS PS: OS Albumin: OS Calcium: n.s. Thoracic RT: OS PCI: n.s. | |||
| Dinc 2016 [31] | 90 (33/57) | 33/57 | OS PFS | tSUVmax: n.s. | none | Stage: PFS OR: PFS + OS | |||
| Kwon 2016 [21] | 59 (59/0) | 41/14/5 Cht + sur: 4 | OS PFS | wbSUVmax: PFS + OS | wbMTV2.5: PFS + OS | wbTLG2.5: OS + PFS | wbSUVmax: OS wbMTV2.5: PFS wbTLG2.5: n.s. | Stage: NA 1 Age: NA 1 LDH: NA 1 PS: NA 1 ChT (yes vs. no): NA 1 | |
| Nobashi 2016 [32] | 28 (14/14) central SCLC | 14/14 | OS PFS | tSUVmax: n.s. wbSUVmax: n.s. | wbMTV40: PFS + OS | wbTLG40: PFS + OS | tSUVmax: n.s. wbSUVmax: n.s. wbMTV40: n.s. wbTLG40: n.s. | Stage: PFS + OS NSE: n.s. | |
| 41 (24/17) peripheral SCLC | 13/28 | OS PFS | tSUVmax: n.s. wbSUVmax: n.s. | wbMTV40: PFS + OS | wbTLG40: PFS + OS | tSUVmax: n.s. wbSUVmax: n.s. wbMTV40: PFS + OS wbTLG40: PFS + OS | Stage: OS 2 NSE: n.s. | ||
| Zer 2016 [33] | 55 (24/31) | 24/31/0 | OS PFS | none 3 | none 3 | none 3 | tSUVmax: n.s. nSUVmax: n.s. tMTV42: n.s. tnMTV42: PFS tTLG42: n.s. tnTLG42: OS | Stage: n.s. | |
| Ong 2016 [34] | 120 (120/0) | 120/0/0 | OS DFS LRF DF | tSUVmax: n.s. | tSUVmean42: n.s. | tMTV42: DF | tTLG42: n.s. | tMTV42: n.s. | Stage: DFS + DF Age: DF PS: n.s. |
| Kim SJ 2015 [15] | 82 (31/51) 4 | 31/51 | OS PFS | tSUVmax: n.s. LD: tSUVmax: n.s. ED: tSUVmax: n.s. | none | Stage: OS Age: n.s. LDH: OS Sex: n.s. PS: OS | |||
| Park 2014 [35] | 202 (95/107) | 85/117 | OS | thoracicSUVmax: n.s. | thoracicSUVmean(software): n.s. | thoracicMTVsoftware: OS LD:thoracic MTVsoftware: OS ED: thoracic MTVsoftware: n.s. | ThoracicTLGsoftware: OS LD: thoracic TLGsoftware: OS ED: thoracic TLGsoftware: n.s. | thoracicMTVsoftware: OS thoracicTLGsoftware: OS | Stage: OS Age: OS |
| Kim MH 2014 [14] | 114 (26/88) 4 | CCRT or Cht: 114 | OS PFS | tSUVmax: n.s. | Wb-meanSUVmax: n.s. | wb-sumSUVmax: OS + PFS LD: wb-sumSUVmax: PFS ED: wb-sumSUVmax: OS + PFS | wb-sumSUVmax: PFS + OS | Stage: n.s. Age: OS LDH: n.s. Sex: PFS Cht (no. of cycles): PFS + OS OR: PFS + OS NSE: n.s. CYFRA21-1: n.s. | |
| Lee J 2014 [36] | 41 (41/0) | 41/0/0 | OS PFS | tSUVmax(liver): OS | tSUVmax(liver): OS | LDH: PFS + OS Sex: OS OR: OS | |||
| Go 2014 [37] | 145 (61/84) | 44/101 | OS PFS | wbSUVmax: n.s. | Wb-meanSUVmax: n.s. | wb-sumSUVmax 5: PFS + OS | wb-sumSUVmax 5: PFS + OS | Stage: PFS Sex: PFS OR: PFS No. of lesions: PFS | |
| Inal 2013 [38] | 54 (24/30) | 24/30 | OS | tSUVmax: n.s. | none | Stage: OS PS: OS DM: n.s. | |||
| Gomez 2014 [17] | 50 (50/0) | 50/0/0 | OS | tSUVmax: n.s. nSUVmax: n.s. | tn-meanSUVmax: n.s. | ||||
| Oh 2013 [13] | 91 (0/91) 6 | 26/65 | OS PFS | wbSUVmax: n.s. thoracicSUVmax: n.s. extrathoracicSUVmax: n.s. | wbMTV3.0: OS + PFS thoracicMTV3.0: n.s. extrathoracicMTV3.0: PFS + OS | wbMTV3.0: n.s. extrathoracic MTV3.0: PFS | Age: n.s. PS: OS Cht (no. of cycles): PFS + OS RT: n.s. PCI: n.s. Bone mets: n.s. Liver mets: n.s. No. of extrathoracic foci: OS | ||
| Jhun 2013 [39] | 246 (NA) 7 | NA 7 | OS | tSUVmax: n.s. | none | Stage: OS Age: OS LDH: OS PS: OS Albumin: n.s. | |||
| Oh 2012 [12] | 106 (45/61) 6 | 45/61/0 | PFS OS | wbSUVmax: n.s. | wbMTV3.0: PFS + OS LD: wbMTV3.0: PFS + OS ED: wbMTV3.0: PFS + OS | wbSUVmax: n.s. wbMTV3.0: PFS + OS | Stage: OS + PFS LDH: n.s. PS: n.s. Cht (no. of lines): n.s. | ||
| Van der Leest 2012 [22] | 75 (35/40) | 26/28/0 sur: 4 None: 13 NA: 4 | OS PFS | tSUVmax: n.s. LD: tSUVmax: n.s. ED: tSUVmax: OS + PFS | |||||
| Zhu 2011 [23] | 98 (41/57) | 57/41 | OS PFS | tSUVmax: PFS + OS | wb-meanSUVmean2.5: PFS + OS | wbMTV2.5: PFS + OS LD: wbMTV2.5: PFS + OS ED: wbMTV2.5: PFS + OS | wbTLG2.5: PFS +OS LD: wbTLG2.5: PFS +OS ED: wbTLG2.5: PFS +OS | tSUVmax: n.s. wb-meanSUVmean2.5: n.s. wbMTV2.5: PFS + OS wbTLG2.5: PFS + OS | Stage: OS + PFS LDH: OS + PFS |
| Lee YJ 2009 [40] | 76 (41/35) | 41/35 | OS PFS | tSUVmax: NA 3 wbSUVmax: NA 3 | wb-meanSUVmax 8: OS + PFS | wb-meanSUVmax 8: PFS + OS tSUVmax: n.s. 9 wbSUVmax: n.s. 9 | Stage: OS + PFS LDH: PFS PS: OS | ||
| Chong 2007 [24] | 15 (9/6) | NA | OS | wbSUVmax: OS 10 | |||||
| Pandit 2003 [41] | 8 (4/4) | NA | OS | wbSUVmax: n.s. | PET-positive: n.s. | ||||
| Study | Patients | Univariate Analysis | Multivariate Analysis | ||||||
|---|---|---|---|---|---|---|---|---|---|
| N (LD/ED) | Therapy CCRT/Cht/RT | Timing of PET (Interval from End of Treatment) | Endpoints | SUVmax | Other Uptake Values | MTV and TLG | PET Parameters | Other Covariates | |
| Quartuccio 2019 [42] | 164 (NA/NA) | 62/89/13 | <3 months | PFS OS | tSUVmax: n.s. nSUVmax: n.s. mSUVmax: n.s. | tSUVmean40: n.s. nSUVmean40: n.s. mSUVmean40: n.s. tPET-positive: n.s. nPET-positive: n.s. mPET-positive: PFS + OS | tMTV40: n.s. nMTV40: n.s. mMTV40: n.s. tTLG40: n.s. nTLG40: n.s. mTLG40: n.s. | NA | NA |
| Kim H 2018 [29] | 59 (27/32) | 22/37/0 | 0.5–2.7 months | OS PFS | tSUVmax: OS + PFS | tSUVpeak: OS + PFS | tnMTV2.5: PFS + OS tnTLG2.5: OS + PFS | tSUVpeak: n.s. tnMTV2.5: PFS | Stage: PFS LDH: n.s. RECIST: PFS |
| Lee J 2014 [36] | 41 (41/0) | 41/0/0 | 3 weeks | OS PFS | tSUVmax(liver) 1: n.s. | none | Sex: OS LDH: PFS + OS OR: OS | ||
| Ziai 2013 [43] | 29 (13/16) | 21/8/0 | 4.3–7.5 months (from baseline PET) | PFS OS | 2 SUVmax: PFS + OS | Wb-sumSULpeak 3: PFS + OS wbPET-positive 4: PFS + OS | 2 SUVmax: n.s. Sum-wbSULpeak 3: OS wbPET-positive 4: PFS + OS | Presence of mets: n.s. | |
| Onitilo 2008 [44] | 22 (22/0) | 17/5/0 | <4 months | PFS OS | wbPET-positive (<2.5 and visually corrected): PFS | NA | NA | ||
| Blum 2004 [45] | 25 (NA/NA) | NA | NA 5 | TTP | wbPET-positive: longer median TTP (no statistical analysis) | NA | NA | ||
| Pandit 2003 [41] | 38 (24/13) NA:1 | 23/14/1 | 4 days–48 months (54 PETs included) | OS | wbSUVmax: OS | wbSUVmean 6: n.s. wbPET-positive: OS | NA | NA | |
| Study | Patients | Univariate Analysis | Multivariate Analysis | |||||
|---|---|---|---|---|---|---|---|---|
| N (LD/ED) | Therapy: CCRT/Cht | Timing of Response Evaluation | Endpoints | ΔSUV | ΔMTV and ΔTLG | PET Parameters | Other Covariates | |
| Kim H 2018 [29] | 59 (27/32) | 22/37 | Final response: 0.5–2.7 months after therapy | OS PFS | ΔtSUVmax: OS + PFS ΔtSUVpeak: OS + PFS | ΔtnMTV2.5: PFS ΔtnTLG2.5: n.s. | ΔtSUVpeak: OS | Stage: PFS LDH: n.s. RECIST: PFS |
| Lee J 2014 [36] | 41 (41/0) | 41/0 | Final response: 3 weeks after end of CCRT | OS PFS | ΔtSUVmax(liver) 1: n.s Δtn-meanSUVmax(liver) 1: OS + PFS | ΔtSUVmax(liver) 1: n.s Δtn-meanSUVmax(liver) 1: PFS 2 | Sex: OS LDH: PFS + OS OR: OS | |
| Ziai 2013 [43] | 29 (13/16) | 21/8 | Final response: 4.3–7.5 month from baseline-PET | PFS OS | ΔtSULpeak 3: PFS | None | Presence of mets: PFS | |
| V Loon 2011 [46] | 15 (15/0) | 15/0 | Early response: after 1 cycle Cht | OS | ΔtnMTV40: OS ΔtnMTV50: OS | NA | NA | |
| Study | Patients | Univariate Analysis | Multivariate Analysis | ||||||
|---|---|---|---|---|---|---|---|---|---|
| N (LD/ED) | Therapy CCRT/Cht | Timing of PET | Endpoints | SUV | MTV | TLG | PET Parameters | Other Covariates | |
| Mirili 2019 [47] | 54 (16/36) | 19/26 No therapy: 9 | Baseline or after therapy (not further specified) | OS PFS | tSUVmax: OS tSUVmean40: n.s. | tMTV40: PFS + OS wbMTV40: PFS + OS | tTLG40 n.s. wbTLG40: PFS + OS | wbTLG40: n.s. | Age: OS Stage: OS Sex: n.s. NLR: OS |
| Reymen 2013 [48] | 119 (119/0) | 119/0 | Baseline/during therapy 1 | OS | GTV: OS | GTV: OS | PS: OS Stage: n.s. Age: n.s. Sex: n.s. LDH: n.s. N-status: n.s. SER: n.s. | ||
| Arslan 2011 [49] | 25 (10/15) | NA | Baseline (12) or restaging/response evaluation (13) | OS | wbSUVmax: n.s. wbSUVmean2.5: n.s. | wbMTV2.5: n.s. wbMTV50: n.s. | wbTLG2.5: n.s. wbTLG50:OS | wbSUVmax: n.s. wbSUVmean2.5: n.s. wbMTV2.5: n.s. wbMTV50: n.s. wbTLG2.5: n.s. wbTLG50: OS | Baseline vs. restaging: n.s. |
Publisher’s Note: MDPI stays neutral with regard to jurisdictional claims in published maps and institutional affiliations. |
© 2021 by the authors. Licensee MDPI, Basel, Switzerland. This article is an open access article distributed under the terms and conditions of the Creative Commons Attribution (CC BY) license (http://creativecommons.org/licenses/by/4.0/).
Share and Cite
Christensen, T.N.; Andersen, P.K.; Langer, S.W.; Fischer, B.M.B. Prognostic Value of 18F–FDG–PET Parameters in Patients with Small Cell Lung Cancer: A Meta-Analysis and Review of Current Literature. Diagnostics 2021, 11, 174. https://doi.org/10.3390/diagnostics11020174
Christensen TN, Andersen PK, Langer SW, Fischer BMB. Prognostic Value of 18F–FDG–PET Parameters in Patients with Small Cell Lung Cancer: A Meta-Analysis and Review of Current Literature. Diagnostics. 2021; 11(2):174. https://doi.org/10.3390/diagnostics11020174
Chicago/Turabian StyleChristensen, Tine Nøhr, Per Kragh Andersen, Seppo W. Langer, and Barbara Malene Bjerregaard Fischer. 2021. "Prognostic Value of 18F–FDG–PET Parameters in Patients with Small Cell Lung Cancer: A Meta-Analysis and Review of Current Literature" Diagnostics 11, no. 2: 174. https://doi.org/10.3390/diagnostics11020174