Article

Integration of Transcriptome and Exome Genotyping Identifies Significant Variants with Autism Spectrum Disorder

1
Department of Clinical Pharmacy Research, Institute for Research and Medical Consultations (IRMC), Imam Abdulrahman Bin Faisal University, Dammam 31441, Saudi Arabia
2
Department of Neurology, College of Medicine, Imam Abdulrahman Bin Faisal University, Dammam 31441, Saudi Arabia
3
Department of Genetic Research, Institute for Research and Medical Consultations (IRMC), Imam Abdulrahman Bin Faisal University, Dammam 31441, Saudi Arabia
4
Environmental Health Research Area, Institute for Research and Medical Consultations (IRMC), Imam Abdulrahman Bin Faisal University, Dammam 31441, Saudi Arabia
5
Department of Mental Health, College of Medicine, Imam Abdulrahman Bin Faisal University, Dammam 31441, Saudi Arabia
6
King Fahad Hospital of the University, Imam Abdulrahman Bin Faisal University, Dammam 34212, Saudi Arabia
*
Author to whom correspondence should be addressed.
Pharmaceuticals 2022, 15(2), 158; https://doi.org/10.3390/ph15020158
Submission received: 6 December 2021 / Revised: 16 January 2022 / Accepted: 25 January 2022 / Published: 27 January 2022

Abstract

:
Autism is a complex disease with genetic predisposition factors. Real factors for treatment and early diagnosis are yet to be defined. This study integrated transcriptome and exome genotyping for identifying functional variants associated with autism spectrum disorder and their impact on gene expression to find significant variations. More than 1800 patients were screened, and 70 (47 male/23 female) with an average age of 7.56 ± 3.68 years fulfilled the DSM-5 criteria for autism. Analysis revealed 682 SNPs of 589 genes significantly (p < 0.001) associated with autism among the putative functional exonic variants (n = 243,345) studied. Olfactory receptor genes on chromosome 6 were significant after Bonferroni correction (α = 0.05/243345 = 2.05 × 10⁻⁷) with a high degree of linkage disequilibrium on 6p22.1 (p = 6.71 × 10⁻⁹). The differentially expressed gene analysis of autistic patients compared to controls in whole RNA sequencing identified significantly upregulated (foldchange ≥0.8 and p-value ≤ 0.05; n = 125) and downregulated (foldchange ≤−0.8 and p-value ≤ 0.05; n = 117) genes. The integration of significantly up- and downregulated genes and genes of significant SNPs identified regulatory variants (rs6657480, rs3130780, and rs1940475) associated with the up- (ITGB3BP) and downregulation (DDR1 and MMP8) of genes in autism spectrum disorder in people of Arab ancestries. The significant variants could be a biomarker of interest for identifying early autism among Arabs and helping to characterize the genes involved in the susceptibility mechanisms for autistic subjects.

1. Introduction

Autism spectrum disorder (ASD) is a complex neurodevelopmental disorder that exhibits a wide range of symptoms of varying severity and has a high prevalence in the Gulf region [1]. Recent research suggests that gene variants, altered biological mechanisms, and the environment together influence the development of autism [2]. The most common symptoms of autism are impaired social skills, difficulty with communication, and repetitive movements. Autism can be detected at the age of 3 years, and perhaps as early as 18 months [3]. ASD heritability has been estimated to be 40–90%, and a number of common variants contribute to the significant variability in the condition, in addition to epigenetic, environmental, and hormonal factors [4,5,6]. Moreover, the Diagnostic and Statistical Manual of Mental Disorders—Fifth Edition includes atypical sensory processing, which has been reported in more than 70% of patients with ASD as a diagnostic criterion (DSM-5; American Psychiatric Association, 2013) [7,8,9].
Genes differentially expressed in autism are important for understanding the associated pathways [10,11,12]. This meta-analysis looked at ten Gene Expression Omnibus datasets, which included 364 cases and 248 controls. It discovered 3105 genes that were consistently expressed differently in autism (1680 downregulated genes and 1425 upregulated genes). PNPLA2, LYPLA2, LYPLA2P1, PLA2G4D, PLA2G6, PLA2G7, and PLA2G5 were also discovered to be related to phospholipase A2 (PLA2). The enriched gene ontology terms for molecular functions were involved in structural constituents of ribosomes and transcription regulator activity, while the enriched gene ontology terms for biological processes were involved in translational elongation and the response to cytokine stimuli, according to the study. The ribosome route was the most important pathway in our KEGG study. The meta-analysis discovered genes that were consistently differentially expressed in autism, as well as biological pathways linked to gene expression alterations [10]. Topological analysis of the autistic brain identified proteomic hub gene signatures: CDK2, BAG3, MYC, TP53, HDAC1, CDKN1A, EZH2, GABARAPL1, TRAF1, and VIM [11]. The study also revealed the transcriptional regulating factors, such as YY1, FOXL1, USF2, FOXC1, GATA2, NFIC, E2F1, NFKB1, TFAP2A, and HINFP [11].
Despite rapid developments in genetic techniques, for diagnostic purposes, common variants of neuropsychiatric disorders are still lacking. An exome microarray provides a potential diagnostic method for many complex genetic diseases such as ASD. Unlike other genetic techniques, the exome microarray is effective for profiling variants in associated genes with >5% allele frequency [13]. In addition, it provides exceptional coverage of the whole exonic region delivered from over 12,000 individual exome sequences [14]. The present study conducted whole RNA sequencing and exome microarray analysis to identify the most prominent variants associated with autism in patients in Saudi Arabia.

2. Results

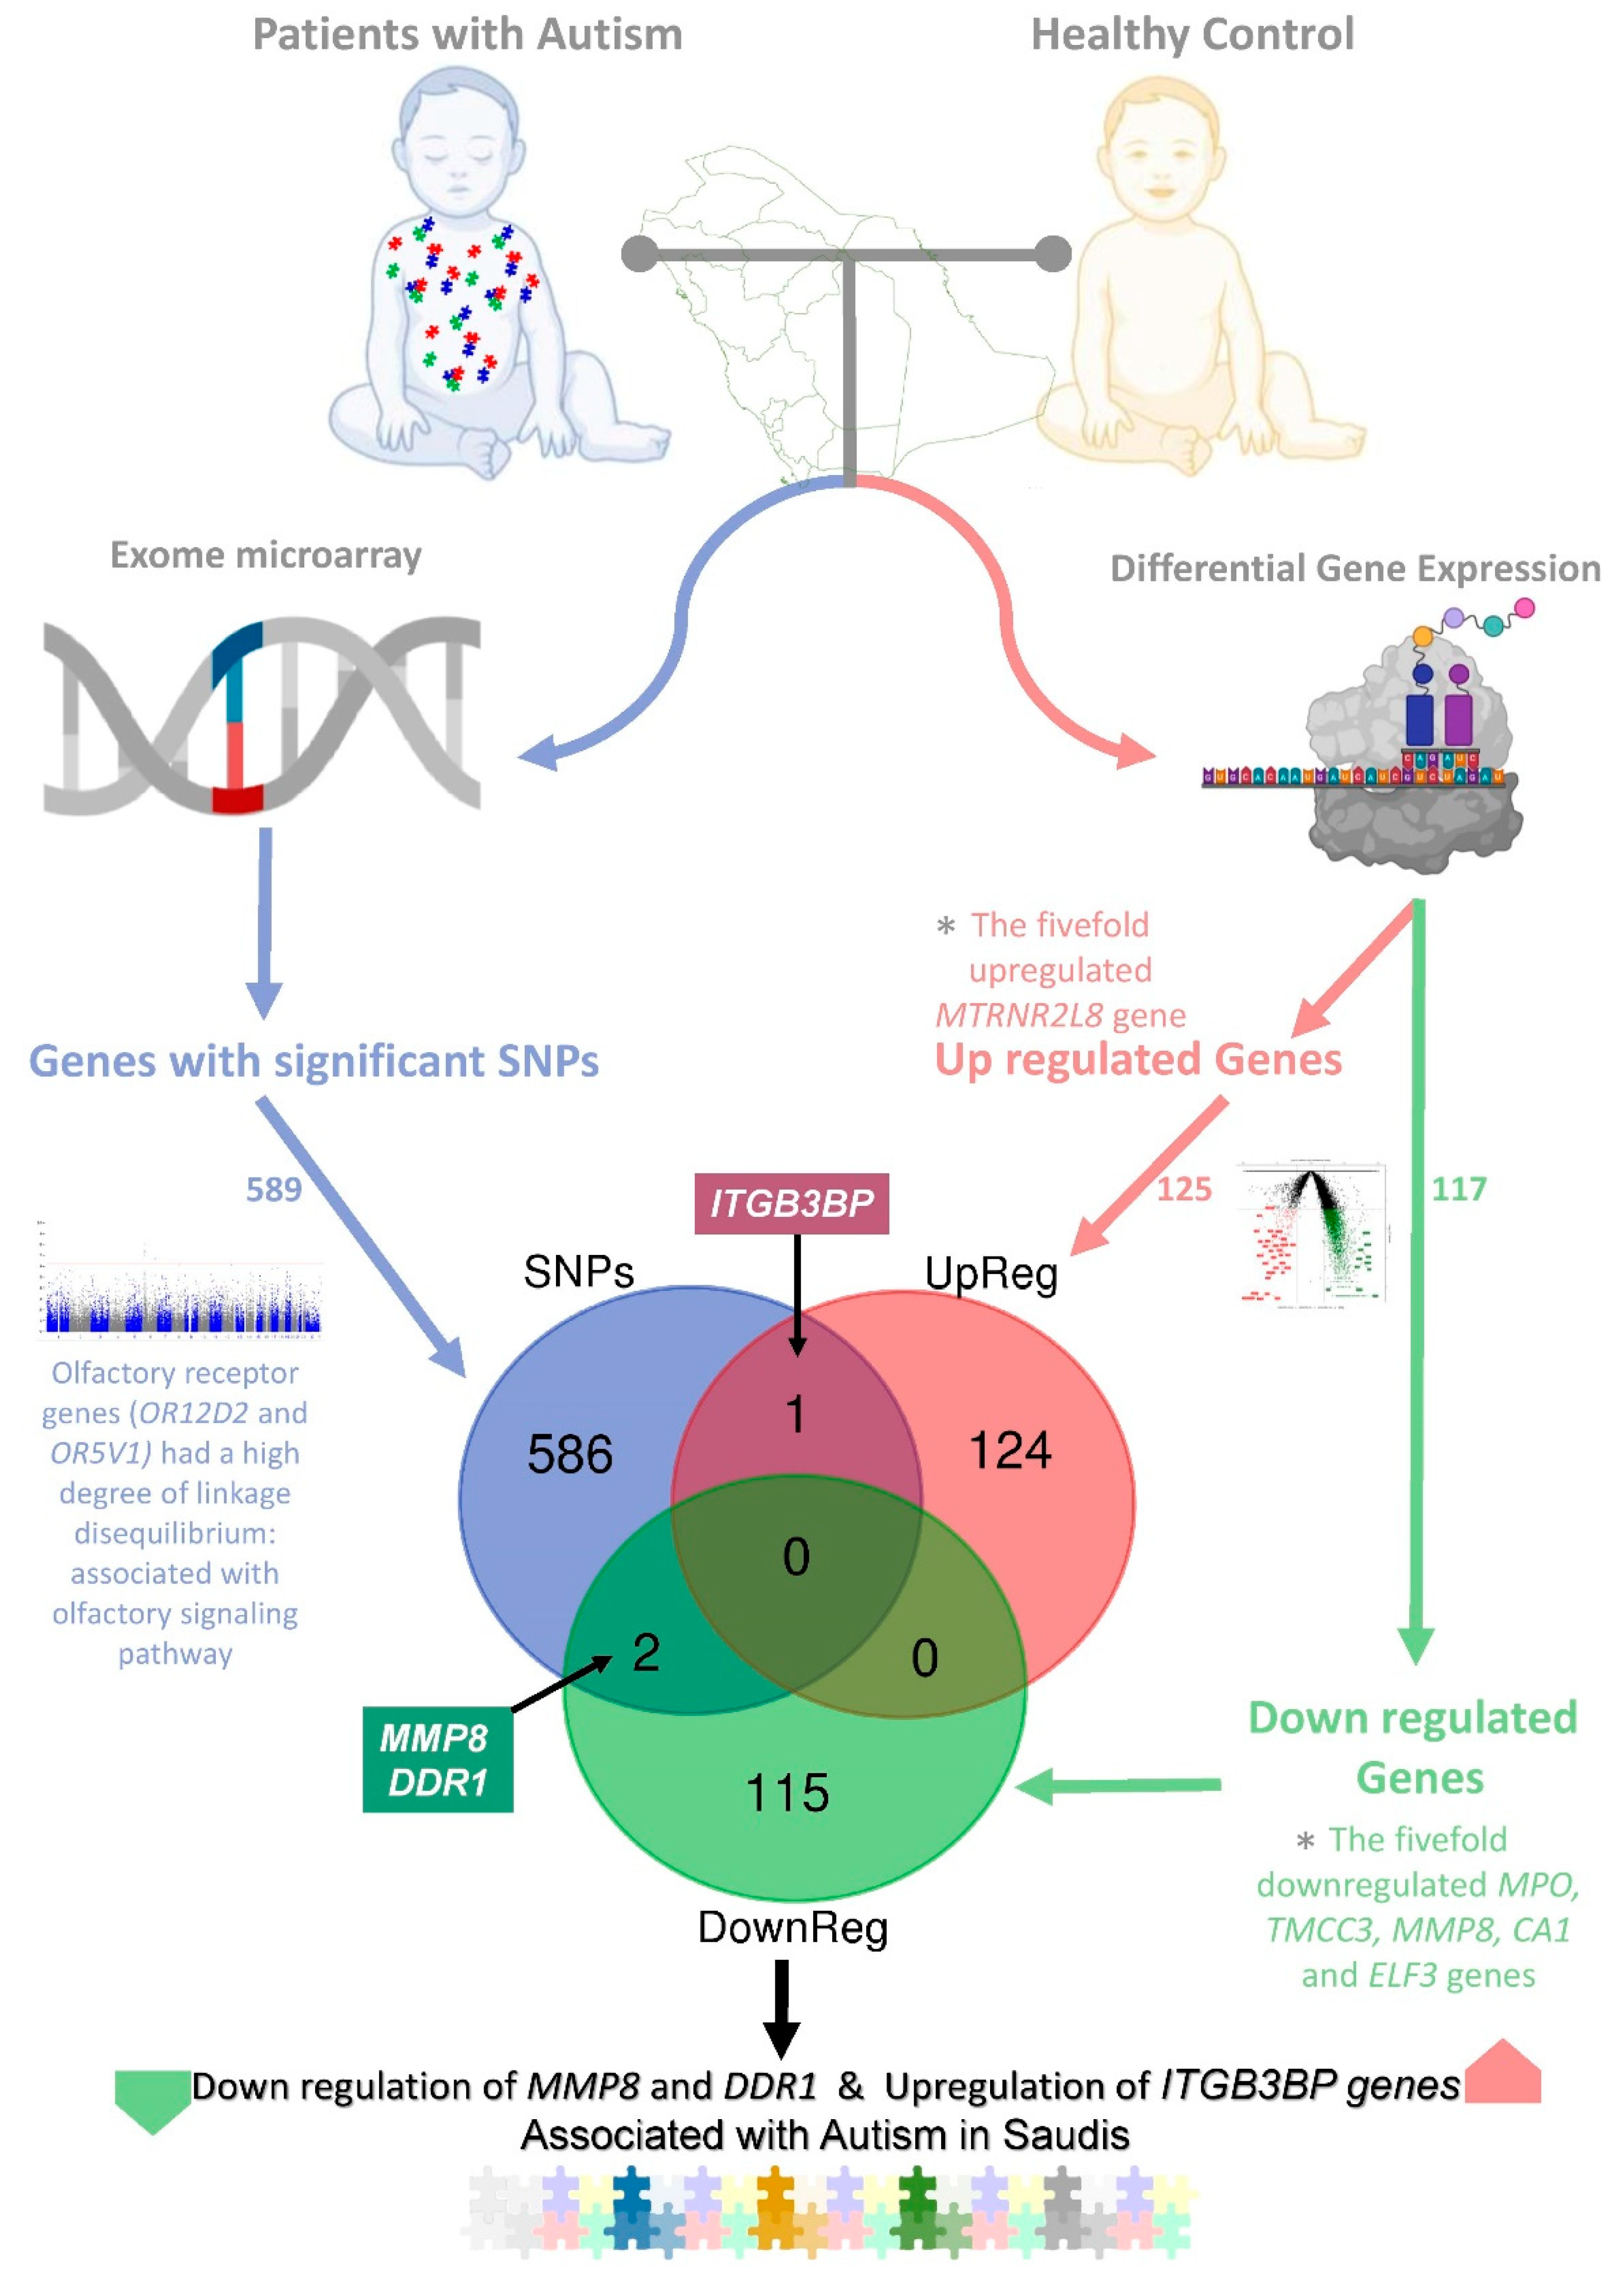
The study revealed the significant regulatory variants associated with the development of autism in people with Arab ancestries using multiomic analysis (Figure 1).
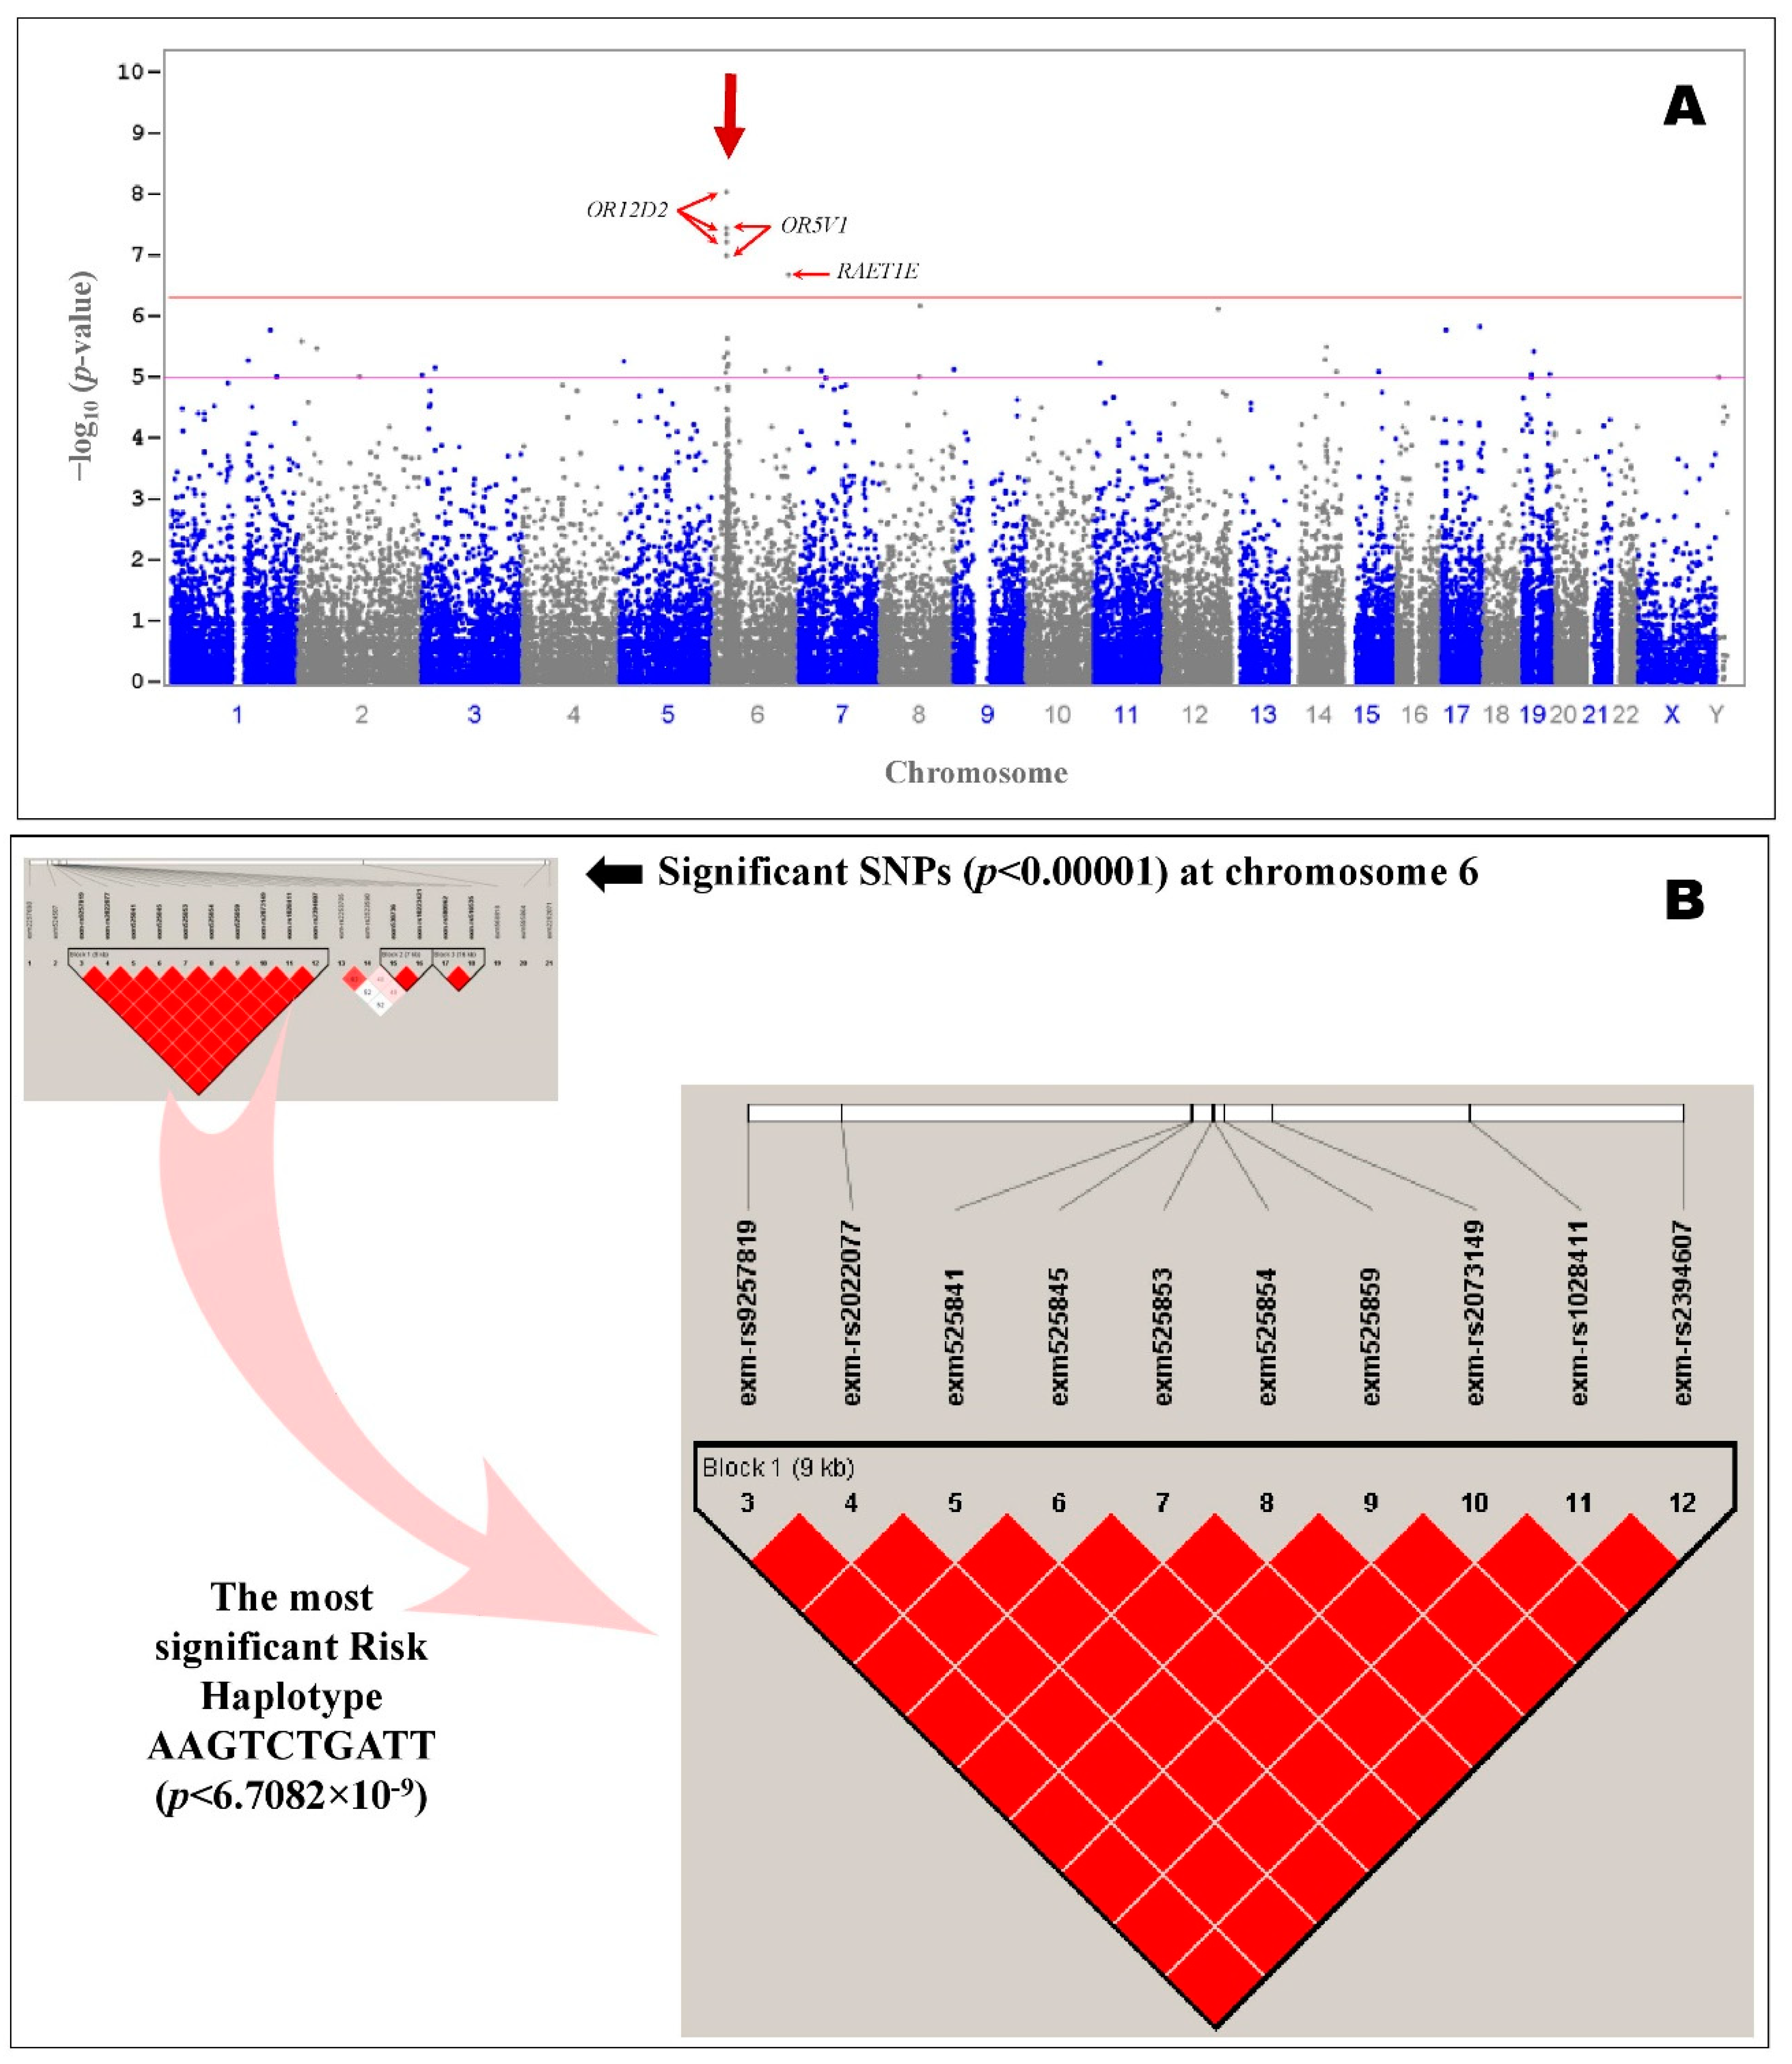
A total of 13 SNPs were significantly (p < 2.05 × 10⁻⁷) associated with ASD even after Bonferroni or false discovery rate corrections (corrected α = 0.05/243,345 = 2.05 × 10⁻⁷) among the 243,345 SNPs screened, and they obeyed the HWE. Table 1 summarizes the most significant SNPs that were associated with autism in patients of Arab ancestry. Common variants in olfactory receptor family 12 subfamily D member 2 (OR12D2) and olfactory receptor family 5 subfamily V member 1 (OR5V1) showed the strongest signal in Arab patients with autism. The top 10 most significantly (p < 2.05 × 10⁻⁷) associated SNPs were in the region of the olfactory receptor genes OR12D2 and OR5V1 on chromosome 6p22.1 (Figure 2). Additional information about the significant SNPs (p < 0.0001) in autism patients is provided in Table S1. The results suggest that a single gene, OR12D2 (including up and downstream; NC_000006.11:g.29360183–g.29369519), has 10 common SNPs with large effects on risk (rs9257819, rs2022077, rs9257834, rs4987411, rs2073154, rs2073153, rs2073151, rs2073149, rs1028411, and rs2394607), including five SNPs in the coding region (rs9257834, rs4987411, rs2073154, rs2073153, and rs2073151).
All the association tests were screened using the frequency of minor alleles in controls, the p-value of the HWE, and the type I error rate to identify the strongest genetic findings, which were input for linkage disequilibrium in HapMap SNPs of selected regions on chromosome 6 (Figure 2). The variants in the region of the olfactory receptor genes OR12D2 and OR5V1 had a high degree of linkage disequilibrium (p = 6.71 × 10⁻⁹) (Figure 2). The haplotype associated with the most significant risk in patients of Arab ancestry with autism, AAGTCTGATT (p = 6.7082 × 10⁻⁹), consisted of the top 10 SNPs (rs9257819A, rs2022077A, rs9257834G, rs4987411T, rs2073154C, rs2073153T, rs2073151G, rs2073149A, rs1028411T, and rs2394607T) (Table 2). The protective haplotype most significantly associated with the control subjects of Arab ancestry, CTTCGGATGC (p = 2.43 × 10⁻⁸), also consisted of the top 10 SNPs (rs9257819C, rs2022077T, rs9257834T, rs4987411C, rs2073154G, rs2073153G, rs2073151A, rs2073149T, rs1028411G, and rs2394607C) with the alleles that were not associated with autism (Table 2).

2.1. RNA Sequencing and Differentially Expressed Genes

Blood samples were collected in the RNA protectant vacutainer with an RNA stabilizer to obtain more accurate results. Total RNA was isolated for the transcriptome profiling study using paired-end sequencing. Raw reads were checked for a quality Phred score ≥ 30. The qualifying reads were processed for mapping on the reference genome and expression profile preparation. The raw RNA sequencing data reads were trimmed for the adaptors and mapped by using the tophat RNA Sequence mapping tool with the reference RNA sequence. All RNA sequence data were subjected to complete differential expression analysis between the autistic and the control subjects. The differential expression between the autistic and control subjects was calculated, revealing upregulated (foldchange ≥ 0.8 and p-value ≤ 0.05) and downregulated (foldchange ≤ −0.8 and p-value ≤ 0.05) genes. Autistic patients and healthy controls were considered two distinct groups for differential expression calculation using Cuffdiff [15]. Genes were filtered for differential expression through all significant DEGs based on a p-value ≤ 0.05. For upregulated genes, we used a cutoff p-value ≤ 0.05 and foldchange ≥ 0.8, and for downregulated genes, we used a cutoff p-value ≤ 0.05 and foldchange ≤ −0.8. All the expressed genes from the autistic and control samples with a quality Phred score ≥ 30 were subjected to differential expressed gene analysis, and the results are presented in Figure 3 as volcano plots. The significantly upregulated and downregulated genes were considered with foldchange ≥ 0.8 and p-value ≤ 0.05 and foldchange ≤−0.8 and p-value ≤ 0.05, respectively.
A list of the top 20 upregulated genes with foldchange ≥ 1.98, a p-value ≤ 0.0025 and a q-value ≤ 0.05 is presented in Table 3. A list of the top 20 downregulated genes with foldchange ≤ −3.5, a p-value ≤ 0.00005, and a q-value ≤ 0.0044 is presented in Table 4. The results indicate that the fivefold downregulated genes (foldchange ≤ −5, p-value ≤ 0.00005 and q-value ≤ 0.0044) such as MPO, TMCC3, MMP8, CA1, and ELF3 can be notable downregulation biomarkers. Similarly, a fivefold upregulated gene, MTRNR2L8 (foldchange ≥ 1.98, p-value ≤ 0.00005 and q-value ≤ 0.004), is a considerable upregulation biomarker. The fivefold downregulated MPO, TMCC3, MMP8, CA1, and ELF3 genes and the fivefold upregulated MTRNR2L8 gene can be considered for the early identification of autistic patients among Saudis.

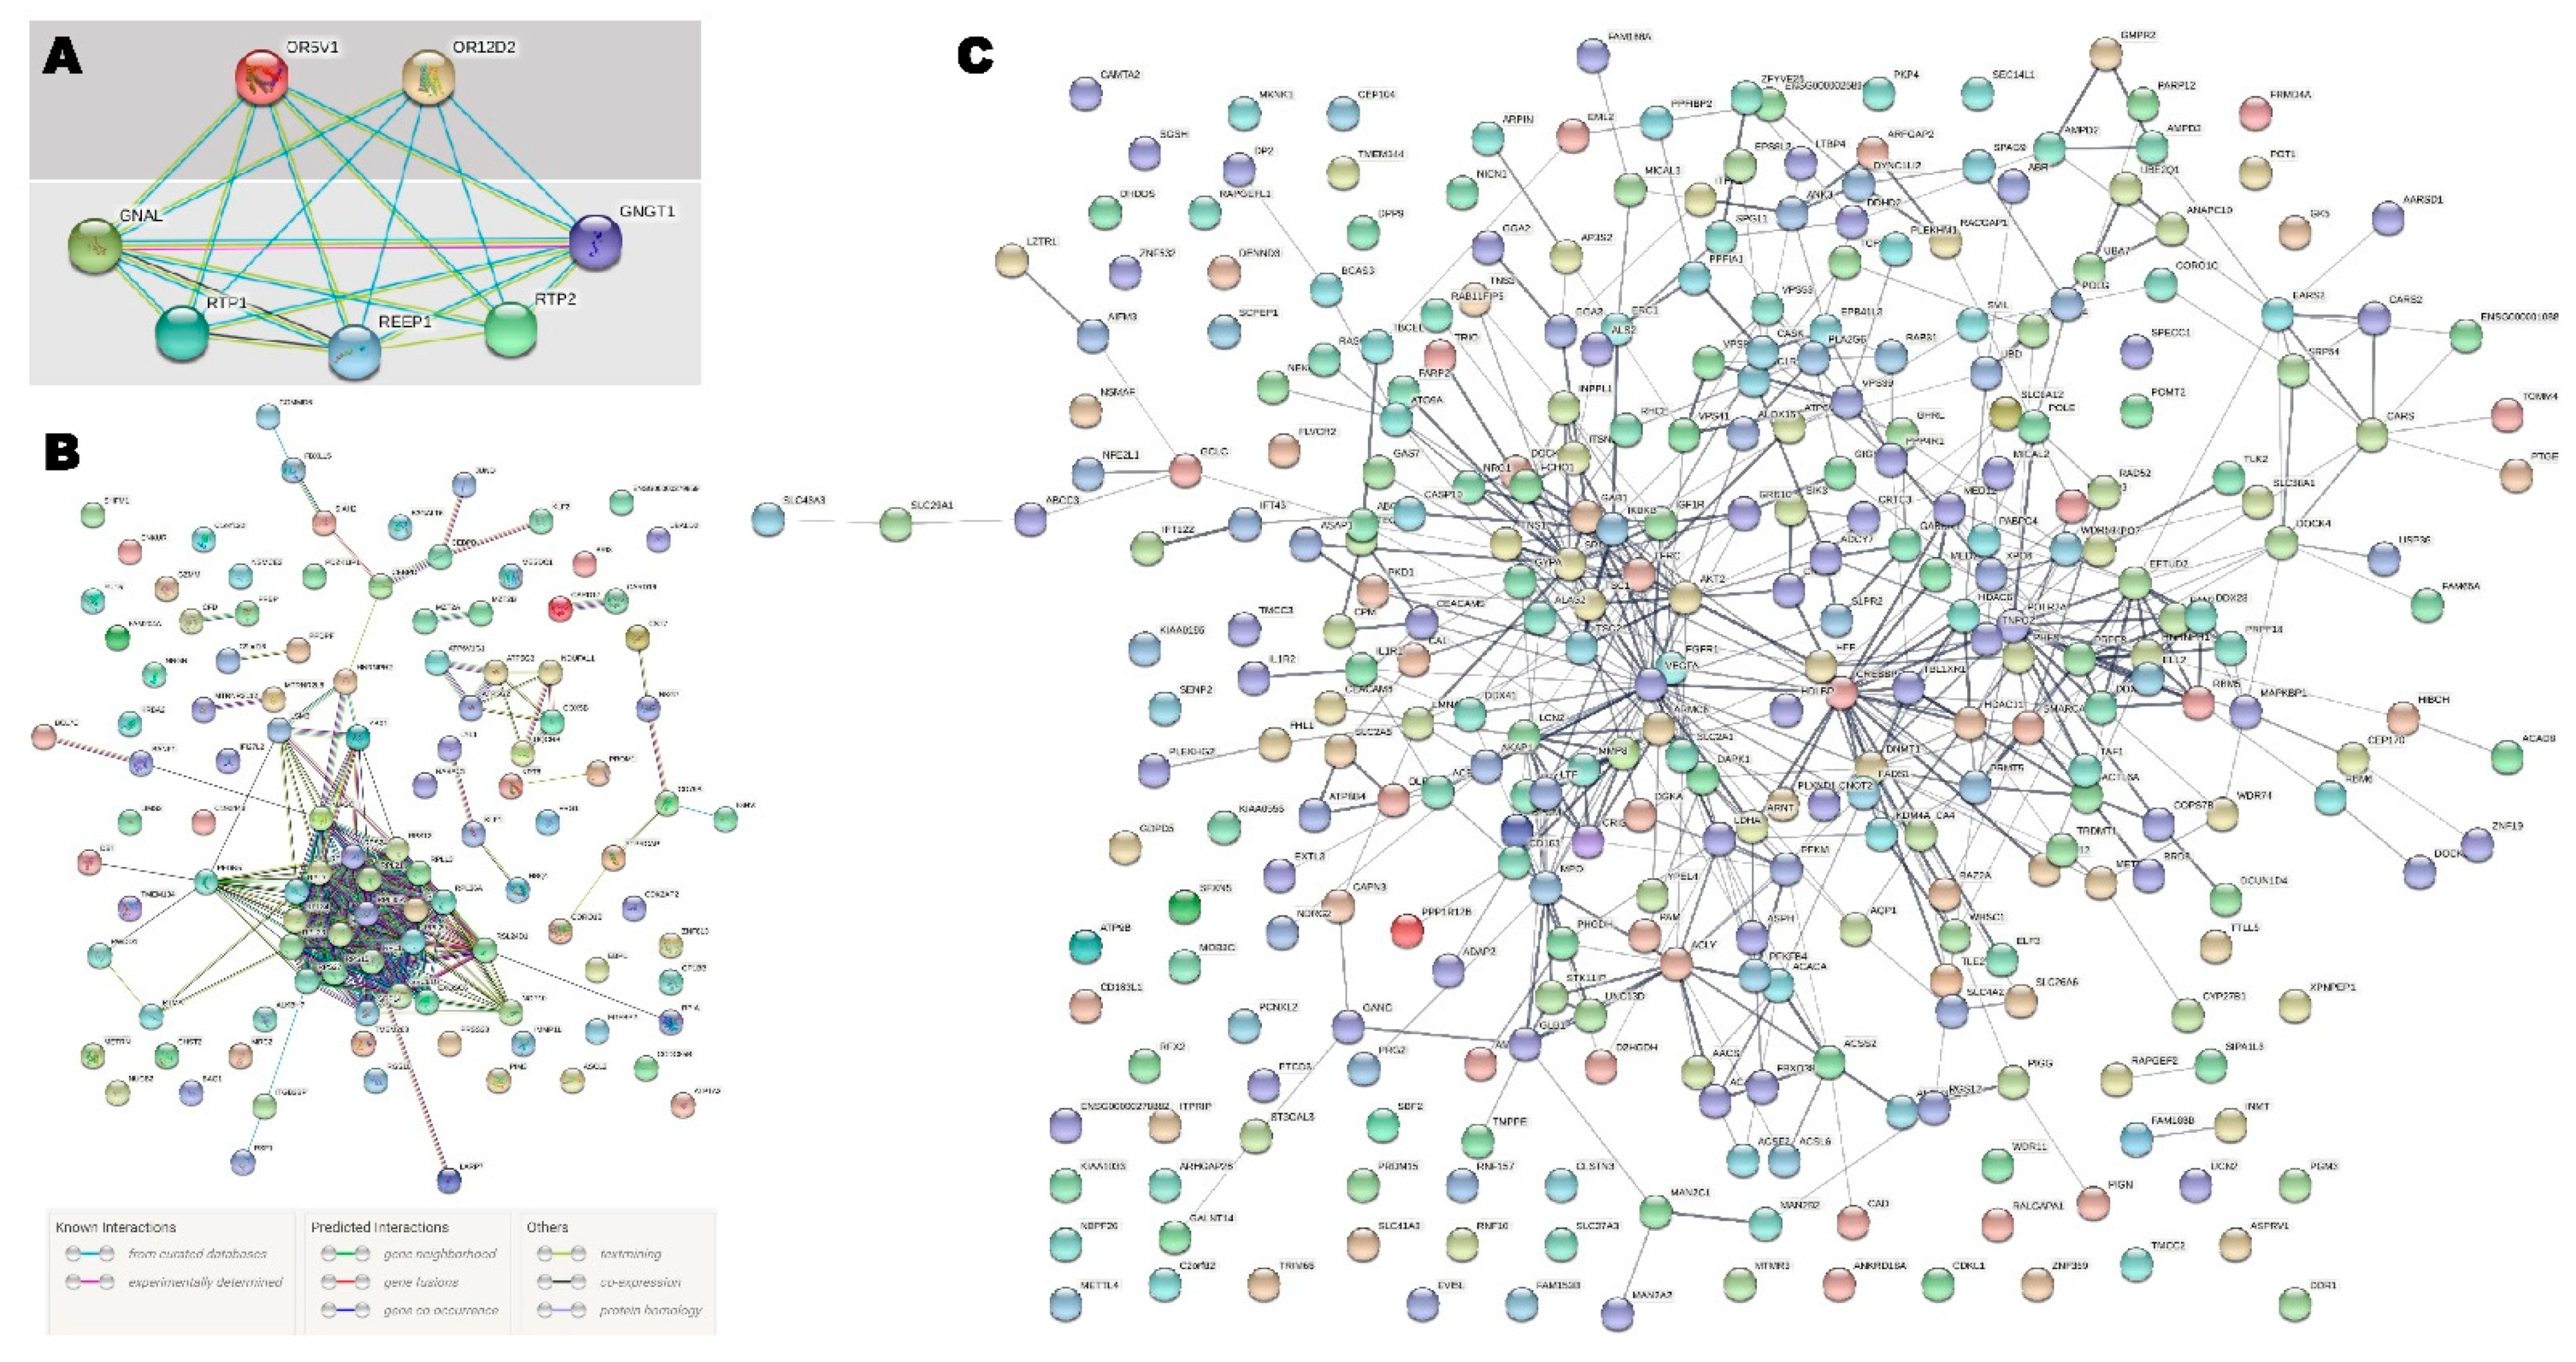
2.2. Pathway Enrichment Analysis

All the significantly upregulated and downregulated genes were searched for during the GO and pathway enrichment analysis. Significantly upregulated genes and their interactions (Figure 4) revealed highly significant protein–protein interactions based on the predictive model enrichment (p-value: <1.0 × 10⁻¹⁶). Downregulated genes (p-value < 0.001) and their interactions (Figure 4) demonstrated significant PPI enrichment with a p-value = 2.05 × 10⁻⁶. Pathway enrichment by the significantly upregulated and downregulated genes is presented in Table 5. Ribosome, oxidative phosphorylation, protein export, Parkinson’s disease, and Alzheimer’s disease-associated pathways were significantly enriched by the upregulated genes (Table 5). The impact on the genetic information processing and translation was significantly enriched by the 17 upregulated genes through the ribosome pathway. The HIF-1 signaling pathway, pyruvate metabolism, propanoate metabolism, metabolic pathways, the rap1 signaling pathway, the AMPK signaling pathway, the glucagon signaling pathway, proteoglycans in cancer, renal cell carcinoma, fatty acid biosynthesis, the insulin signaling pathway, and EGFR tyrosine kinase inhibitor resistance were significantly enriched by the downregulated genes (Table 5).

2.3. Integration of Transcriptome and Exome Genotyping

Genotyping and exome array analysis among the 243,345 putative functional exonic variants revealed 589 genes significantly (p < 0.001) associated with autism, with 682 significant variants. Furthermore, the differentially expressed gene analysis based on transcriptome sequencing for the autistic patients compared to controls identified significantly upregulated (foldchange ≥0.8 and p-value ≤ 0.05; n = 125) and downregulated (foldchange ≤−0.8 and p-value ≤ 0.05; n = 117) genes. The integration of significantly up- and downregulated genes and genes of significant SNPs using Venn diagram analysis identified three regulatory variants (rs6657480, rs3130780, and rs1940475) associated with upregulated (rs6657480, p = 0.000762, (NC_000001.10: g.63999868T > C) nearest upstream to the gene ITGB3BP) and downregulated (rs3130780, p = 3.12 × 10⁻⁵ (NC_000006.11: g.30874308T > G) nearest upstream gene, DDR1; and rs1940475, p = 0.0001807 (NC_000011.9:g.102593248T > C; NM_002424.3:c.259A > G; NP_002415.1:p.Lys87Glu, MMP8)) genes in autism spectrum disorder in patients of Arab ancestries (Figure 1).

3. Discussion

This study performed a comprehensive investigation of the genetic architecture of ASD using an exome microarray analysis and RNA sequencing. We identified 155 significantly (p < 0.0001) associated SNPs, and the most strongly (p < 2.05 × 10⁻⁷) associated 13 SNPs were investigated further. None of the 13 SNPs had previously been reported in Saudis with autism [16]. The OR12D2 olfactory receptor gene, which codes for the G-protein coupled receptor (GPCR), carries the signal to sensory neurons to trigger smell and has 10 common variants and large effects on risk, was associated with autism in Arab-ancestry subjects and showed a high degree of linkage disequilibrium (p = 6.71 × 10⁻⁹) on the significant risk haplotype AAGTCTGATT. The OR12D2 gene (gene expression for OR12D2: ENSG00000168787.4) was overexpressed in the brain (hypothalamus ×13.9, caudate ×10.7, hippocampus ×8.2, nucleus accumbens ×5.0 and cervix-endocervix ×4.6) [17,18].
Some studies have proposed unusual sensory processing, particularly olfactory processing, in a number of neurodevelopmental disorders, including autism [19,20]. Berko et al. [21] showed that the OR2L13 G-protein, joined by the olfactory receptor, which is involved in resetting the neuronal response to smells, is particularly prevalent in autism in terms of DNA methylation and expression, suggesting a possible rationale for olfactory dysfunction in ASD. The olfactory receptor genes OR12D2 and OR5V1, which are involved in the olfactory signaling pathway, G alpha (s) signaling events, GPCR downstream signaling, and GPCR signaling and signal transduction together regulate the overall olfactory growth, behavior, and impairment associated with autism (Figure 4) [22]. A functional analysis of the genes is presented in Table S2. The significant genes in this study included integrin subunit alpha 11 (ITGA11), which is associated with attention deficit hyperactivity disorder and attention deficit disorder with hyperactivity; MHC class I polypeptide-related sequence A (MICA), associated with symptoms of inflammatory bowel disease, chronic ulcerative colitis, and Crohn’s disease; bromodomain-containing 2 (BRD2), which has been linked to Alzheimer’s disease and myoclonic epilepsy; cell division cycle 14C pseudogene (CDC14C), which is associated with Parkinson’s disease and sleep; methylenetetrahydrofolate dehydrogenase (NADP+ dependent) 1-like (MTHFD1L), which is associated with stroke and Alzheimer’s disease; myosin IXB (MYO9B), associated with symptoms of celiac disease, inflammatory bowel disease, chronic ulcerative colitis, multiple sclerosis, and schizophrenia; and ring finger protein 144A (RNF144A), which has been associated with depressive disorder, schizophrenia, and stroke (Table S2) [23,24,25,26,27,28,29,30,31,32,33,34,35]. For example, SNP rs2727943 is significantly correlated with ASD and has been reported in bipolar cases as an intergenic variant that occurs between the BIG-2 and CNTN6 genes, both of which produce a neuronal membrane protein that forms the axonal connections in the developing nervous system [4].
Unlike previous results, our study identified a single gene, OR12D2 (including up and downstream; NC_000006.11:g.29360183-g.29369519), with 10 common SNPs and large effects on risk in patients with autism. Most previous results have suggested that no single gene has such large effects on risk (p = 6.71 × 10⁻⁹) [4]. A comprehensive review on the genetics of ASD described the role of various genes and their clinical relevance to autism. Here, we describe an additional gene, OR12D2, that should be considered for molecular pathway studies in the future [4]. The enrichment analysis of the genes/nearest upstream/nearest downstream genes of the highly associated SNPs using Enrichr in GWAS Catalogue 2019 revealed significant diseases/drug terms associated with ASD or schizophrenia (p = 0.001107; adjusted p = 0.0321) on eight genes, namely SFTA2, BRD2, HCP5, OR5V1, HLA-DMA, ZKSCAN8, OR12D2, and MICA [36]. Four genes (TMEM185B, MTHFD1L, QPCT, and H2AFV, p = 0.0098) were downregulated relative to their median expression in the ventral juxtacommissural pretectal nucleus among the genes/nearest upstream/nearest downstream genes of highly associated SNPs using Enrichr [36]. Children with systemic lupus erythematosus (SLE) have a high risk of developing autism. In the present study, seven genes (BRD2, OR12D2, CR2, OR5V1, SFTA2, HCP5, and HLA-DMA) were highly significant for SLE (p = 0.000029; Bonferroni = 0.0041) using DAVID [37,38].
The risk haplotype of the OR12D2 gene in autism subjects and the overexpression of OR12D2 in the brain, dysfunction in neurodegenerative processes, olfactory impairment, and the overuse of aroma compounds or essential oils, flowers, aromatic wood, herbs, frankincense, and perfumes among the Arab population provide clues that olfactory sensory deficits and overexpression of OR12D2 should be studied in detail among the Arab population to reveal the underlying etiology of autism [18,19,20,21,39,40].
Even though the olfactory receptor genes on chromosome 6 are significant after a Bonferroni correction (α = 0.05/243345 = 2.05 × 10⁻⁷) with high linkage disequilibrium (p = 6.71 × 10⁻⁹ on 6p22.1), their significance on the transcriptome sequencing was lacking. Furthermore, the most significantly upregulated gene, RPS12, and the most significant downregulated gene, MPO, were observed with no significant variants in the exome array. This suggests that whole-genome sequencing on these subjects may reveal the significant genes with novel variants which are not covered in the exome array. Differentially expressed genes in autism are essential for the complete understanding of the associated functional and autism development pathways [10,11,12]. Earlier studies have revealed many significantly differentially expressed genes from various populations [10,11,12]. However, there were no studies on the differentially expressed genes in autism in Saudi Arabians. Hence, this study can be considered as a first of its kind study on autistic patients from Saudi Arabia. Additionally, the integrated analysis of exome array and transcriptome sequencing is an initial study on the Arab ancestries with autism. The upregulated integrin subunit Beta 3 binding protein (ITGB3BP) gene with rs6657480 (p = 0.000762) in the present study is in line with the previous studies on the genes predicted to affect risk for ASD [41]. The upregulated ITGB3BP gene in the present study is targeted as an autism-risk gene in human fetal brains [42], and also differential expression was observed in a mouse model [43]. Downregulation of ITGB3BP was observed in GABAergic neural development [44]. SNPs associated with schizophrenia risk were identified in the gene ITGB3BP [45].
SNP rs3130780 was observed in this study, which is located close to the downregulated discoidin domain receptor 1 (DDR1) gene. DDR1 was reported earlier as a susceptibility gene for schizophrenia [46,47] and self-consciousness [48]. DDR1-mediated signaling systems were observed in Drosophila in the mushroom body encoding learning and memory [49,50]. DDR1 plays an important role in myelination and neuropsychiatric diseases [51]. DDR1 expression increases in parallel with neural myelination throughout mouse brain development, according to previous research [52]. The exonic variation of rs1940475 (NP_002415.1:p.Lys87Glu) in the MMP8 gene was found to be a significant coding variant in the genotype association study, and it impacts the expression level of the MMP8 gene. Pathway analysis and genome-wide association in major depressive disorder revealed a significant association with the MMP8 gene [53]. rs1940475 in the MMP8 gene was reported for its association with osteoarthritis [54], femoral head osteonecrosis [55], and bladder cancer in non-smokers [56]. On the other hand, a recent meta-analysis of the K87E (rs1940475) variant showed that this variant is not significantly associated with cancer susceptibility [57]. Overall, the literature on the ITGB3BP, DDR1, and MMP8 genes indicates that the observation regarding the integration of transcriptome and exome genotyping in autism is a notable addition for the understanding of the genetics of autism. Defects in the SH3 and multiple ankyrin repeat domains 3 (Shank3) protein cause numerous synaptopathies, including autism [58,59,60]; upregulation of the RPL36A was reported in the striatal synaptosome of Shank3-overexpressing transgenic mice [58]. This is in line with the present observation on the upregulation of RPL36A in autistic patients and indicates that the upregulation of RPL36A can influence the development of autism through the dysfunction of SHANK3-associated synaptopathies [58,61]. The small number of subjects enrolled in this study was a notable limitation. However, the autistic patients were selected from 1800 patients visiting the neurology clinic. Currently, research guiding medication choice and dosing in patients with ASD is limited. Autism symptoms are usually managed with a variety of medications such as psychotropic (antipsychotics and antidepressants) drugs to manage behaviors such as mood symptoms, resulting in polypharmacy- and drug-related adverse effects. Knowledge of the clinical and genetic predictors of drug response variability and the outcomes of personalized medicine can advance the clinical care of young patients with ASD. Pharmacogenomics is a method that can be used for medication choice that affects a person’s genetic information and clinical presentation to make informed choices, but no studies have specifically examined the outcomes of PGX for patients with ASD. We believe that we can use the result of our study to help in the diagnosis and treatment of patients with autism. Further studies are needed to provide further information on the genetic risk in relation to treatment effectiveness. Analysis of reactive oxygen species (ROS) generation and stress enzymes in the cases and controls may strengthen the observed findings.

4. Materials and Methods

4.1. Sample Collection

This study was conducted in accordance with the Declaration of Helsinki and was approved by the Institutional Review Board (IRB) of Imam Abdulrahman Bin Faisal University. Cheek swab samples were collected for DNA and blood samples for RNA from children and adolescents up to 18 years of age from the Eastern Province of Saudi Arabia upon receiving signed informed consent from a parent and/or legal guardian for participation in the study. A total of 202 subjects of Arab ancestry (132 controls and 70 cases) provided cheek swab samples for genomic DNA extraction for exome genotyping (Table 6). A total of 1800 patients were evaluated in a pediatric neurology clinic and screened for autism from January 2018 to December 2018. Of these, 70 patients (47 males and 23 females) with an average age of 7.56 ± 3.68 years fulfilled the DSM-5 criteria for autism [9]. The clinical evaluation of the patients revealed an overall positive family history of 8.57% (n = 6). Patients with comorbidities were excluded from this study. Healthy subjects without familial autism were selected as controls.

4.2. DNA Extraction and Exome Array

The Gentra Puregene Buccal Cell Kit (Qiagen, Hilden, Germany) was used to extract DNA from the buccal cell samples. The Human Exome Bead Chip Kit v1.0 and v1.1 Illumina (San Diego, CA, USA), which consists of 243,345 putative functional exonic markers, was utilized with Illumina iScan for the microarray. All DNA samples were processed according to the manufacturer’s protocol, and iScan control software (Illumina) was used to acquire data. DNA extraction and the microarray genotyping and analysis were performed at the genetics research laboratory of the Institute for Research and Medical Consultations, Imam Abdulrahman Bin Faisal University, Dammam, Saudi Arabia. Genotyping was carried out in this lab from 2016 to 2018 using the same chip and procedures.

4.3. Genotyping and Functional Analysis

GenomeStudio 2.0 Data Analysis software (Illumina) was used for the initial quality check of the call rate. A total of 21 controls and 2 patients with autism were excluded from the analysis due to a call rate <0.975%, and the results were thus re-clustered. The Hardy–Weinberg equilibrium (HWE) was tested separately among the case and control groups with a 1 degree of freedom (df) genotypic chi-square test. Differences in clinical characteristics between cases and controls were calculated by the two-sample t-test or the χ2 test, as appropriate, using IBM SPSS Statistics version 23 software (IBM Co., Armonk, NY, USA). Kaviar [62] and SNP-Nexus [63] were used to confirm variants reported at a base pair position on the respective chromosome as per Genome Reference Consortium Human Build 37 (GRCh37.p13.). Case–control association analyses, odds ratios, and 95% confidence intervals were calculated to evaluate the effects of different alleles and haplotypes using Haploview version 4.2 [64] and gPLINK version 2.050 [65]. Bonferroni corrections or false discovery rate corrections were applied to correct the p-values of the 243,345 single nucleotide polymorphisms (SNPs) (corrected α = 0.05/243,345 = 2.05 × 10⁻⁷) to control inflation of the type I error rate. A p-value < 0.05 was considered significant. The highly significant (p < 1 × 10⁻⁵) genes were annotated for functional implications using DAVID 6.7 [37], STRING 10.5 [66], SNPnexus [63], Expression Atlas [17], Reactome [67], FunRich [68], Toppgene [69], and Enrichr [36].

4.4. Whole RNA Sequencing and Differentially Expressed Genes

Total ribonucleic acid (RNA) was extracted from blood (30 controls and 30 patients with autism) using the RNeasy plus micro kit (Qiagen, Hilden, Germany) following the manufacturer’s guidelines. Total RNA was quantitated using the Qubit RNA HS assay kit (Life Technologies, Eugene, OR, USA), and the quality was assessed by an Agilent 2100 (Agilent, Santa Clara, CA, USA). High-quality RNA was used to construct the cDNA library. Twenty milligrams of total RNA from each sample was treated separately with oligo (dT) for mRNA enrichment. N6 random primers were used for reverse-transcribing the target RNA fragments into double-strand cDNA. End repair was performed on double-strand cDNA fragments, and adaptors were ligated to the double-strand cDNA. All the ligated double-strand cDNA were PCR-amplified, denatured by heat into single-strand DNA and quantified, and subjected to DNA nanoball synthesis and sequencing on the DNBseq platform. Transcriptome assembly was carried out after subjecting the raw reads to quality control. Reads of adaptors and unknown bases, as well as low-quality reads, were discarded. The raw RNA sequencing data reads with high quality were mapped using the tophat RNA Sequence mapping tool. The aligned sequence data were analyzed for the differential expression between the autistic and the control subjects by considering the foldchange ≥ 0.8 and p-value ≤ 0.05 for upregulated genes and the foldchange ≤ −0.8 and p-value ≤ 0.05 for downregulated genes. All the expressed genes from the autistic and control samples with a quality Phred score ≥ 30 were only subjected to the differential expressed gene analysis. The highly significantly up- and downregulated genes were annotated for pathway enrichment analysis using DAVID 6.7 [37], STRING 10.5 [66], Expression Atlas [17], Reactome [67], FunRich [68], Toppgene [69], and Enrichr [36].

5. Conclusions

The Saudi autistic patients are significantly different according to the gene expression profile. The fivefold downregulated MPO, TMCC3, MMP8, CA1, and ELF3 genes and the fivefold upregulated MTRNR2L8 gene can be considered for the early identification of autism patients among Saudis. This study identified the OR12D2 gene, including the 5’ and 3’ regions associated with 10 ASD SNPs on chromosome 6p22.1. The SNPs detected in patients with autism in the current study are variants in genes that either control fundamental cell survival processes or direct neurological functions that might contribute to the severity of ASD. Screening the molecular defects that are prevalent in Saudi autistic cases is a very important step to better understand the possible genes that are involved in the development of ASD. Regulatory variations (rs6657480, rs3130780, and rs1940475) identified the up- (ITGB3BP) and downregulation (DDR1 and MMP8) of genes in autism spectrum disorder in patients of Arab ancestry discovered through the integration of up- and downregulated genes and genes of significant genotypes. Further studies are needed to investigate the pathogenic pathways of the reported SNPs and genes to develop potential therapeutic targets in the future. The presence of a panel of the most prevalent variants in ASD cases will aid in enhancing our knowledge and understanding of the complexity behind the variability in ASD.

Supplementary Materials

The following are available online at https://www.mdpi.com/article/10.3390/ph15020158/s1, Table S1 (Supplementary Material) List of significant SNPs at p <0.001; Table S2 (Supplementary Material) The functional annotations of the most significant genes (p<0.0001) based on the DAVID 6.7 and Reactome.

Author Contributions

The study was designed by N.B.A., A.A., M.A., F.A.A., S.A. (Sayed AbdulAzeez), and J.F.B. Data were collected by N.B.A., A.A., S.A. (Safah Alzahrani), A.A.-m., M.A., F.A.A., S.A. (Sayed AbdulAzeez), and J.F.B.; N.B.A., S.A.A., D.N.A., A.A.A., S.A. (Sayed AbdulAzeez), and J.F.B. wrote the manuscript. Data were analyzed by N.B.A., S.A.A., D.N.A., H.E.A., A.A.A., S.A. (Safah Alzahrani), A.A.-m., M.A., F.A.A., S.A. (Sayed AbdulAzeez), and J.F.B. All authors have read and agreed to the published version of the manuscript.

Funding

This study was supported by the Deanship of Scientific Research, Imam Abdulrahman Bin Faisal University (Grant No: 2016–057-IRMC and 2017–202-IRMC). The authors thank the Institute for Research and Medical Consultations for instrumentation and facilitation.

Institutional Review Board Statement

This study was conducted in a ccordance with the Declaration of Helsinki and was approved by the Institutional Review Board (IRB) of Imam Abdulrahman Bin Faisal University (project identi-fication code: IRB-2016-13-152 and IRB-2017-13-168).

Informed Consent Statement

Samples were collected from children and adolescents up to 18 years upon receiving signed informed consent from a parent and/or legal guardian for participation in the study.

Data Availability Statement

Data is contained within article and Supplementary Materials.

Acknowledgments

The authors thank the Dean of the Institute for Research and Medical Consultations (IRMC), Imam Abdulrahman Bin Faisal University, Dammam, Saudi Arabia for her continuous support and encouragement. We author appreciate the technical assistance from Ranilo M. Tumbaga, Horace T. Pacifico, Jee E. Aquino and Lojain Alalai.

Conflicts of Interest

The authors declare that they have no competing interests.

References

  1. Almandil, N.; Alkuroud, D.; AbdulAzeez, S.; AlSulaiman, A.; Elaissari, A.; Borgio, J. Environmental and Genetic Factors in Autism Spectrum Disorders: Special Emphasis on Data from Arabian Studies. Int. J. Environ. Res. Public Health 2019, 16, 658. [Google Scholar] [CrossRef] [PubMed] [Green Version]
  2. Cheroni, C.; Caporale, N.; Testa, G. Autism Spectrum Disorder at the Crossroad between Genes and Environment: Contributions, Convergences, and Interactions in ASD Developmental Pathophysiology. Mol. Autism 2020, 11, 69. [Google Scholar] [CrossRef] [PubMed]
  3. Chen, J.; Yu, S.; Fu, Y.; Li, X. Synaptic Proteins and Receptors Defects in Autism Spectrum Disorders. Front. Cell. Neurosci. 2014, 8, 276. [Google Scholar] [CrossRef] [PubMed] [Green Version]
  4. Freitag, C.M. The Genetics of Autistic Disorders and Its Clinical Relevance: A Review of the Literature. Mol. Psychiatry 2007, 12, 2–22. [Google Scholar] [CrossRef] [Green Version]
  5. Freitag, C.M.; Staal, W.; Klauck, S.M.; Duketis, E.; Waltes, R. Genetics of Autistic Disorders: Review and Clinical Implications. Eur. Child Adolesc. Psychiatry 2010, 19, 169–178. [Google Scholar] [CrossRef] [PubMed] [Green Version]
  6. Tick, B.; Bolton, P.; Happé, F.; Rutter, M.; Rijsdijk, F. Heritability of Autism Spectrum Disorders: A Meta-Analysis of Twin Studies. J. Child Psychol. Psychiatry 2016, 57, 585–595. [Google Scholar] [CrossRef] [Green Version]
  7. Baranek, G.T.; Boyd, B.A.; Poe, M.D.; David, F.J.; Watson, L.R. Hyperresponsive Sensory Patterns in Young Children with Autism, Developmental Delay, and Typical Development. Am. J. Ment. Retard 2007, 112, 233. [Google Scholar] [CrossRef]
  8. Boyd, B.A.; Baranek, G.T.; Sideris, J.; Poe, M.D.; Watson, L.R.; Patten, E.; Miller, H. Sensory Features and Repetitive Behaviors in Children with Autism and Developmental Delays. Autism Res. 2010, 3, 78–87. [Google Scholar] [CrossRef]
  9. Watson, L.R.; Patten, E.; Baranek, G.T.; Poe, M.; Boyd, B.A.; Freuler, A.; Lorenzi, J. Differential Associations between Sensory Response Patterns and Language, Social, and Communication Measures in Children with Autism or Other Developmental Disabilities. J. Speech Lang. Heart Res. 2011, 54, 1562–1576. [Google Scholar] [CrossRef] [Green Version]
  10. Ning, L.F.; Yu, Y.Q.; GuoJi, E.T.; Kou, C.G.; Wu, Y.H.; Shi, J.P.; Ai, L.Z.; Yu, Q. Meta-Analysis of Differentially Expressed Genes in Autism Based on Gene Expression Data. Genet. Mol. Res. 2015, 14, 2146–2155. [Google Scholar] [CrossRef]
  11. Rahman, M.R.; Petralia, M.C.; Ciurleo, R.; Bramanti, A.; Fagone, P.; Shahjaman, M.; Wu, L.; Sun, Y.; Turanli, B.; Arga, K.Y.; et al. Comprehensive Analysis of RNA-Seq Gene Expression Profiling of Brain Transcriptomes Reveals Novel Genes, Regulators, and Pathways in Autism Spectrum Disorder. Brain Sci. 2020, 10, 747. [Google Scholar] [CrossRef] [PubMed]
  12. Zhang, S.; Deng, L.; Jia, Q.; Huang, S.; Gu, J.; Zhou, F.; Gao, M.; Sun, X.; Feng, C.; Fan, G. DbMDEGA: A Database for Meta-Analysis of Differentially Expressed Genes in Autism Spectrum Disorder. BMC Bioinform. 2017, 18, 494. [Google Scholar] [CrossRef] [PubMed] [Green Version]
  13. Huyghe, J.R.; Jackson, A.U.; Fogarty, M.P.; Buchkovich, M.L.; Stančáková, A.; Stringham, H.M.; Sim, X.; Yang, L.; Fuchsberger, C.; Cederberg, H.; et al. Exome Array Analysis Identifies New Loci and Low-Frequency Variants Influencing Insulin Processing and Secretion. Nat. Genet. 2013, 45, 197–201. [Google Scholar] [CrossRef] [PubMed] [Green Version]
  14. Guo, Y.; He, J.; Zhao, S.; Wu, H.; Zhong, X.; Sheng, Q.; Samuels, D.C.; Shyr, Y.; Long, J. Illumina Human Exome Genotyping Array Clustering and Quality Control. Nat. Protoc. 2014, 9, 2643–2662. [Google Scholar] [CrossRef]
  15. Trapnell, C.; Hendrickson, D.G.; Sauvageau, M.; Goff, L.; Rinn, J.L.; Pachter, L. Differential Analysis of Gene Regulation at Transcript Resolution with RNA-Seq. Nat. Biotechnol. 2013, 31, 46–53. [Google Scholar] [CrossRef]
  16. Al-Mubarak, B.; Abouelhoda, M.; Omar, A.; AlDhalaan, H.; Aldosari, M.; Nester, M.; Alshamrani, H.A.; El-Kalioby, M.; Goljan, E.; Albar, R.; et al. Whole Exome Sequencing Reveals Inherited and de Novo Variants in Autism Spectrum Disorder: A Trio Study from Saudi Families. Sci. Rep. 2017, 7, 5679. [Google Scholar] [CrossRef]
  17. Papatheodorou, I.; Fonseca, N.A.; Keays, M.; Tang, Y.A.; Barrera, E.; Bazant, W.; Burke, M.; Füllgrabe, A.; Fuentes, A.M.-P.; George, N.; et al. Expression Atlas: Gene and Protein Expression across Multiple Studies and Organisms. Nucleic Acids Res. 2018, 46, D246–D251. [Google Scholar] [CrossRef]
  18. The GTEx Consortium; Ardlie, K.G.; Deluca, D.S.; Segrè, A.V.; Sullivan, T.J.; Young, T.R.; Gelfand, E.T.; Trowbridge, C.A.; Maller, J.B.; Tukiainen, T. The Genotype-Tissue Expression (GTEx) Pilot Analysis: Multitissue Gene Regulation in Humans. Science 2015, 348, 648–660. [Google Scholar] [CrossRef] [Green Version]
  19. Rozenkrantz, L.; Zachor, D.; Heller, I.; Plotkin, A.; Weissbrod, A.; Snitz, K.; Secundo, L.; Sobel, N. A Mechanistic Link between Olfaction and Autism Spectrum Disorder. Curr. Biol. 2015, 25, 1904–1910. [Google Scholar] [CrossRef] [Green Version]
  20. Schecklmann, M.; Schwenck, C.; Taurines, R.; Freitag, C.; Warnke, A.; Gerlach, M.; Romanos, M. A Systematic Review on Olfaction in Child and Adolescent Psychiatric Disorders. J. Neur. Transm. 2013, 120, 121–130. [Google Scholar] [CrossRef]
  21. Berko, E.R.; Suzuki, M.; Beren, F.; Lemetre, C.; Alaimo, C.M.; Calder, R.B.; Ballaban-Gil, K.; Gounder, B.; Kampf, K.; Kirschen, J.; et al. Mosaic Epigenetic Dysregulation of Ectodermal Cells in Autism Spectrum Disorder. PLoS Genet. 2014, 10, e1004402. [Google Scholar] [CrossRef] [PubMed] [Green Version]
  22. Tonacci, A.; Billeci, L.; Tartarisco, G.; Ruta, L.; Muratori, F.; Pioggia, G.; Gangemi, S. Olfaction in Autism Spectrum Disorders: A Systematic Review. Child Neuropsychol. 2017, 23, 1–25. [Google Scholar] [CrossRef] [PubMed]
  23. Hatami, M.; Karamghadiri, N.; Mohaghegh, H.; Yoosefee, S.; Karimipoor, M.; Hadjighasem, M.; Ananloo, E.S. Neuregulin-1 Gene and Schizophrenia, and Its Negative Symptoms in an Iranian Population. Iran. J. Psychiatry Behav. Sci. 2016, 11. [Google Scholar] [CrossRef] [Green Version]
  24. Hawi, Z.; Cummins, T.D.R.; Tong, J.; Johnson, B.; Lau, R.; Samarrai, W.; Bellgrove, M.A. The Molecular Genetic Architecture of Attention Deficit Hyperactivity Disorder. Mol. Psychiatry 2015, 20, 289–297. [Google Scholar] [CrossRef]
  25. Jungerius, B.J.; Bakker, S.C.; Monsuur, A.J.; Sinke, R.J.; Kahn, R.S.; Wijmenga, C. Is MYO9B the Missing Link between Schizophrenia and Celiac Disease? Am. J. Med. Genet. 2008, 147B, 351–355. [Google Scholar] [CrossRef]
  26. Kerner, B.; Lambert, C.G.; Muthén, B.O. Genome-Wide Association Study in Bipolar Patients Stratified by Co-Morbidity. PLoS ONE 2011, 6, e28477. [Google Scholar] [CrossRef]
  27. Latiano, A.; Palmieri, O.; Valvano, M.R.; D’Incà, R.; Caprilli, R.; Cucchiara, S.; Sturniolo, G.C.; Bossa, F.; Andriulli, A.; Annese, V. The Association of MYO9B Gene in Italian Patients with Inflammatory Bowel Diseases: MYO9B gene in inflammatory bowel disease ibd. Aliment. Pharmacol. Ther. 2007, 27, 241–248. [Google Scholar] [CrossRef]
  28. Lü, M.; Xia, B.; Ge, L.; Li, Y.; Zhao, J.; Chen, F.; Zhou, F.; Zhang, X.; Tan, J. Role of Major Histocompatibility Complex Class I-Related Molecules A*A5·1 Allele in Ulcerative Colitis in Chinese Patients. Immunology 2009, 128, e230–e236. [Google Scholar] [CrossRef]
  29. Naj, A.C.; Beecham, G.W.; Martin, E.R.; Gallins, P.J.; Powell, E.H.; Konidari, I.; Whitehead, P.L.; Cai, G.; Haroutunian, V.; Scott, W.K.; et al. Dementia Revealed: Novel Chromosome 6 Locus for Late-Onset Alzheimer Disease Provides Genetic Evidence for Folate-Pathway Abnormalities. PLoS Genet. 2010, 6, e1001130. [Google Scholar] [CrossRef] [Green Version]
  30. Orchard, T.R.; Dhar, A.; Simmons, J.D.; Vaughan, R.; Welsh, K.I.; Jewell, D.P. MHC Class I Chain-like Gene A (MICA) and Its Associations with Inflammatory Bowel Disease and Peripheral Arthropathy: MICA in IBD. Clin. Exp. Immunol. 2001, 126, 437–440. [Google Scholar] [CrossRef]
  31. Pal, D.K.; Evgrafov, O.V.; Tabares, P.; Zhang, F.; Durner, M.; Greenberg, D.A. BRD2 (RING3) Is a Probable Major Susceptibility Gene for Common Juvenile Myoclonic Epilepsy. Am. J. Hum. Genet. 2003, 73, 261–270. [Google Scholar] [CrossRef] [PubMed] [Green Version]
  32. Ren, R.-J.; Wang, L.-L.; Fang, R.; Liu, L.-H.; Wang, Y.; Tang, H.-D.; Deng, Y.-L.; Xu, W.; Wang, G.; Chen, S.-D. The MTHFD1L Gene Rs11754661 Marker Is Associated with Susceptibility to Alzheimer’s Disease in the Chinese Han Population. J. Neurol. Sci. 2011, 308, 32–34. [Google Scholar] [CrossRef] [PubMed]
  33. Rouillard, A.D.; Gundersen, G.W.; Fernandez, N.F.; Wang, Z.; Monteiro, C.D.; McDermott, M.G.; Ma’ayan, A. The Harmonizome: A Collection of Processed Datasets Gathered to Serve and Mine Knowledge about Genes and Proteins. Database 2016, 2016, baw100. [Google Scholar] [CrossRef] [PubMed]
  34. Sánchez, E.; Alizadeh, B.Z.; Valdigem, G.; Ortego-Centeno, N.; Jiménez-Alonso, J.; de Ramón, E.; García, A.; López-Nevot, M.A.; Wijmenga, C.; Martín, J.; et al. MYO9B Gene Polymorphisms Are Associated with Autoimmune Diseases in Spanish Population. Hum. Immunol. 2007, 68, 610–615. [Google Scholar] [CrossRef] [PubMed]
  35. Xu, C.; Aragam, N.; Li, X.; Villla, E.C.; Wang, L.; Briones, D.; Petty, L.; Posada, Y.; Arana, T.B.; Cruz, G.; et al. BCL9 and C9orf5 Are Associated with Negative Symptoms in Schizophrenia: Meta-Analysis of Two Genome-Wide Association Studies. PLoS ONE 2013, 8, e51674. [Google Scholar] [CrossRef] [PubMed]
  36. Kuleshov, M.V.; Jones, M.R.; Rouillard, A.D.; Fernandez, N.F.; Duan, Q.; Wang, Z.; Koplev, S.; Jenkins, S.L.; Jagodnik, K.M.; Lachmann, A.; et al. Enrichr: A Comprehensive Gene Set Enrichment Analysis Web Server 2016 Update. Nucleic Acids Res. 2016, 44, W90–W97. [Google Scholar] [CrossRef] [Green Version]
  37. Huang, D.W.; Sherman, B.T.; Lempicki, R.A. Systematic and Integrative Analysis of Large Gene Lists Using DAVID Bioinformatics Resources. Nat. Protoc. 2009, 4, 44–57. [Google Scholar] [CrossRef]
  38. Vinet, É.; Pineau, C.A.; Clarke, A.E.; Scott, S.; Fombonne, É.; Joseph, L.; Platt, R.W.; Bernatsky, S. Increased Risk of Autism Spectrum Disorders in Children Born to Women with Systemic Lupus Erythematosus: Results from a Large Population-Based Cohort: ASD RISK IN SLE OFFSPRING. Arthritis Rheumatol. 2015, 67, 3201–3208. [Google Scholar] [CrossRef] [Green Version]
  39. Gaillard, I.; Rouquier, S.; Giorgi, D. Olfactory Receptors. Cell Mol. Life Sci. 2004, 61, 456–469. [Google Scholar] [CrossRef]
  40. Mesallam, T.A.; Farahat, M.; Shoeib, R.; Alharethy, S.; Alshahwan, A.; Murry, T.; Malki, K.H. Acute Effects of Inhaling Oud Incense on Voice of Saudi Adults. Ann. Saudi Med. 2015, 35, 111–119. [Google Scholar] [CrossRef] [Green Version]
  41. Liu, L.; Lei, J.; Sanders, S.J.; Willsey, A.J.; Kou, Y.; Cicek, A.E.; Klei, L.; Lu, C.; He, X.; Li, M.; et al. DAWN: A Framework to Identify Autism Genes and Subnetworks Using Gene Expression and Genetics. Mol. Autism 2014, 5, 22. [Google Scholar] [CrossRef] [PubMed] [Green Version]
  42. Cotney, J.; Muhle, R.A.; Sanders, S.J.; Liu, L.; Willsey, A.J.; Niu, W.; Liu, W.; Klei, L.; Lei, J.; Yin, J.; et al. The Autism-Associated Chromatin Modifier CHD8 Regulates Other Autism Risk Genes during Human Neurodevelopment. Nat. Commun. 2015, 6, 6404. [Google Scholar] [CrossRef]
  43. Ahmad, E. Differential Gene Expression in the Prenatal Brain of Cyclooxygenase-1 and 2 Knockout Male Mice-A Model System of Autism Spectrum Disorders; York University: Toronto, ON, Canada, 2017. [Google Scholar]
  44. Choi, Y.K.; Vasudevan, A. Mechanistic Insights into Autocrine and Paracrine Roles of Endothelial GABA Signaling in the Embryonic Forebrain. Sci. Rep. 2019, 9, 16256. [Google Scholar] [CrossRef] [PubMed] [Green Version]
  45. Benjamin, K.J.; Feltrin, A.S.; Barbosa, A.R.; Jaffe, A.E.; Collado-Torres, L.; Burke, E.E.; Shin, J.H.; Ulrich, W.S.; Deep-Soboslay, A.; Tao, R.; et al. Genetic and Environmental Regulation of Caudate Nucleus Transcriptome: Insight into Schizophrenia Risk and the Dopamine System. Psychiatry Clin. Psychol. 2020. [Google Scholar] [CrossRef]
  46. Hoerder-Suabedissen, A.; Oeschger, F.M.; Krishnan, M.L.; Belgard, T.G.; Wang, W.Z.; Lee, S.; Webber, C.; Petretto, E.; Edwards, A.D.; Molnár, Z. Expression Profiling of Mouse Subplate Reveals a Dynamic Gene Network and Disease Association with Autism and Schizophrenia. Proc. Natl. Acad. Sci. USA 2013, 110, 3555–3560. [Google Scholar] [CrossRef] [PubMed] [Green Version]
  47. Roig, B.; Virgos, C.; Franco, N.; Martorell, L.; Valero, J.; Costas, J.; Carracedo, A.; Labad, A.; Vilella, E. The Discoidin Domain Receptor 1 as a Novel Susceptibility Gene for Schizophrenia. Mol. Psychiatry 2007, 12, 833–841. [Google Scholar] [CrossRef] [Green Version]
  48. Kim, S.E.; Kim, H.-N.; Yun, Y.-J.; Heo, S.G.; Cho, J.; Kwon, M.-J.; Chang, Y.; Ryu, S.; Shin, H.; Shin, C.; et al. Meta-Analysis of Genome-Wide SNP- and Pathway-Based Associations for Facets of Neuroticism. J. Hum. Genet. 2017, 62, 903–909. [Google Scholar] [CrossRef] [PubMed] [Green Version]
  49. Karam, C.S.; Jones, S.K.; Javitch, J.A. Come Fly with Me: An Overview of Dopamine Receptors in Drosophila melanogaster. Basic Clin. Pharmacol. Toxicol. 2020, 126, 56–65. [Google Scholar] [CrossRef] [Green Version]
  50. Pham, H.T.N.; Tran, H.N.; Le, X.T.; Do, H.T.; Nguyen, T.T.; Le Nguyen, C.; Yoshida, H.; Yamaguchi, M.; William, F.R.; Matsumoto, K.; et al. Tseng Mitigates Phenotypic Characteristics of Human Autism Spectrum Disorders in a Drosophila Melanogaster Rugose Mutant. Neurochem. Res. 2021, 46, 1995–2007. [Google Scholar] [CrossRef]
  51. Vilella, E.; Gas, C.; Garcia-Ruiz, B.; Rivera, F.J. Expression of DDR1 in the CNS and in Myelinating Oligodendrocytes. Biochim. Biophys. Acta (BBA) Mol. Cell Res. 2019, 1866, 118483. [Google Scholar] [CrossRef]
  52. Franco-Pons, N.; Virgos, C.; Vogel, W.F.; Ureña, J.M.; Soriano, E.; del Rio, J.A.; Vilella, E. Expression of Discoidin Domain Receptor 1 during Mouse Brain Development Follows the Progress of Myelination. Neuroscience 2006, 140, 463–475. [Google Scholar] [CrossRef] [PubMed]
  53. Song, G.G.; Kim, J.-H.; Lee, Y.H. Genome-Wide Pathway Analysis in Major Depressive Disorder. J. Mol. Neurosci. 2013, 51, 428–436. [Google Scholar] [CrossRef] [PubMed]
  54. Näkki, A.; Rodriguez-Fontenla, C.; Gonzalez, A.; Harilainen, A.; Leino-Arjas, P.; Heliövaara, M.; Eriksson, J.G.; Tallroth, K.; Videman, T.; Kaprio, J.; et al. Association Study of MMP8 Gene in Osteoarthritis. Connect. Tissue Res. 2016, 57, 44–52. [Google Scholar] [CrossRef] [Green Version]
  55. Du, J.; Jin, T.; Cao, Y.; Chen, J.; Guo, Y.; Sun, M.; Li, J.; Zhang, X.; Wang, G.; Wang, J. Association between Genetic Polymorphisms of MMP8 and the Risk of Steroid-Induced Osteonecrosis of the Femoral Head in the Population of Northern China. Medicine 2016, 95, e4794. [Google Scholar] [CrossRef] [PubMed]
  56. Kader, A.K.; Liu, J.; Shao, L.; Dinney, C.P.; Lin, J.; Wang, Y.; Gu, J.; Grossman, H.B.; Wu, X. Matrix Metalloproteinase Polymorphisms Are Associated with Bladder Cancer Invasiveness. Clin. Cancer Res. 2007, 13, 2614–2620. [Google Scholar] [CrossRef] [PubMed] [Green Version]
  57. Lin, Y.; Liu, J.; Jin, L.; Jiang, Y. Polymorphisms in Matrix Metalloproteinases 2, 3, and 8 Increase Recurrence and Mortality Risk by Regulating Enzyme Activity in Gastric Adenocarcinoma. Oncotarget 2017, 8, 105971–105983. [Google Scholar] [CrossRef] [Green Version]
  58. Jin, C.; Lee, Y.; Kang, H.; Jeong, K.; Park, J.; Zhang, Y.; Kang, H.R.; Ma, R.; Seong, H.; Kim, Y.; et al. Increased Ribosomal Protein Levels and Protein Synthesis in the Striatal Synaptosome of Shank3-Overexpressing Transgenic Mice. Mol. Brain 2021, 14, 39. [Google Scholar] [CrossRef]
  59. Zoghbi, H.Y.; Bear, M.F. Synaptic Dysfunction in Neurodevelopmental Disorders Associated with Autism and Intellectual Disabilities. Cold Spring Harb. Perspect. Biol. 2012, 4, a009886. [Google Scholar] [CrossRef] [Green Version]
  60. Wang, L.; Pang, K.; Han, K.; Adamski, C.J.; Wang, W.; He, L.; Lai, J.K.; Bondar, V.V.; Duman, J.G.; Richman, R.; et al. An Autism-Linked Missense Mutation in SHANK3 Reveals the Modularity of Shank3 Function. Mol. Psychiatry 2020, 25, 2534–2555. [Google Scholar] [CrossRef]
  61. Jin, C.; Kim, S.; Kang, H.; Yun, K.N.; Lee, Y.; Zhang, Y.; Kim, Y.; Kim, J.Y.; Han, K. Shank3 Regulates Striatal Synaptic Abundance of Cyld, a Deubiquitinase Specific for Lys63-linked Polyubiquitin Chains. J. Neurochem. 2019, 150, 776–786. [Google Scholar] [CrossRef]
  62. Glusman, G.; Caballero, J.; Mauldin, D.E.; Hood, L.; Roach, J.C. Kaviar: An Accessible System for Testing SNV Novelty. Bioinformatics 2011, 27, 3216–3217. [Google Scholar] [CrossRef] [Green Version]
  63. Dayem Ullah, A.Z.; Lemoine, N.R.; Chelala, C. SNPnexus: A Web Server for Functional Annotation of Novel and Publicly Known Genetic Variants (2012 Update). Nucleic Acids Res. 2012, 40, W65–W70. [Google Scholar] [CrossRef] [PubMed] [Green Version]
  64. Barrett, J.C.; Fry, B.; Maller, J.; Daly, M.J. Haploview: Analysis and Visualization of LD and Haplotype Maps. Bioinformatics 2005, 21, 263–265. [Google Scholar] [CrossRef] [PubMed] [Green Version]
  65. Purcell, S.; Neale, B.; Todd-Brown, K.; Thomas, L.; Ferreira, M.A.R.; Bender, D.; Maller, J.; Sklar, P.; de Bakker, P.I.W.; Daly, M.J.; et al. PLINK: A Tool Set for Whole-Genome Association and Population-Based Linkage Analyses. Am. J. Hum. Genet. 2007, 81, 559–575. [Google Scholar] [CrossRef] [Green Version]
  66. Szklarczyk, D.; Morris, J.H.; Cook, H.; Kuhn, M.; Wyder, S.; Simonovic, M.; Santos, A.; Doncheva, N.T.; Roth, A.; Bork, P.; et al. The STRING Database in 2017: Quality-Controlled Protein–Protein Association Networks, Made Broadly Accessible. Nucleic Acids Res. 2017, 45, D362–D368. [Google Scholar] [CrossRef] [PubMed]
  67. Fabregat, A.; Jupe, S.; Matthews, L.; Sidiropoulos, K.; Gillespie, M.; Garapati, P.; Haw, R.; Jassal, B.; Korninger, F.; May, B.; et al. The Reactome Pathway Knowledgebase. Nucleic Acids Res. 2018, 46, D649–D655. [Google Scholar] [CrossRef]
  68. Pathan, M.; Keerthikumar, S.; Chisanga, D.; Alessandro, R.; Ang, C.; Askenase, P.; Batagov, A.O.; Benito-Martin, A.; Camussi, G.; Clayton, A.; et al. A Novel Community Driven Software for Functional Enrichment Analysis of Extracellular Vesicles Data. J. Extracell. Vesicles 2017, 6, 1321455. [Google Scholar] [CrossRef] [PubMed] [Green Version]
  69. Chen, J.; Bardes, E.E.; Aronow, B.J.; Jegga, A.G. ToppGene Suite for Gene List Enrichment Analysis and Candidate Gene Prioritization. Nucleic Acids Res. 2009, 37, W305–W311. [Google Scholar] [CrossRef]
Figure 1. Integration of whole RNA sequencing-based differentially expressed gene analysis (upregulated: foldchange ≥0.8 and p-value ≤ 0.05, n = 125; downregulated: foldchange ≤−0.8 and p-value ≤ 0.05, n = 117) of patients with autism in relation to the healthy controls with genes of significant genotypes. Venn diagram analysis of the curated data identifies three (rs6657480, rs3130780, and rs1940475) regulatory variants in the up- (ITGB3BP) and downregulated (DDR1 and MMP8) genes in autistic patients. * List of the fivefold downregulated and upregulated genes can be considered for the early identification of autism patients among Saudis.
Pharmaceuticals 15 00158 g001
Figure 2. (A): Manhattan plot of putative functional exonic variants n = 243,345 in the molecular genetics of autism from the association study. The log10 (p) values from the association are plotted according to variant position on each chromosome. Positions of candidate genes of functional exonic variants at olfactory receptor genes on chromosome 6p22.1 for autism are indicated by red arrows. The horizontal red line indicates the preset threshold of p= 4.00 × 10⁻⁷. The horizontal pink line indicates the suggestive threshold of p = 1.00 × 10⁻⁵. (B): Genetic association of the most significant variants at the OR12D2 and OR5V1 genes in the chromosome 6p22.1 region and linkage disequilibrium results in subjects of Arab ancestry with autism. Block 1 indicates the most significant risk haplotype, AAGTCTGATT (p = 6.7082 × 10⁻⁹), associated with the Arab-ancestry autism subjects.
Pharmaceuticals 15 00158 g002
Figure 3. Volcano plots of the significantly upregulated genes (red colored) and downregulated genes (green colored) between autism and controls. Upregulated: foldchange ≥ 0.8 and p-value ≤ 0.05; downregulated: foldchange ≤ −0.8 and p-value ≤ 0.05.
Pharmaceuticals 15 00158 g003
Figure 4. (A): Protein–protein interaction based on the predictive model and predicted functional partners of the OR12D2 and OR5V1 proteins using the STRING database, version 10. (B): Significantly upregulated genes and their interaction. Number of edges: 77 and the PPI enrichment p-value <1.0×10⁻¹⁶. (C): Significantly downregulated genes (p-value <0.001) and their interaction. Number of edges: 420 and the PPI enrichment p-value = 2.05×10−06.
Pharmaceuticals 15 00158 g004
Table 1. List of the most significant SNPs associated with autistic patients.
S.NoSNP IDCHRBPMAMAFCHISQPOR (L95–U95)GeneAACase, Control FrequenciesHWpval
1rs2073149629365423A0.579533.148.57 × 10−90.2367 (0.143–0.3918)OR12D2A0.754, 0.4240.0563
2rs2073153629364835G0.546530.53.34 × 10−80.2489 (0.15–0.4131)OR12D2T0.769, 0.4560.0388
3rs2073151629364951A0.539830.14.10 × 10−80.2498 (0.1501–0.4155)OR12D2G0.773, 0.4570.0504
4rs2394607629369519C0.568230.074.18 × 10−80.2586 (0.1576–0.4241)OR5V1T0.746, 0.4380.1677
5rs9257819629360183C0.539829.555.46 × 10−80.2558 (0.1545–0.4235)OR5V1A0.769, 0.4620.0394
6rs9257834629364615T0.539829.555.46 × 10−80.2558 (0.1545–0.4235)OR12D2G0.769, 0.4620.0301
7rs4987411629364643C0.539829.555.46 × 10−80.2558 (0.1545–0.4235)OR12D2T0.769, 0.4620.0301
8rs2073154629364815G0.539829.555.46 × 10−80.2558 (0.1545–0.4235)OR12D2C0.769, 0.4620.0394
9rs1028411629367399C0.539829.555.46 × 10−80.2558 (0.1545–0.4235)OR5V1T0.769, 0.4620.0394
10rs2022077629361124A0.539828.559.14 × 10−80.261 (0.1575–0.4325)OR5V1A0.766, 0.4660.0475
11rs93835836150212003T0.289827.091.94 × 10−70.1395 (0.06093–0.3193)RAET1EC0.946, 0.7190.2627
12rs28703878879417222G0.23324.826.30 × 10−73.396 (2.08–5.544)LOC105375911G0.508, 0.2550.1448
13rs796302712108894909C0.611824.587.15 × 10−70.3029 (0.1874–0.4894) T0.677, 0.4360.9318
14rs5712641774878259A0.369323.291.39 × 10−60.2397 (0.1307–0.4394)MGAT5BG0.877, 0.6670.0024
15rs62637606178172506G0.051123.091.55 × 10−65.81 (2.656–12.71)PFASG0.238, 0.0621
16rs2523590631327064G0.405922.432.18 × 10−60.2661 (0.1511–0.4689) T0.846, 0.6190.037
17rs674181927147973T0.460222.272.37 × 10−60.2932 (0.174–0.4942)RNF144AC0.800, 0.5760.7589
18rs888096237603801G0.346621.743.12 × 10−63.016 (1.885–4.828)LOC107985868G0.615, 0.3711
19rs2253705630900094A0.12521.383.76 × 10−63.706 (2.086–6.583)SFTA2T0.346, 0.1291
20rs6911487623774487A0.35821.14.37 × 10−62.965 (1.853–4.743) A0.623, 0.3861
21rs49027801470591661C0.579520.964.69 × 10−60.3342 (0.2077–0.5379)SLC8A3T0.685, 0.4140.0077
22rs2677331150958836G0.080420.94.84 × 10−64.377 (2.245–8.535)ANXA9G0.277, 0.1200.8843
23rs772927357228047T0.045420.85.10 × 10−65.765 (2.53–13.13) T0.215, 0.0571
24rs21325171110791983A0.2520.715.33 × 10−60.1707 (0.07411–0.3933)CTR9G0.946, 0.7760.4454
25rs580962632925692G0.585220.615.63 × 10−60.3383 (0.2105–0.5436)HLA-DMAT0.677, 0.4571
26rs516535632942302C0.585220.615.63 × 10−60.3383 (0.2105–0.5436)BRD2A0.677, 0.4621
27rs9266825631382882A0.465920.386.35 × 10−60.3147 (0.1885–0.5253)MICAC0.785, 0.5710.0328
28rs10223421631390055T0.465920.386.35 × 10−60.3147 (0.1885–0.5253)HCP5G0.785, 0.5710.0328
29rs9854207327614316C0.2520.386.36 × 10−63 (1.848–4.869) C0.500, 0.2620.09
30rs5053586151327848A0.590920.276.72 × 10−60.3422 (0.2132–0.5492)MTHFD1LG0.669, 0.4520.0046
31rs109709799334337G0.204520.236.86 × 10−63.122 (1.883–5.176)DOCK8G0.445, 0.2140.3033
32rs1802437744874113T0.569820.127.29 × 10−60.3336 (0.2051–0.5428)H2AFVC0.694, 0.4360.6251
33rs9419201491739081A0.23320.077.47 × 10−60.1593 (0.06538–0.3883)CCDC88CG0.954, 0.7930.2034
34rs71680691568624396A0.23320.077.47 × 10−60.1593 (0.06538–0.3883)ITGA11C0.954, 0.7950.4658
35rs62620225628117331T0.159119.987.84 × 10−60.04097 (0.005498–0.3054)ZKSCAN8C0.992, 0.8330.0025
36rs15456201917303774T0.35819.918.14 × 10−62.87 (1.796–4.586)MYO9BT0.615, 0.3620.0766
37rs75074421953278953A0.619319.888.24 × 10−60.3481 (0.2176–0.5567)ZNF600G0.638, 0.4290.083
38rs272794331897973T0.218419.848.44 × 10−60.1432 (0.05462–0.3752) C0.962, 0.7820.4488
39rs15077651207535246A0.579519.748.87 × 10−60.3463 (0.2155–0.5562)CD55C0.677, 0.4620.2045
40rs906998878530715T0.579519.748.87 × 10−60.3463 (0.2155–0.5562) C0.677, 0.4430.4206
41rs65425732120986872T0.386419.738.91 × 10−60.2888 (0.1641–0.508) C0.846, 0.6290.0841
42rs26333501916808183C0.414819.659.32 × 10−60.3033 (0.1765–0.521) T0.823, 0.6140.9978
43rs1012036752472450T0.366319.589.66 × 10−60.2781 (0.1547–0.4998)CDC14CC0.862, 0.6600.0124
CHR: chromosome; SNP ID: single nucleotide polymorphism ID; BP: base pair position at the respective chromosome as per GRCh37.p13; MA: minor allele name; MAF: frequency of minor allele in controls; CHISQ: basic allelic test chi-square; P: p-value; OR: odds ratio; SE: standard error; L95: lower bound of 95% confidence interval for odds ratio; U95: upper bound of 95% confidence interval for odds ratio. AA: associated allele; HWpval: p-value of Hardy–Weinberg equilibrium.
Table 2. Significant haplotypes of SNPs on chromosome 6 in autistic patients.
BlockHaplotypeFrequencyCase, Control Ratio CountsCase, Control FrequenciesChi-Squarep-value
Block 1AAGTCTGATT0.54797.0:33.0, 89.0:121.00.746, 0.42433.6186.71 × 10−9 **
CTTCGGATGC0.42130.0:100.0, 113.0:97.00.231, 0.53831.122.43 × 10−8 *
AAGTCTGTTC0.0243.0:127.0, 5.0:205.00.023, 0.0240.0020.9655
Block 2CG0.653102.0:28.0, 120.0:90.00.785, 0.57116.1046.00 × 10−5 **
AT0.34728.0:102.0, 90.0:120.00.215, 0.42916.1046.00 × 10−5 *
Block 3TA0.54188.0:42.0, 96.0:114.00.677, 0.45715.627.74 × 10−5 **
CG0.45942.0:88.0, 114.0:96.00.323, 0.54315.627.74 × 10−5 *
** Significant risk haplotypes associated with autistic patients. * Significant protective haplotypes associated with control subjects.
Table 3. List of the top 20 upregulated genes with fold changes ≥ 1.98, p-values ≤ 0.0025 and q-values ≤ 0.05.
GeneLocusFPKM ControlFPKM Caselog2 (Fold Change)p-valueq-valueEnsemble Gene IDGene Description
RPS126:132814568–132817564325.72218.212.767780.000050.004411ENSG00000112306ribosomal protein S12
HNRNPH2X:101390823–10141413379.14081227.643.955320.000050.004411ENSG00000126945heterogeneous nuclear ribonucleoprotein H2
KRT812:52897186–529529060.8343169.495033.508510.000050.004411ENSG00000170421keratin 8
RPL36AX:101390823–10141413379.14081227.643.955320.000050.004411ENSG00000241343ribosomal protein L36a
MTRNR2L811:10507893–105091864.3216253.7175.875510.000050.004411ENSG00000255823MT-RNR2 like 8
RPL36A-HNRNPH2X:101390823–10141413379.14081227.643.955320.000050.004411ENSG00000257529RPL36A-HNRNPH2 readthrough
RPL2617:8356901–838321388.4494682.8922.948730.000250.01343ENSG00000161970ribosomal protein L26
KRBA217:8356901–838321388.4494682.8922.948730.000250.01343ENSG00000184619KRAB-A domain containing 2
AC135178.317:8356901–838321388.4494682.8922.948730.000250.01343ENSG00000263809novel protein
DBI2:119366920–11937256019.242382.53862.100790.00040.017644ENSG00000155368diazepam binding inhibitor, acyl-CoA binding protein
PROM14:15960244–1608437829.4262128.0842.121920.00050.019545ENSG00000007062prominin 1
FGFBP24:15960244–1608437829.4262128.0842.121920.00050.019545ENSG00000137441fibroblast growth factor binding protein 2
PPDPF20:63520764–6352220643.8331377.2913.105590.00080.025989ENSG00000125534pancreatic progenitor cell differentiation and proliferation factor
IGHG314:105764502–10577140526.0445179.1762.782330.000850.027065ENSG00000211897immunoglobulin heavy constant gamma 3 (G3m marker)
CFD19:859663–86364157.7465285.7812.307110.001150.032814ENSG00000197766complement factor D
IMMP1L11:31369839–315096453.4071739.25173.526110.00150.038464ENSG00000148950inner mitochondrial membrane peptidase subunit 1
BAG19:33218364–3326472091.759363.231.984960.001550.039018ENSG00000107262BAG cochaperone 1
COX5B2:97646061–9764838331.6214128.2672.020180.001650.040067ENSG00000135940cytochrome c oxidase subunit 5B
PDZK1IP11:47183581–4719104441.5874174.3432.067710.00230.046077ENSG00000162366PDZK1 interacting protein 1
HBQ116:180458–18117925.0227198.7412.989580.002450.047885ENSG00000086506hemoglobin subunit theta 1
UQCRB8:96222946–9623914913.837799.62792.847950.00250.048566ENSG00000156467ubiquinol-cytochrome c reductase binding protein
Table 4. List of the top 20 downregulated genes with foldchange ≤−3.5, a p-value ≤ 0.00005 and a q-value ≤ 0.0044.
GeneLocusFPKM ControlFPKM Caselog2 (Fold Change)p-valueq-valueEnsemble Gene IDGene Description
MPO17:58269854–5828093574.29021.24471−5.899290.000050.0044ENSG00000005381myeloperoxidase
TMCC312:94567121–94650557377.3716.56036−5.846060.000050.0044ENSG00000057704transmembrane and coiled-coil domain family 3
CEACAM619:41708584–4178689310.1390.665306−3.929760.000050.0044ENSG00000086548CEA cell adhesion molecule 6
PLEKHG219:39412668–3942841565.414.86538−3.748890.000050.0044ENSG00000090924pleckstrin homology and RhoGEF domain containing G2
CEACAM519:41708584–4178689310.1390.665306−3.929760.000050.0044ENSG00000105388CEA cell adhesion molecule 5
GRB107:50590062–5079346210.53630.725095−3.861060.000050.0044ENSG00000106070growth factor receptor bound protein 10
DDX517:64498253–646623074447.04280.637−3.986070.000050.0044ENSG00000108654DEAD-box helicase 5
CARS111:3000921–3064707210.9915.4503−3.771470.000050.0044ENSG00000110619cysteinyl-tRNA synthetase 1
MMP811:102711795–10272705025.78280.665084−5.276730.000050.0044ENSG00000118113matrix metallopeptidase 8
AKAP117:57085091–5712134653.89284.44175−3.600890.000050.0044ENSG00000121057A-kinase anchoring protein 1
TMCC21:205227945–20528563296.97665.46508−4.149320.000050.0044ENSG00000133069transmembrane and coiled-coil domain family 2
CA18:85327607–85481493521.48911.6803−5.480490.000050.0044ENSG00000133742carbonic anhydrase 1
ACE17:63477060–635218487.073340.510574−3.79220.000050.0044ENSG00000159640angiotensin I converting enzyme
ELF31:201982371–2020171839.770110.261935−5.221090.000050.0044ENSG00000163435E74 like ETS transcription factor 3
YPEL411:57638023–5766186515.11770.851345−4.150350.000050.0044ENSG00000166793yippee like 4
OLR112:10158300–101918016.430250.410073−3.970920.000050.0044ENSG00000173391oxidized low-density lipoprotein receptor 1
POLE12:132623752–13268737646.54354.11377−3.500050.000050.0044ENSG00000177084DNA polymerase epsilon, catalytic subunit
DDX415:177511576–177516961597.04227.017−4.465890.000050.0044ENSG00000183258DEAD-box helicase 41
AC113554.117:63477060–635218487.073340.510574−3.79220.000050.0044ENSG00000264813novel protein
AC243967.119:41708584–4178689310.1390.665306−3.929760.000050.0044ENSG00000267881novel protein, readthrough between CEACAM5-CEACAM6
Table 5. Associated KEGG pathway enrichments of the significantly up- and downregulated genes.
KEGG Pathway IDTerm DescriptionOGCBGCStrengthFalse Discovery RateMatching Proteins in Your Network (Labels)
Upregulated genes
hsa03010Ribosome171301.373.53E-16RPS12, RPL35, RSL24D1, RPL13, RPL7, RPL21, RPS27, RPL11, RPL24, RPL34, RPL36A, RPS24, RPL29, RPL35A, RPL23, RPL26, RPS15
hsa00190Oxidative phosphorylation61310.910.0041COX5B, ATP5G3, ATP6V1G1, ATP5G2, NDUFA11, UQCRB
hsa03060Protein export3231.370.0093SRP14, IMMP1L, SEC61G
hsa05012Parkinson’s disease51420.80.0242COX5B, ATP5G3, ATP5G2, NDUFA11, UQCRB
hsa05010Alzheimer’s disease51680.730.0394COX5B, ATP5G3, ATP5G2, NDUFA11, UQCRB
Downregulated genes
hsa04066HIF-1 signaling pathway9980.760.0115CREBBP, IGF1R, ARNT, TFRC, MKNK1, AKT2, SLC2A1, LDHA, VEGFA
hsa00620Pyruvate metabolism5390.910.0243ACSS2, ACACB, ALDH3A2, LDHA, ACACA
hsa00640Propanoate metabolism5320.990.0243ACSS2, ACACB, HIBCH, LDHA, ACACA
hsa01100Metabolic pathways3712500.270.0243EXTL3, CYP27B1,GCLC, ACSS2, ACLY, AMPD2, POMT2,ATP6V0A1, CAD, POLG, AMT, ACAD8, GLB1, SGSH, POLE, GANC, DGKA, ALAS2, PLA2G6, ACACB, PFKM, ALDH3A2, PIGN, DNMT1, HIBCH, PHGDH, ACSL6, BPGM, AMPD3, MTMR3, EARS2, PGM3, LDHA, MAN2A2, ALOX15, POLR2A, ACACA
hsa04015Rap1 signaling pathway112030.530.0243SIPA1L3, FARP2, RAPGEF2, IGF1R, SRC, AKT2, ADCY7, RASGRP3, FGFR1, DOCK4, VEGFA
hsa04152AMPK signaling pathway91200.670.0243TSC2, PFKFB4, IGF1R, TSC1, ACACB, PFKM, CRTC2, AKT2, ACACA
hsa04922Glucagon signaling pathway81000.70.0243CREBBP, ACACB, CRTC2, ITPR2, AKT2, SLC2A1, LDHA, ACACA
hsa05205Proteoglycans in cancer111950.550.0243DDX5, GAB1, IGF1R, ANK3, PTCH1, SRC, ITPR2, AKT2, FGFR1, PPP1R12B, VEGFA
hsa05211Renal cell carcinoma6680.740.0289CREBBP, GAB1, ARNT, AKT2, SLC2A1, VEGFA
hsa00061Fatty acid biosynthesis3121.20.0368ACACB, ACSL6, ACACA
hsa04910Insulin signaling pathway81340.570.0401TSC2, INPPL1, TSC1, ACACB, MKNK1, AKT2, IKBKB, ACACA
hsa01521EGFR tyrosine kinase inhibitor resistance6780.680.0417GAB1, IGF1R, SRC, AKT2, NRG1, VEGFA
BGC: background gene count; OGC: observed gene count.
Table 6. Clinical characteristics of patients with autism and controls from Eastern Province, Saudi Arabia.
ParameterControl Group n = 132Autism Group n = 70p-value
Age (year)8.04 ± 3.017.56 ± 3.680.1955
GenderF = 71; M = 61F = 23; M = 47-
Weight (kg)30.34 ± 13.3626.40 ± 12.040.0582
Height (cm)121.59 ± 22.01121.68 ± 21.580.4913
Body mass index19.93 ± 4.5316.80 ± 1.78<0.00001 *
The data are presented as the mean values ± standard deviations. * p ≤ 0.05 was considered statistically significant.
Publisher’s Note: MDPI stays neutral with regard to jurisdictional claims in published maps and institutional affiliations.

