The Association between Tear Film Thickness as Measured with OCT and Symptoms and Signs of Dry Eye Disease: A Pooled Analysis of 6 Clinical Trials

 , ,
, ,
Abstract
:1. Introduction
2. Material and Methods
2.1. Patients
2.2. Methods
2.2.1. Ocular Surface Disease Index (OSDI)
2.2.2. Tear Film Thickness Using OCT
2.2.3. Tear Film Break up Time (TFBUT)
2.2.4. Schirmer I Test
2.3. Data Analysis
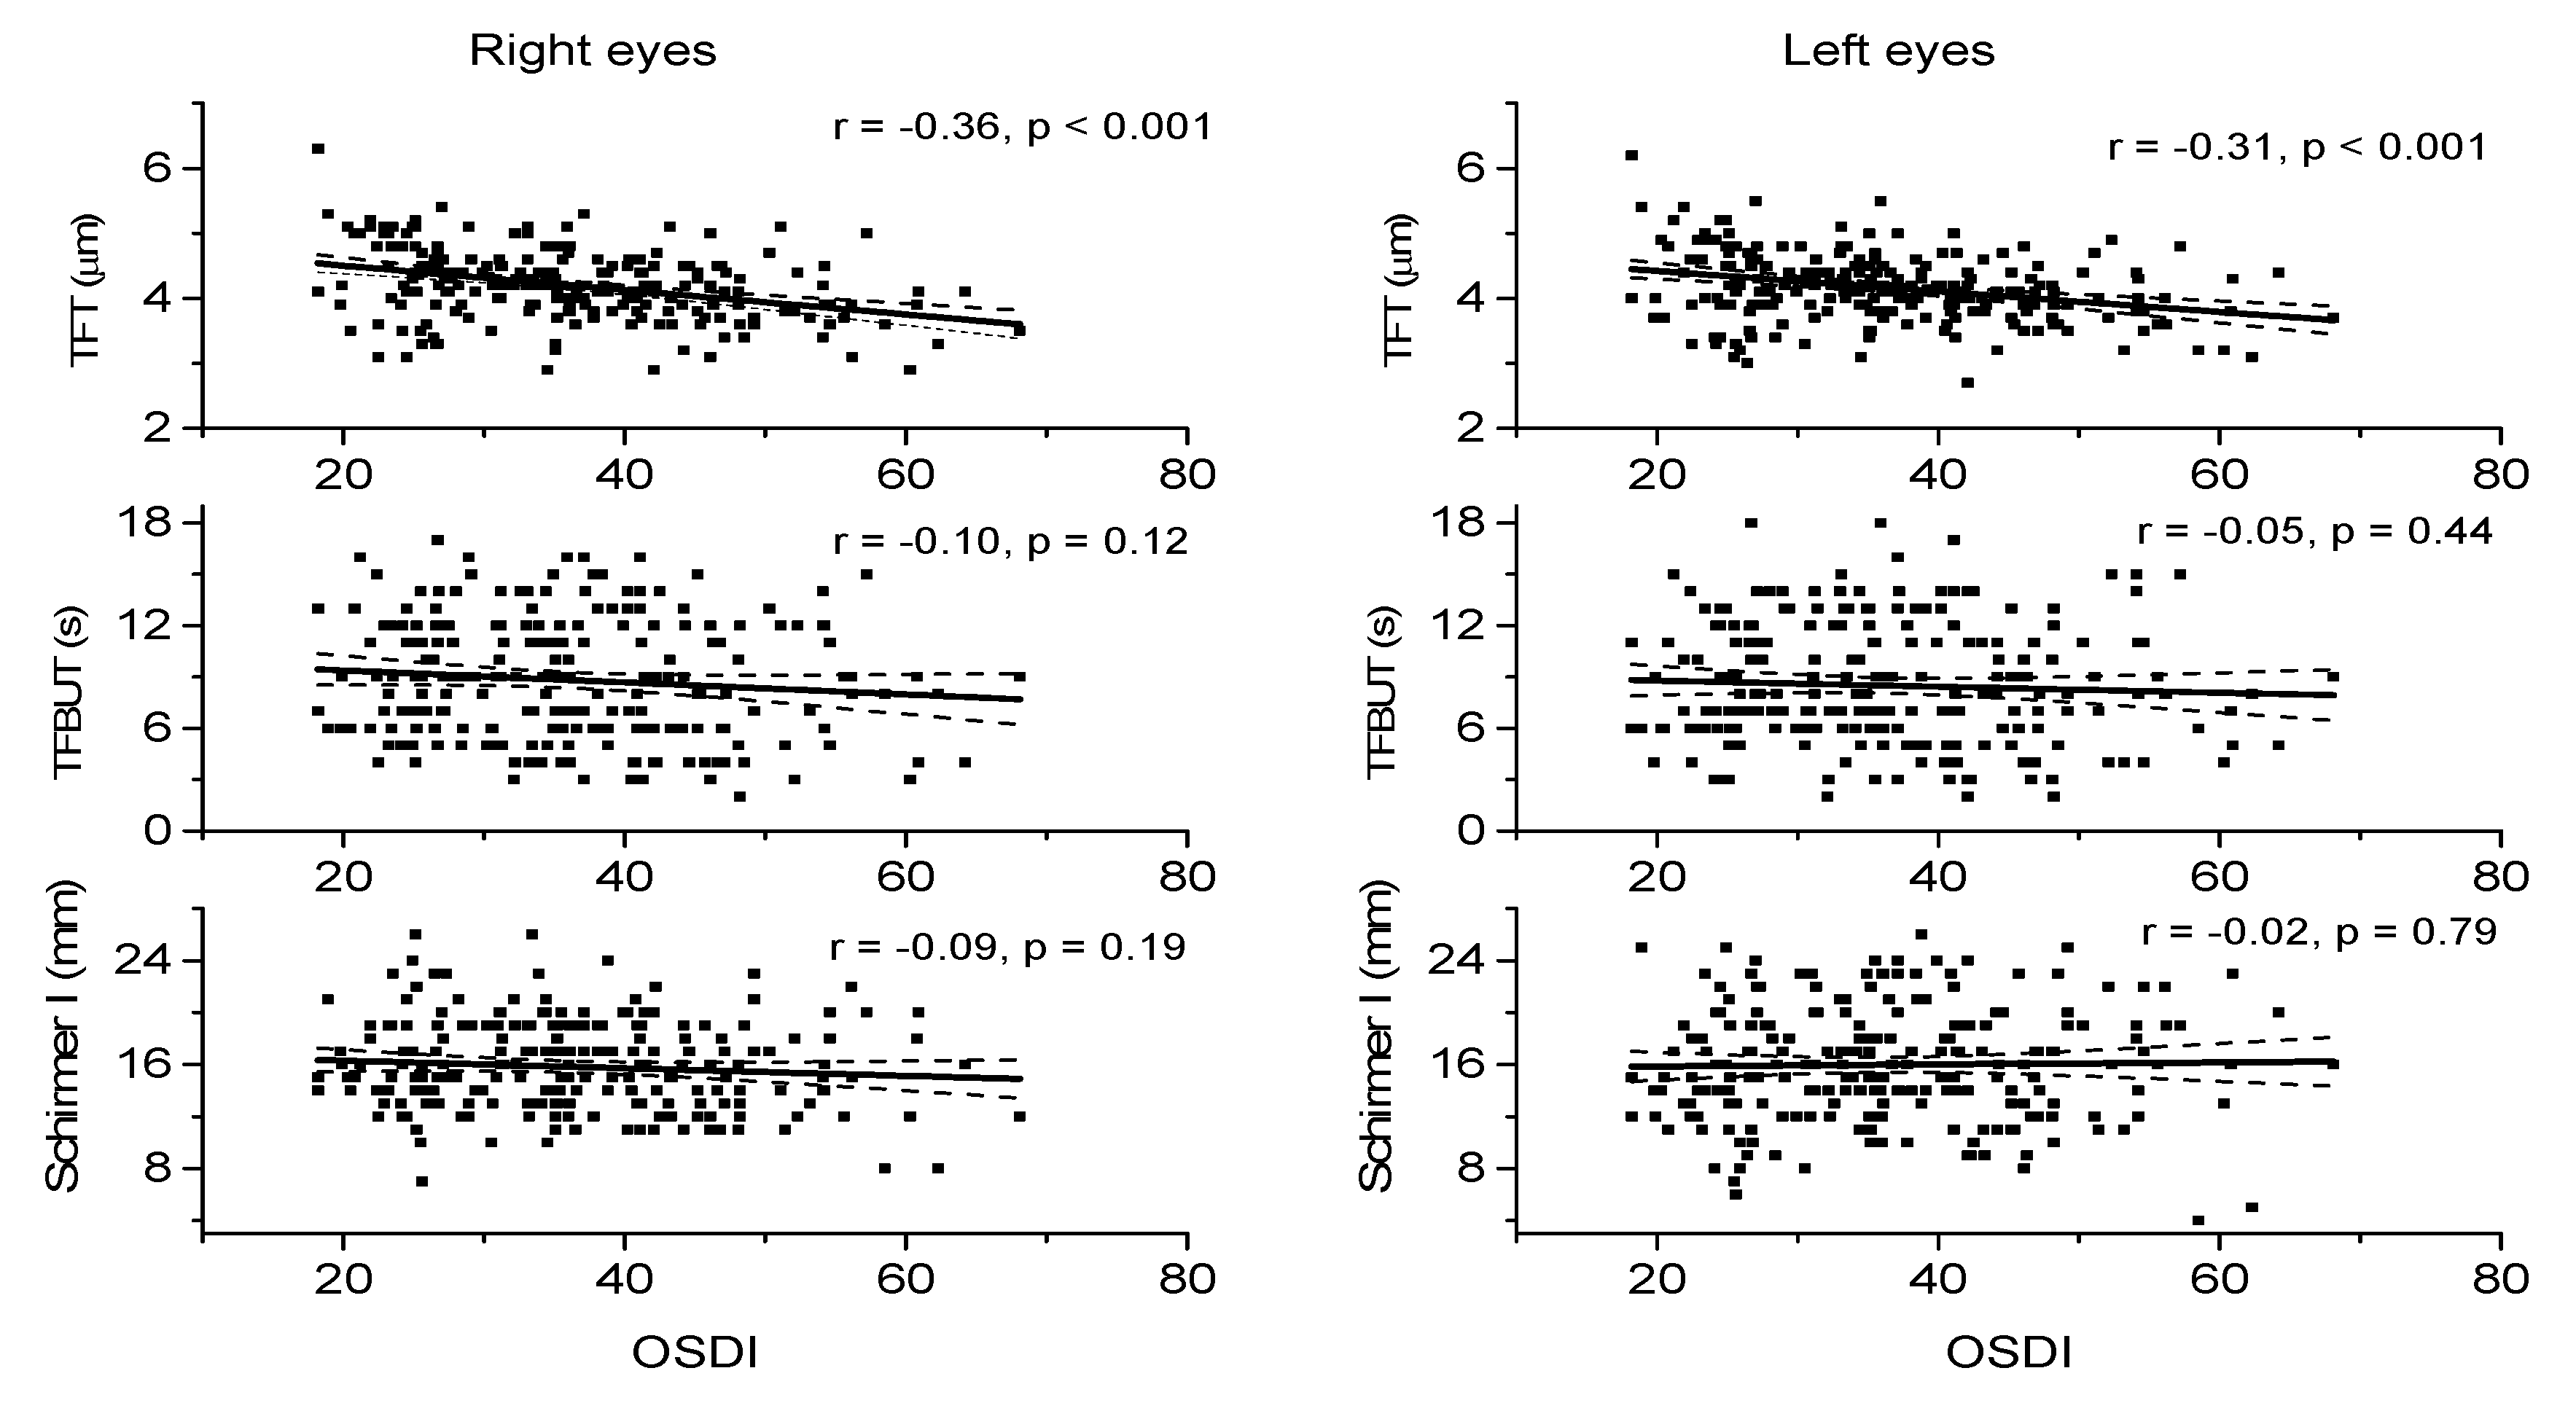
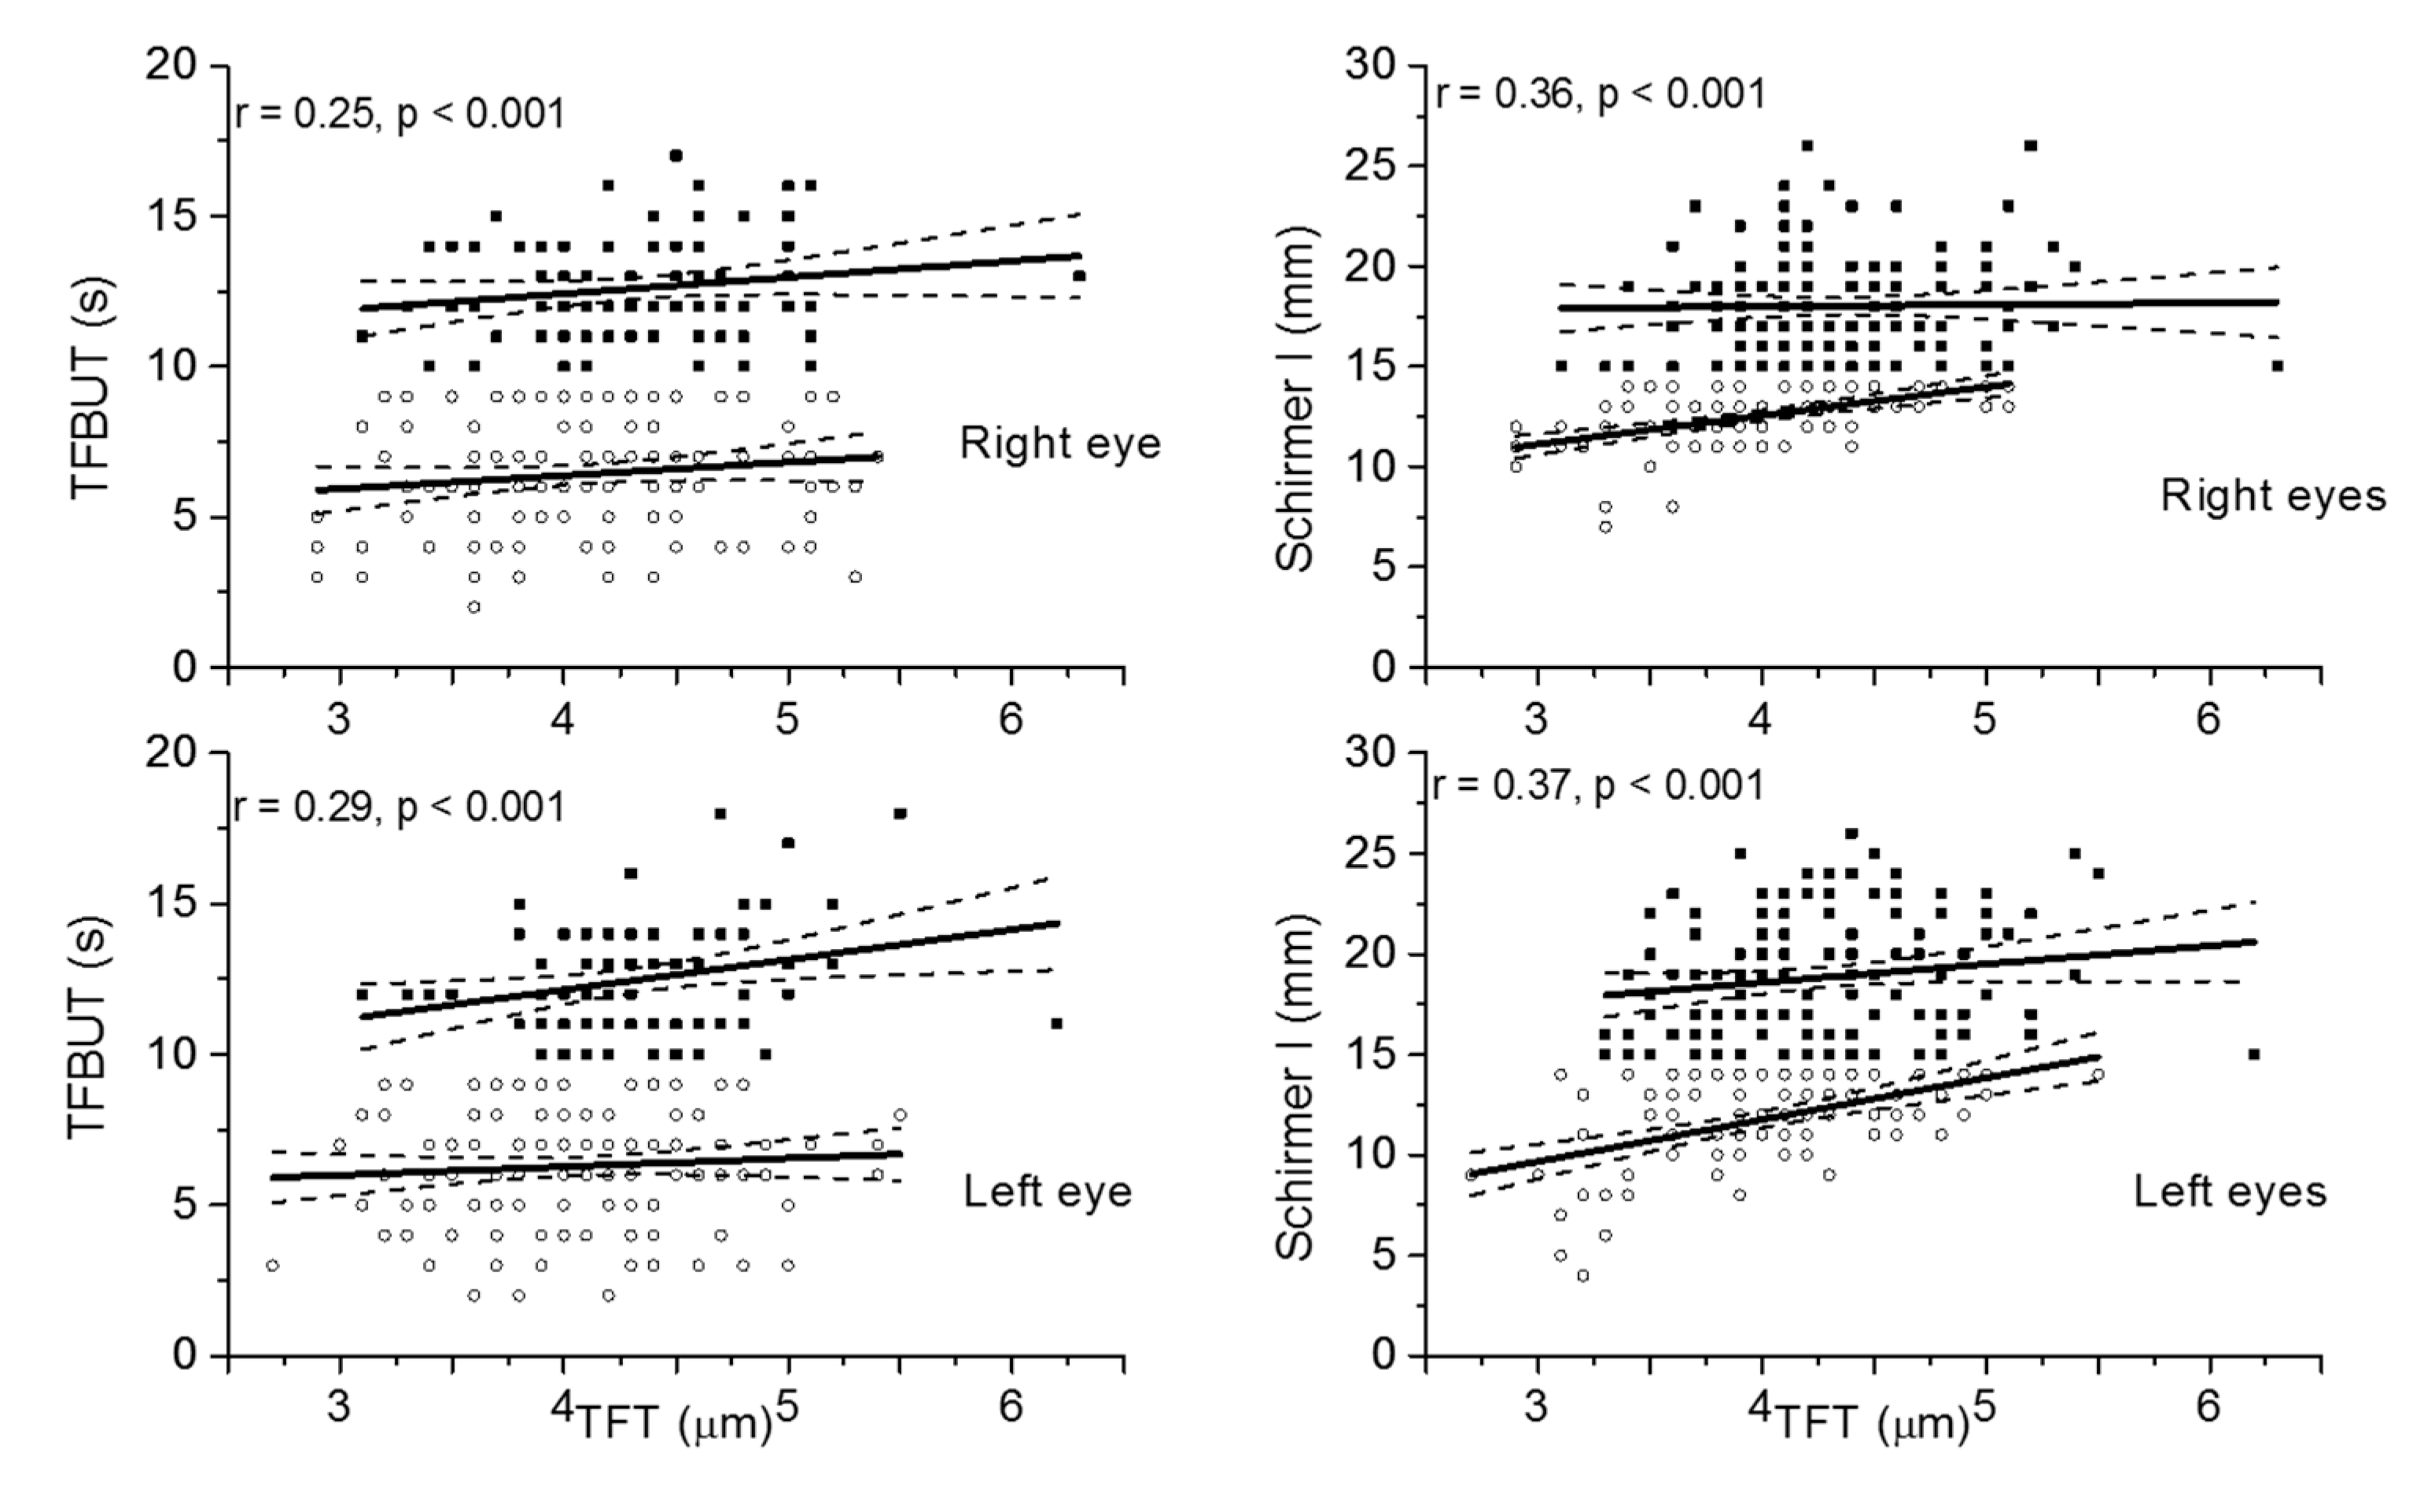
3. Results
4. Discussion
Supplementary Materials
Author Contributions
Funding
Conflicts of Interest
References
- Braun, R.J.; King-Smith, P.E.; Begley, C.G.; Li, L.; Gewecke, N.R. Dynamics and function of the tear film in relation to the blink cycle. Prog. Retin. Eye Res. 2015, 45, 132–164. [Google Scholar] [CrossRef] [PubMed] [Green Version]
- Tsubota, K.; Yokoi, N.; Shimazaki, J.; Watanabe, H.; Dogru, M.; Yamada, M.; Kinoshita, S.; Kim, H.M.; Tchah, H.W.; Hyon, J.Y.; et al. New Perspectives on Dry Eye Definition and Diagnosis: A Consensus Report by the Asia Dry Eye Society. Ocul. Surf. 2017, 15, 65–76. [Google Scholar] [CrossRef] [PubMed]
- Willcox, M.D.P.; Argüeso, P.; Georgiev, G.A.; Holopainen, J.M.; Laurie, G.W.; Millar, T.J.; Papas, E.B.; Rolland, J.P.; Schmidt, T.A.; Stahl, U.; et al. TFOS DEWS II Tear Film Report. Ocul. Surf. 2017, 15, 366–403. [Google Scholar] [CrossRef] [PubMed] [Green Version]
- Craig, J.P.; Nichols, K.K.; Akpek, E.K.; Caffery, B.; Dua, H.S.; Joo, C.K.; Liu, Z.; Nelson, J.D.; Nichols, J.J.; Tsubota, K.; et al. TFOS DEWS II Definition and Classification Report. Ocul. Surf. 2017, 15, 276–283. [Google Scholar] [CrossRef] [PubMed]
- Nichols, K.K.; Nichols, J.J.; Mitchell, G.L. The lack of association between signs and symptoms in patients with dry eye disease. Cornea 2004, 23, 762–770. [Google Scholar] [CrossRef]
- Pult, H.; Purslow, C.; Murphy, P.J. The relationship between clinical signs and dry eye symptoms. Eye (Lond.) 2011, 25, 502–510. [Google Scholar] [CrossRef]
- Cuevas, M.; González-García, M.J.; Castellanos, E.; Quispaya, R.; Parra, P.d.L.; Fernández, I.; Calonge, M. Correlations among symptoms, signs, and clinical tests in evaporative-type dry eye disease caused by Meibomian gland dysfunction (MGD). Curr. Eye Res. 2012, 37, 855–863. [Google Scholar] [CrossRef]
- Sullivan, B.D.; Crews, L.A.; Messmer, E.M.; Foulks, G.N.; Nichols, K.K.; Baenninger, P.; Geerling, G.; Figueiredo, F.; Lemp, M.A. Correlations between commonly used objective signs and symptoms for the diagnosis of dry eye disease: Clinical implications. Acta Ophthalmol. 2014, 92, 161–166. [Google Scholar] [CrossRef]
- Song, H.; Zhang, M.; Hu, X.; Li, K.; Jiang, X.; Liu, Y.; Lv, H.; Li, X. Correlation Analysis of Ocular Symptoms and Signs in Patients with Dry Eye. J. Ophthalmol. 2017, 2017, 1247138. [Google Scholar] [CrossRef] [Green Version]
- Wolffsohn, J.S.; Arita, R.; Chalmers, R.; Djalilian, A.; Dogru, M.; Dumbleton, K.; Gupta, P.K.; Karpecki, P.; Lazreg, S.; Pult, H.; et al. TFOS DEWS II Diagnostic Methodology report. Ocul. Surf. 2017, 15, 539–574. [Google Scholar] [CrossRef]
- Bai, Y.; Nichols, J.J. Advances in thickness measurements and dynamic visualization of the tear film using non-invasive optical approaches. Prog. Retin. Eye Res. 2017, 58, 28–44. [Google Scholar] [CrossRef] [PubMed]
- Segev, F.; Geffen, N.; Galor, A.; Cohen, Y.; Gefen, R.; Belkin, A.; Arieli, Y.; Epshtein, S.; Oren, A.; Harris, A. Dynamic assessment of the tear film muco-aqueous and lipid layers using a novel tear film imager (TFI). Br. J. Ophthalmol. 2020, 104, 136–141. [Google Scholar] [CrossRef] [PubMed]
- King-Smith, P.E.; Fink, B.A.; Fogt, N. Three interferometric methods for measuring the thickness of layers of the tear film. Optom. Vis. Sci. 1999, 76, 19–32. [Google Scholar] [CrossRef] [PubMed]
- Szczesna-Iskander, D.H.; Iskander, D.R. Future directions in non-invasive measurements of tear film surface kinetics. Optom. Vis. Sci. 2012, 89, 749–759. [Google Scholar] [CrossRef]
- Tan, L.L.; Sanjay, S.; Morgan, P.B. Static and Dynamic Measurement of Ocular Surface Temperature in Dry Eyes. J. Ophthalmol. 2016, 2016, 7285132. [Google Scholar] [CrossRef] [Green Version]
- King-Smith, P.E.; Begley, C.G.; Braun, R.J. Mechanisms, imaging and structure of tear film breakup. Ocul. Surf. 2018, 16, 4–30. [Google Scholar] [CrossRef]
- Napoli, P.E.; Nioi, M.; Mangoni, L.; Gentile, P.; Braghiroli, M.; d’Aloja, E.; Fossarello, M. Fourier-Domain OCT Imaging of the Ocular Surface and Tear Film Dynamics: A Review of the State of the Art and an Integrative Model of the Tear Behavior During the Inter-Blink Period and Visual Fixation. J. Clin. Med. 2020, 9, 668. [Google Scholar] [CrossRef] [Green Version]
- Han, S.B.; Liu, Y.C.; Mohamed-Noriega, K.; Tong, L.; Mehta, J.S. Objective Imaging Diagnostics for Dry Eye Disease. J. Ophthalmol. 2020, 2020, 3509064. [Google Scholar] [CrossRef]
- Ang, M.; Baskaran, M.; Werkmeister, R.M.; Chua, J.; Schmidl, D.; Aranha Dos Santos, V.; Garhöfer, G.; Mehta, J.S.; Schmetterer, L. Anterior segment optical coherence tomography. Prog. Retin. Eye Res. 2018, 66, 132–156. [Google Scholar] [CrossRef]
- Werkmeister, R.M.; Alex, A.; Kaya, S.; Unterhuber, A.; Hofer, B.; Riedl, J.; Bronhagl, M.; Vietauer, M.; Schmidl, D.; Schmoll, T.; et al. Measurement of tear film thickness using ultrahigh-resolution optical coherence tomography. Investig. Ophthalmol. Vis. Sci. 2013, 54, 5578–5583. [Google Scholar] [CrossRef]
- Chen, Q.; Wang, J.; Tao, A.; Shen, M.; Jiao, S.; Lu, F. Ultrahigh-resolution measurement by optical coherence tomography of dynamic tear film changes on contact lenses. Investig. Ophthalmol. Vis. Sci. 2010, 51, 1988–1993. [Google Scholar] [CrossRef] [PubMed]
- Yadav, R.; Lee, K.S.; Rolland, J.P.; Zavislan, J.M.; Aquavella, J.V.; Yoon, G. Micrometer axial resolution OCT for corneal imaging. Biomed. Opt. Express 2011, 2, 3037–3046. [Google Scholar] [CrossRef] [PubMed] [Green Version]
- Schmidl, D.; Witkowska, K.J.; Kaya, S.; Baar, C.; Faatz, H.; Nepp, J.; Unterhuber, A.; Werkmeister, R.M.; Garhofer, G.; Schmetterer, L. The association between subjective and objective parameters for the assessment of dry-eye syndrome. Investig. Ophthalmol. Vis. Sci. 2015, 56, 1467–1472. [Google Scholar] [CrossRef] [PubMed] [Green Version]
- Schmidl, D.; Werkmeister, R.; Kaya, S.; Unterhuber, A.; Witkowska, K.J.; Baumgartner, R.; Höller, S.; O’Rourke, M.; Peterson, W.; Wolter, A.; et al. A Controlled, Randomized Double-Blind Study to Evaluate the Safety and Efficacy of Chitosan-N-Acetylcysteine for the Treatment of Dry Eye Syndrome. J. Ocul. Pharmacol. Ther. 2017, 33, 375–382. [Google Scholar] [CrossRef]
- Szegedi, S.; Scheschy, U.; Schmidl, D.; Aranha Dos Santos, V.; Stegmann, H.; Adzhemian, N.; Fondi, K.; Bata, A.M.; Werkmeister, R.M.; Couderc, C.; et al. Effect of Single Instillation of Two Hyaluronic Acid-Based Topical Lubricants on Tear Film Thickness in Patients with Dry Eye Syndrome. J. Ocul. Pharmacol. Ther. 2018, 34, 605–611. [Google Scholar] [CrossRef]
- Schmidl, D.; Schmetterer, L.; Witkowska, K.J.; Unterhuber, A.; dos Santos, V.A.; Kaya, S.; Nepp, J.; Baar, C.; Rosner, P.; Werkmeister, R.M.; et al. Tear film thickness after treatment with artificial tears in patients with moderate dry eye disease. Cornea 2015, 34, 421–426. [Google Scholar] [CrossRef]
- Wozniak, P.A.; Schmidl, D.; Bata, A.M.; Fondi, K.; Witkowska, K.J.; Aranha Dos Santos, V.; Baar, C.; Room, K.I.; Nepp, J.; Baumgartner, I.; et al. Effect of different lubricant eye gels on tear film thickness as measured with ultrahigh-resolution optical coherence tomography. Acta Ophthalmol. 2017, 95, e307–e313. [Google Scholar] [CrossRef]
- Schmidl, D.; Bata, A.M.; Szegedi, S.; Aranha Dos Santos, V.; Stegmann, H.; Fondi, K.; Krösser, S.; Werkmeister, R.M.; Schmetterer, L.; Garhöfer, G. Influence of Perfluorohexyloctane Eye Drops on Tear Film Thickness in Patients with Mild to Moderate Dry Eye Disease: A Randomized Controlled Clinical Trial. J. Ocul. Pharmacol. Ther. 2020, 36, 154–161. [Google Scholar] [CrossRef]
- Schiffman, R.M.; Christianson, M.D.; Jacobsen, G.; Hirsch, J.D.; Reis, B.L. Reliability and validity of the Ocular Surface Disease Index. Arch. Ophthalmol. 2000, 118, 615–621. [Google Scholar] [CrossRef]
- Mizuno, Y.; Yamada, M.; Miyake, Y. Association between clinical diagnostic tests and health-related quality of life surveys in patients with dry eye syndrome. Jpn. J. Ophthalmol. 2010, 54, 259–265. [Google Scholar] [CrossRef]
- Bjerrum, K.B. Test and symptoms in keratoconjunctivitis sicca and their correlation. Acta Ophthalmol. Scand. 1996, 74, 436–441. [Google Scholar] [CrossRef] [PubMed]
- Foulks, G.N.; Forstot, S.L.; Donshik, P.C.; Forstot, J.Z.; Goldstein, M.H.; Lemp, M.A.; Nelson, J.D.; Nichols, K.K.; Pflugfelder, S.C.; Tanzer, J.M.; et al. Clinical guidelines for management of dry eye associated with Sjögren disease. Ocul. Surf. 2015, 13, 118–132. [Google Scholar] [CrossRef] [PubMed]
- Cho, P.; Yap, M. Schirmer test. I. A review. Optom. Vis. Sci. 1993, 70, 152–156. [Google Scholar] [CrossRef] [PubMed]
- Elliott, M.; Fandrich, H.; Simpson, T.; Fonn, D. Analysis of the repeatability of tear break-up time measurement techniques on asymptomatic subjects before, during and after contact lens wear. Cont. Lens Anterior Eye 1998, 21, 98–103. [Google Scholar] [CrossRef]
- Korb, D.R.; Greiner, J.V.; Herman, J. Comparison of fluorescein break-up time measurement reproducibility using standard fluorescein strips versus the Dry Eye Test (DET) method. Cornea 2001, 20, 811–815. [Google Scholar] [CrossRef]
- Tung, C.I.; Perin, A.F.; Gumus, K.; Pflugfelder, S.C. Tear meniscus dimensions in tear dysfunction and their correlation with clinical parameters. Am. J. Ophthalmol. 2014, 157, 301–310.e1. [Google Scholar] [CrossRef] [Green Version]
- Lee, R.; Yeo, S.; Aung, H.T.; Tong, L. Agreement of noninvasive tear break-up time measurement between Tomey RT-7000 Auto Refractor-Keratometer and Oculus Keratograph 5M. Clin. Ophthalmol. 2016, 10, 1785–1790. [Google Scholar] [CrossRef] [Green Version]
- Arita, R.; Morishige, N.; Fujii, T.; Fukuoka, S.; Chung, J.L.; Seo, K.Y.; Itoh, K. Tear Interferometric Patterns Reflect Clinical Tear Dynamics in Dry Eye Patients. Investig. Ophthalmol. Vis. Sci. 2016, 57, 3928–3934. [Google Scholar] [CrossRef] [Green Version]
- Garaszczuk, I.K.; Montes Mico, R.; Iskander, D.R.; Expósito, A.C. The tear turnover and tear clearance tests—A review. Expert Rev. Med. Devices 2018, 15, 219–229. [Google Scholar] [CrossRef]
- Fernández, J.; Rodríguez-Vallejo, M.; Martínez, J.; Tauste, A.; García-Montesinos, J.; Piñero, D.P. Agreement and repeatability of objective systems for assessment of the tear film. Graefes Arch. Clin. Exp. Ophthalmol. 2018, 256, 1535–1541. [Google Scholar] [CrossRef] [Green Version]
- Szczesna-Iskander, D.H. Post-blink tear film dynamics in healthy and dry eyes during spontaneous blinking. Ocul. Surf. 2018, 16, 93–100. [Google Scholar] [CrossRef]
- Aranha Dos Santos, V.; Schmetterer, L.; Gröschl, M.; Garhofer, G.; Schmidl, D.; Kucera, M.; Unterhuber, A.; Hermand, J.P.; Werkmeister, R.M. In vivo tear film thickness measurement and tear film dynamics visualization using spectral domain optical coherence tomography. Opt. Express 2015, 23, 21043–21063. [Google Scholar] [CrossRef] [PubMed]
- Huang, J.; Hindman, H.B.; Rolland, J.P. In vivo thickness dynamics measurement of tear film lipid and aqueous layers with optical coherence tomography and maximum-likelihood estimation. Opt. Lett. 2016, 41, 1981–1984. [Google Scholar] [CrossRef] [PubMed]
- Dos Santos, V.A.; Schmetterer, L.; Triggs, G.J.; Leitgeb, R.A.; Gröschl, M.; Messner, A.; Schmidl, D.; Garhofer, G.; Aschinger, G.; Werkmeister, R.M. Super-resolved thickness maps of thin film phantoms and in vivo visualization of tear film lipid layer using OCT. Biomed. Opt. Express 2016, 7, 2650–2670. [Google Scholar] [CrossRef] [PubMed] [Green Version]
- Liu, N.N.; Liu, L.; Li, J.; Sun, Y.Z. Prevalence of and risk factors for dry eye symptom in mainland china: A systematic review and meta-analysis. J. Ophthalmol. 2014, 2014, 748654. [Google Scholar] [CrossRef] [PubMed]
- Ahn, J.M.; Lee, S.H.; Rim, T.H.; Park, R.J.; Yang, H.S.; Kim, T.I.; Yoon, K.C.; Seo, K.Y. Prevalence of and risk factors associated with dry eye: The Korea National Health and Nutrition Examination Survey 2010–2011. Am. J. Ophthalmol. 2014, 158, 1205–1214.e7. [Google Scholar] [CrossRef] [PubMed]
- Huang, J.; Lee, K.S.; Clarkson, E.; Kupinski, M.; Maki, K.L.; Ross, D.S.; Aquavella, J.V.; Rolland, J.P. Phantom study of tear film dynamics with optical coherence tomography and maximum-likelihood estimation. Opt. Lett. 2013, 38, 1721–1723. [Google Scholar] [CrossRef] [Green Version]
- Ueda, K.; Kanamori, A.; Akashi, A.; Kawaka, Y.; Yamada, Y.; Nakamura, M. Difference in correspondence between visual field defect and inner macular layer thickness measured using three types of spectral-domain OCT instruments. Jpn. J. Ophthalmol. 2015, 59, 55–64. [Google Scholar] [CrossRef]
- Mwanza, J.C.; Kim, H.Y.; Budenz, D.L.; Warren, J.L.; Margolis, M.; Lawrence, S.D.; Jani, P.D.; Thompson, G.S.; Lee, R.K. Residual and Dynamic Range of Retinal Nerve Fiber Layer Thickness in Glaucoma: Comparison of Three OCT Platforms. Investig. Ophthalmol. Vis. Sci. 2015, 56, 6344–6351. [Google Scholar] [CrossRef]
- Brandao, L.M.; Ledolter, A.A.; Schötzau, A.; Palmowski-Wolfe, A.M. Comparison of Two Different OCT Systems: Retina Layer Segmentation and Impact on Structure-Function Analysis in Glaucoma. J. Ophthalmol. 2016, 2016, 8307639. [Google Scholar] [CrossRef] [Green Version]
- Sander, B.; Al-Abiji, H.A.; Kofod, M.; Jørgensen, T.M. Do different spectral domain OCT hardwares measure the same? Comparison of retinal thickness using third-party software. Graefes Arch. Clin. Exp. Ophthalmol. 2015, 253, 1915–1921. [Google Scholar] [CrossRef] [PubMed] [Green Version]
- Napoli, P.E.; Nioi, M.; d’Aloja, E.; Fossarello, M. The Bull’s Eye Pattern of the Tear Film in Humans during Visual Fixation on En-Face Optical Coherence Tomography. Sci Rep. 2019, 9, 1413. [Google Scholar] [CrossRef] [PubMed]
- Napoli, P.E.; Satta, G.M.; Coronella, F.; Fossarello, M. Spectral-domain optical coherence tomography study on dynamic changes of human tears after instillation of artificial tears. Investig. Ophthalmol. Vis. Sci. 2014, 55, 4533–4540. [Google Scholar] [CrossRef] [PubMed] [Green Version]


| Parameter | Right Eyes | Left Eyes | p-Value |
|---|---|---|---|
| TFT (µm) | 4.2 ± 0.5 | 4.2 ± 0.5 | 0.57 |
| TFBUT (seconds) | 8.8 ± 3.5 | 8.5 ± 3.5 | 0.31 |
| Schirmer I (mm) | 15.8 ± 3.4 | 16.0 ± 4.4 | 0.48 |
| TFT | ||||||
|---|---|---|---|---|---|---|
| Right Eyes | Left Eyes | |||||
| Regression Slope | r-Value | p-Value | Regression Slope | r-Value | p-Value | |
| TFBUT | ||||||
| All values | 1.62 | 0.25 | <0.001 | 1.92 | 0.29 | <0.001 |
| Normal values | 0.54 | 0.17 | 0.12 | 1.00 | 0.27 | 0.02 |
| Abnormal values | 0.44 | 0.13 | 0.14 | 0.28 | 0.08 | 0.34 |
| Schirmer I | ||||||
| All values | 2.30 | 0.36 | <0.001 | 3.01 | 0.37 | <0.001 |
| Normal values | 0.09 | 0.02 | 0.85 | 0.91 | 0.16 | 0.07 |
| Abnormal values | 1.43 | 0.54 | <0.001 | 2.08 | 0.50 | <0.001 |
Publisher’s Note: MDPI stays neutral with regard to jurisdictional claims in published maps and institutional affiliations. |
© 2020 by the authors. Licensee MDPI, Basel, Switzerland. This article is an open access article distributed under the terms and conditions of the Creative Commons Attribution (CC BY) license (http://creativecommons.org/licenses/by/4.0/).
Share and Cite
Garhöfer, G.; Dos Santos, V.A.; Stegmann, H.; Schmidl, D.; Adzhemian, N.; Werkmeister, R.M.; Schmetterer, L. The Association between Tear Film Thickness as Measured with OCT and Symptoms and Signs of Dry Eye Disease: A Pooled Analysis of 6 Clinical Trials. J. Clin. Med. 2020, 9, 3791. https://doi.org/10.3390/jcm9113791
Garhöfer G, Dos Santos VA, Stegmann H, Schmidl D, Adzhemian N, Werkmeister RM, Schmetterer L. The Association between Tear Film Thickness as Measured with OCT and Symptoms and Signs of Dry Eye Disease: A Pooled Analysis of 6 Clinical Trials. Journal of Clinical Medicine. 2020; 9(11):3791. https://doi.org/10.3390/jcm9113791
Chicago/Turabian StyleGarhöfer, Gerhard, Valentin Aranha Dos Santos, Hannes Stegmann, Doreen Schmidl, Narine Adzhemian, René M. Werkmeister, and Leopold Schmetterer. 2020. "The Association between Tear Film Thickness as Measured with OCT and Symptoms and Signs of Dry Eye Disease: A Pooled Analysis of 6 Clinical Trials" Journal of Clinical Medicine 9, no. 11: 3791. https://doi.org/10.3390/jcm9113791