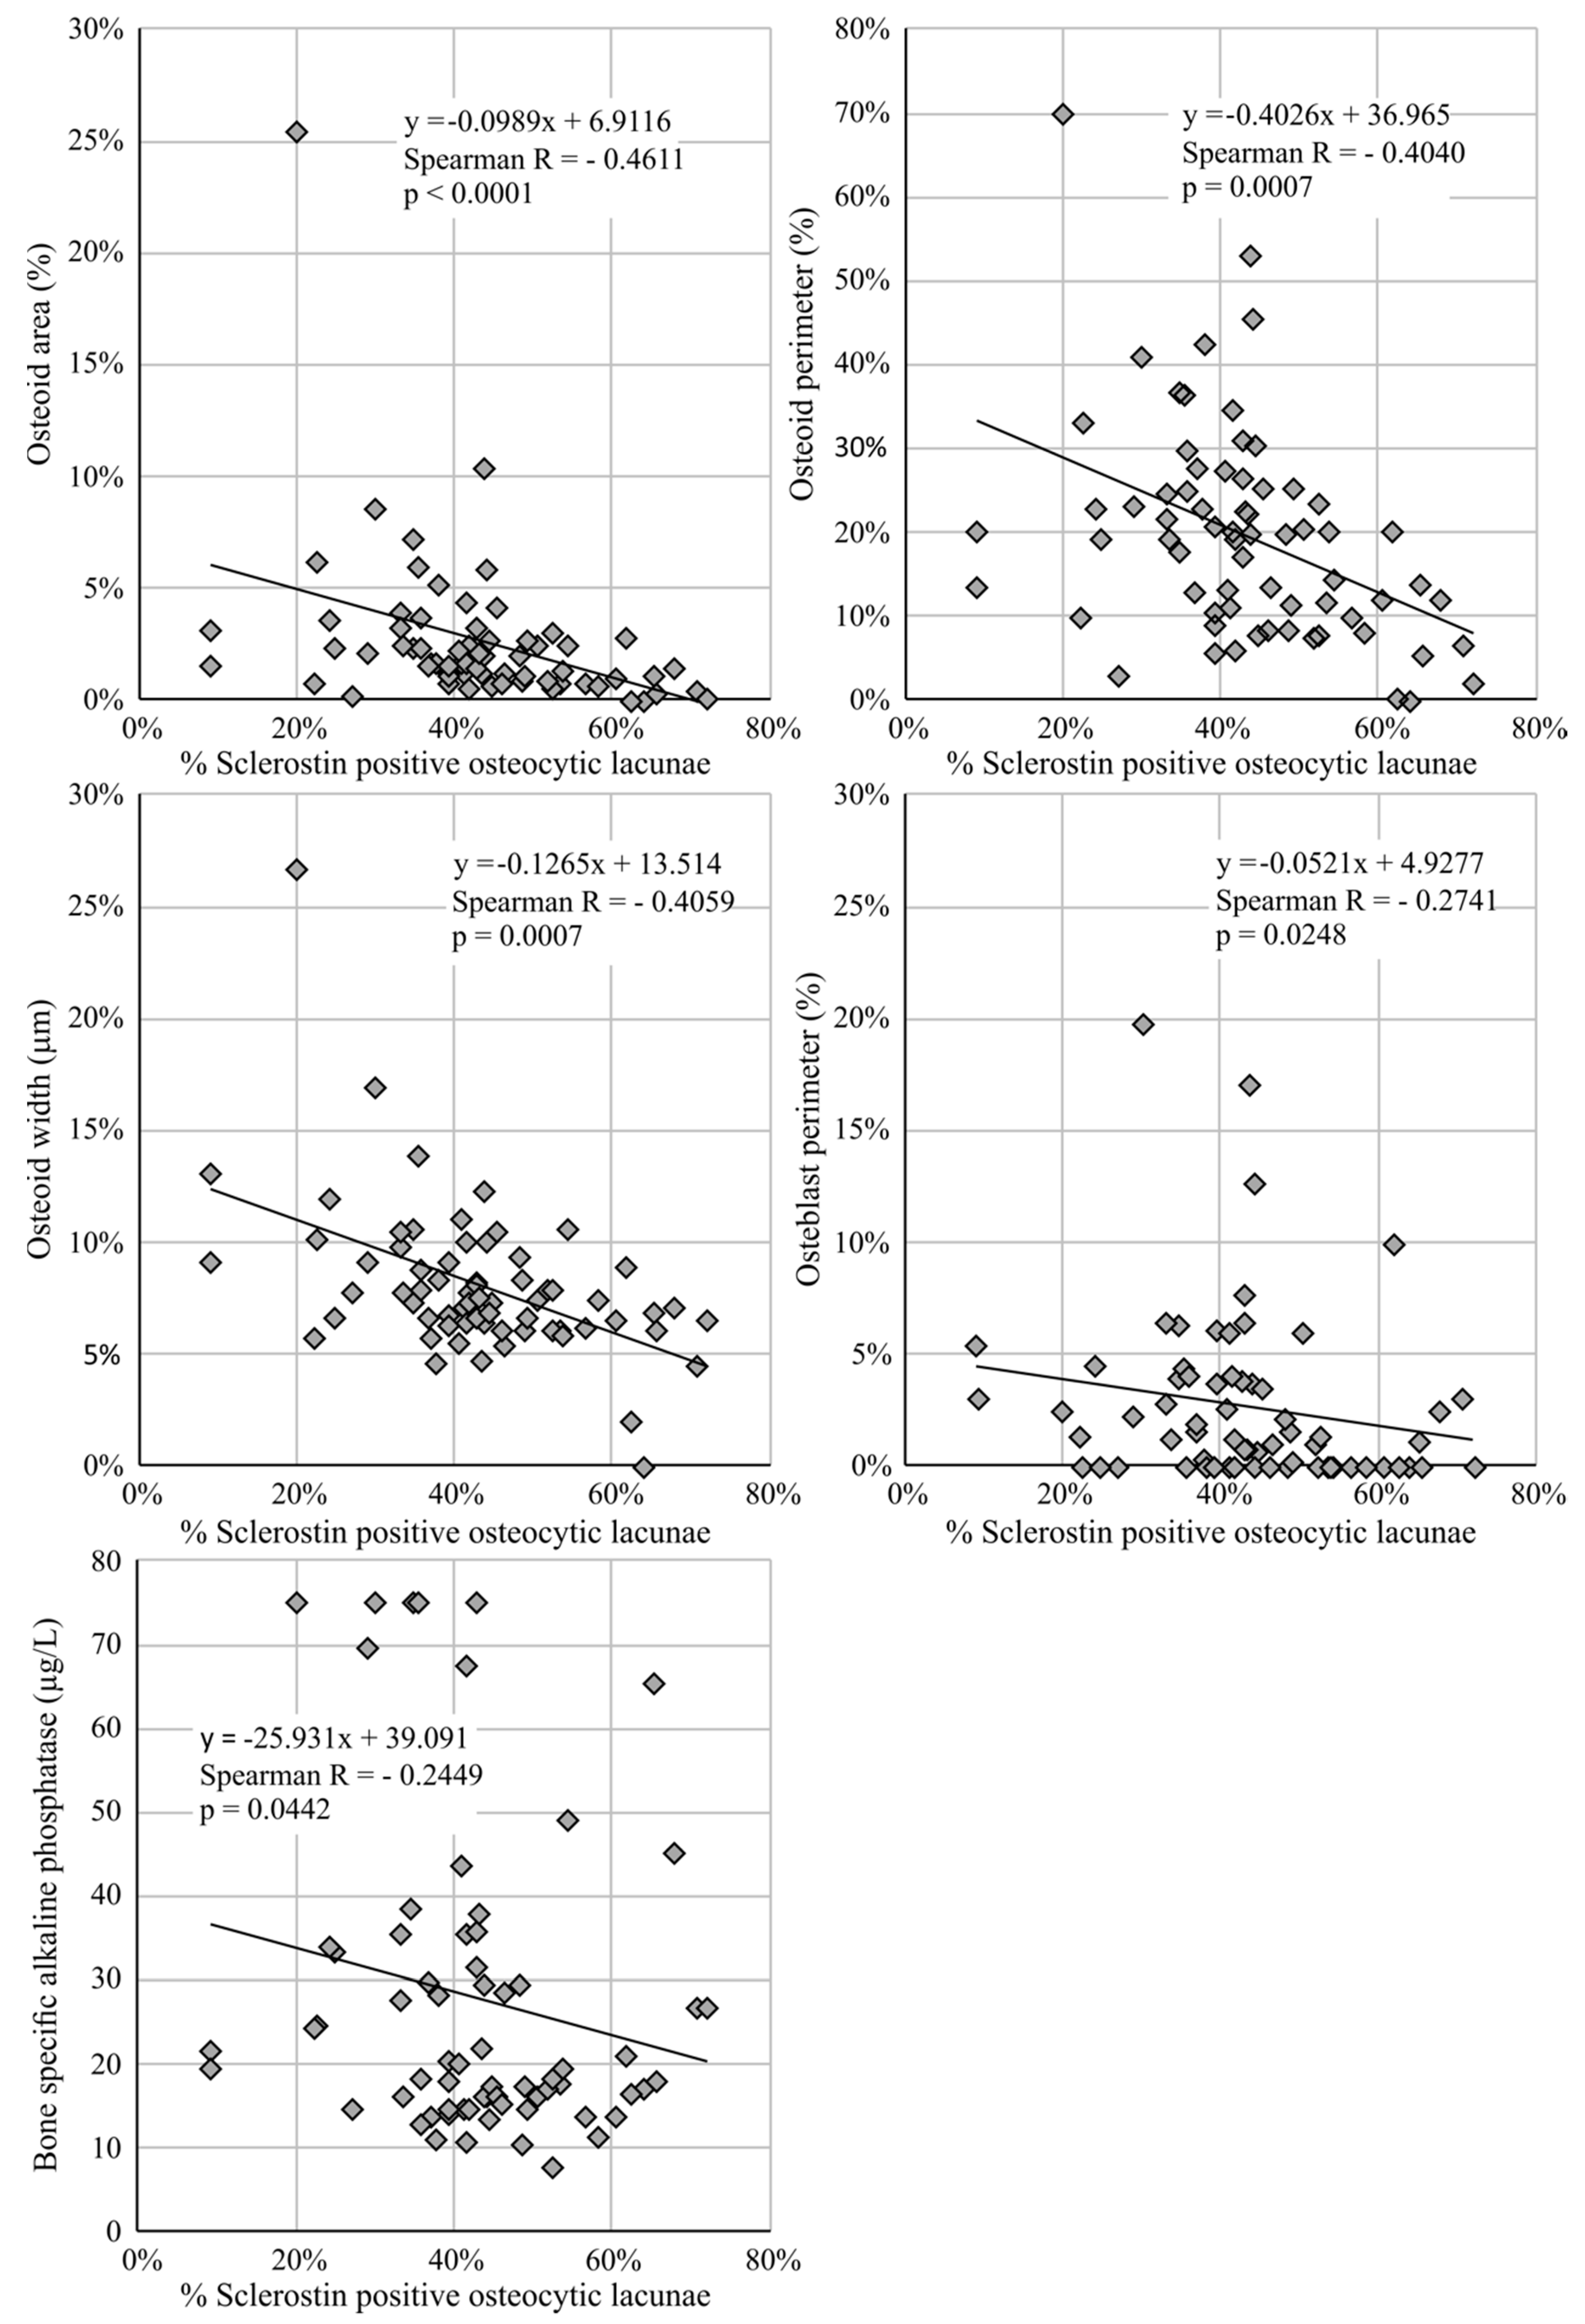
The main findings of the present bone biopsy-based study are: (i) that skeletal sclerostin expression moderately correlates with circulating sclerostin, whatever commercial assay is used; and (ii) that skeletal and circulating sclerostin negatively correlate with histomorphometric and circulating parameters of bone formation.
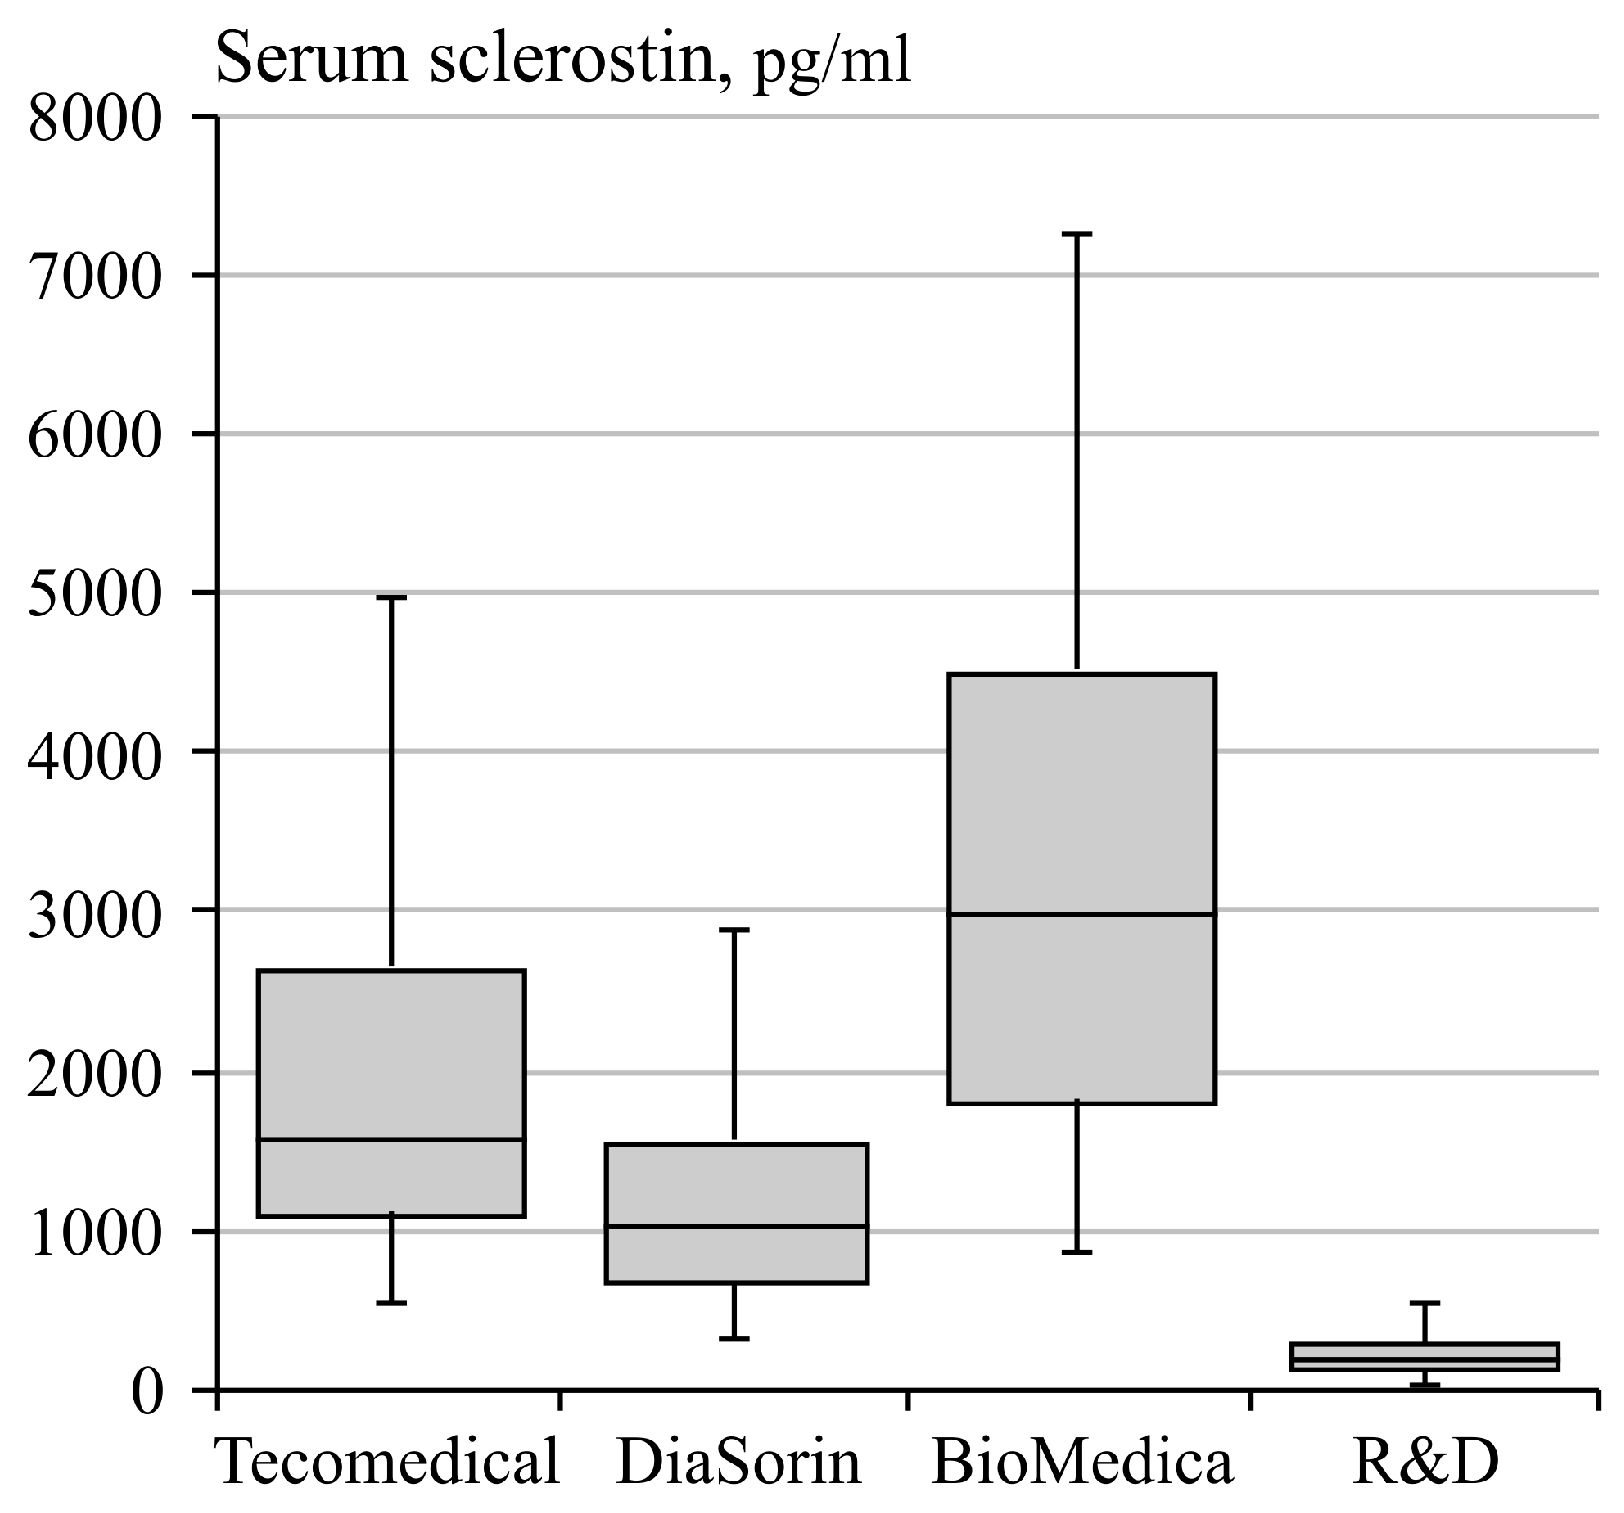
Serum sclerostin concentrations determined with the 4 assays highly correlated with each other reciprocally. When considering the absolute values, however, the median serum sclerostin values measured by the four assays under study markedly differed between each other. The highest values (3109 (2524) pg/mL) were found using the BioMedica assay, whilst the lowest values (214 (159) pg/mL) were found using the R&D assay. This is an important finding which should be taken into account when data from different studies using different assays are to be interpreted.
Serum sclerostin levels measured with the DiaSorin assay did not correlate with the histomorphometric bone parameters, nor with bone formation/resorption biomarkers, contrary to the other assays that found serum sclerostin values to be inversely correlated with bone histomorphometric parameters that are linked to osteoblastic activity and osteoid deposition, hence reflecting bone formation. This is further confirmed by the negative correlation with bone formation markers BsAP and P1NP.
Despite differences in absolute values for serum sclerostin levels measured with the 4 different assays, results obtained with the 4 assays significantly correlated with the skeletal sclerostin expression. Similar to serum sclerostin levels, skeletal sclerostin expression inversely correlated with bone formation, as evidenced by both histomorphometric and serum markers.
Furthermore, serum sclerostin levels, as measured with the 4 assays under study, were all positively associated with age, BMI, and serum OPG levels. Interestingly, a positive correlation with plasma FGF23 levels was also found with 3 of the 4 assays.
4.1. Interassay Variability
Previous studies [
7,
12,
13,
14] have shown that different bioassays for measuring circulating sclerostin show important inter-assay variability. In the present study, we compared the clinical relevance of 4 commercially available sclerostin assays. Inter-assay variability can reasonably be explained by the extent at which interfering substances that have a similar structure to sclerostin or sclerostin fragments are co-detected with the intact molecule. It has been reported that the BioMedica assay detects sclerostin fragments in addition to the intact sclerostin [
15]. Furthermore, it has been shown that this assay may also cross-react with proteins that have a similar structure to sclerostin, which was evidenced by the detection of low “sclerostin” protein levels in the serum of sclerosteosis patients (i.e., patients in which functional or intact sclerostin is not expected to be present because of a genetic mutation in the
SOST gene) [
15]. The limited analytical specificity is in line with the fact that with this assay the highest serum sclerostin levels were measured in the current study population.
According to the manufacturer, the DiaSorin assay was designed to reduce the sources of variation by unbinding heparin and bone morphogenetic proteins (BMP) from sclerostin, in order to make sure that the epitope is available for conjugate recognition [
13]. Furthermore, by using antibodies directed against the C- and N-terminus of the sclerostin protein, only intact sclerostin is measured. Given the fact that the Tecomedical assay also results in higher sclerostin concentrations compared to the DiaSorin assay, this might imply that the former assay also detects fragments or cross-reacts with proteins that are structurally similar to sclerostin.
Lastly, the R&D assay systematically gave the lowest sclerostin values, which suggests that only intact sclerostin is measured [
14]. Yet, there are large differences in measured serum sclerostin levels between the DiaSorin and the R&D assay. Some of the variation could be due to the detection of dimeric or other sclerostin-associated protein complexes with the DiaSorin assay as opposed to the R&D assay.
4.2. Circulating vs. Bone Sclerostin
Importantly, despite the differences in absolute sclerostin values obtained with the different immunoassays, comparable correlations were found with the % of sclerostin-positive osteocytic lacunae (i.e., a measure of skeletal protein expression). These correlations, although significant, were rather modest. To a certain extent, this might be explained by limitations specific to the assays or the quantification of skeletal sclerostin expression. Moreover, examining sclerostin expression in bone biopsies does not necessarily reflect the whole skeletal compartment. Indeed, skeletal heterogeneity of sclerostin expression is probable, in part reflecting differences in mechanical loading between different skeletal sites [
16]. In addition, extra-osseous-produced sclerostin has been hypothesized to spill over into the circulation, and as such represents an additional confounding factor (source of bias) [
17]. In this regard, especially the vasculature needs to be mentioned. During the vascular calcification process, vascular smooth muscle cells undergo osteochondrogenic transdifferentiation, which goes along with increased activation of the Wnt/β-catenin signaling cascade [
18]. Although debate is still ongoing, experimental as well as clinical studies have demonstrated increased expression of sclerostin in calcifying vascular smooth muscle cells and in aortic valves [
17,
19,
20,
21]. This has led to the interesting hypothesis that sclerostin produced in the calcified vessels might partly spill-over to the serum compartment, leading to increased serum sclerostin levels in patients or animals with vascular media calcification [
22,
23]. The relationship between serum sclerostin, vascular sclerostin expression, and vascular calcification, however, requires further investigation.
4.3. Demographic and Biochemical (Serum) Parameters in the ESKD Cohort in Relation to Sclerostin
This study confirmed a negative association between serum sclerostin and residual renal function [
24]. While originally explained as the consequence of renal retention [
25,
26], Cejka et al., provided evidence that the increasing serum sclerostin levels in patients with declining kidney function most likely results from an increased (possibly extra-osseous) production [
27]. On the other hand, one might also argue that the lower the RRF is, the higher the concentration of circulating sclerostin fragments. Hence, with less specific assays measuring both the intact form and fragments, higher concentrations will reasonably be found. This latter assumption is supported by our observation that with the R&D assay, which yielded the lowest mean serum sclerostin levels, no correlation was found with RRF, in contrast to the other assays under study.
The increased serum sclerostin levels in men versus women were not confirmed in the present study [
25,
26]. This is probably due to the unequal distribution between men (
N = 19) and women (
N = 49). It should be mentioned, however, that a significant positive correlation between skeletal sclerostin expression and male gender was observed.
As also reported by others [
28,
29], the BMI of our cohort was positively correlated with serum sclerostin levels. Currently, no clear explanation is available. One hypothesis could be based on the observation that sclerostin production is increased in individuals that are less active compared to the physically active individuals [
28]. During physical activity, mechanical stress is applied to the skeleton, which is sensed by the osteocytes, which then respond by lowering sclerostin expression [
16]. Another hypothesis is a possible role for sclerostin in adipogenesis [
23,
30,
31,
32]. Research showed that mice overexpressing the
Sost gene (encoding for sclerostin) had excess adipose tissue [
31].
Three out of four assays also confirmed the previously reported positive correlation between plasma FGF23 levels and serum sclerostin levels in CKD patients [
29,
33], which as evidenced from experimental studies is due to the fact that sclerostin inhibits the protein-encoding gene PHEX [
34]. PHEX reduces FGF23 activity by interacting with its co-receptor Klotho [
33]. Inhibition of PHEX by sclerostin indirectly results in an increased tubular phosphate excretion and decreased 1,25 (OH)
2 Vit D synthesis via unhindered FGF23 activity. These findings are in line with data from a study demonstrating sclerostin knockout mice to have decreased FGF23 concentrations, which results in increased serum phosphate and 1,25 (OH)
2 Vit D levels [
34]. Our results are in line with the physiologic regulatory role of sclerostin on FGF23 synthesis, however, alternative explanations cannot be excluded, such as concomitant confounding by residual renal function.
Furthermore, in our ESKD cohort serum sclerostin strongly correlated with serum OPG levels in a positive way. Apparently, this is rather unexpected, since sclerostin, a protein with catabolic effects on bone, is known to inhibit osteoblastic OPG production [
5]. As a decoy receptor of RANKL, OPG inhibits bone resorption, and mice lacking OPG have been shown to suffer from osteoporosis [
35]. On the other hand, OPG levels are known to be increased in patients with vascular calcification [
36], and mice lacking OPG develop vascular media calcification in addition to osteoporosis [
35]. Furthermore, OPG is identified as a vascular smooth muscle cell-specific senescence-associated secretory phenotype (SASP) protein [
37], and therefore, similar to sclerostin, serum OPG levels in vascular calcification might increase as a result of extra-osseous (vascular) OPG production.
As demonstrated by others [
12,
38,
39,
40,
41,
42], an inverse association was observed between serum sclerostin and serum lnPTH concentrations. PTH is known to be a regulator of sclerostin production by reducing the sclerostin expression. Remarkably, serum sclerostin levels measured by the DiaSorin assay, as opposed to the other assays, did not significantly correlate with serum lnPTH levels, nor did they correlate with histomorphometrical or serum parameters related to bone formation.

 ,
, 


