
Prostate Cancer Detection and Prognosis: From Prostate Specific Antigen (PSA) to Exosomal Biomarkers


Abstract
:
1. Introduction
2. Blood-Based PCa Biomarkers
2.1. Prostate Health Index (PHI)
2.2. Kallikrein Panel
3. Urine-Based PCa Biomarkers
3.1. PCA3
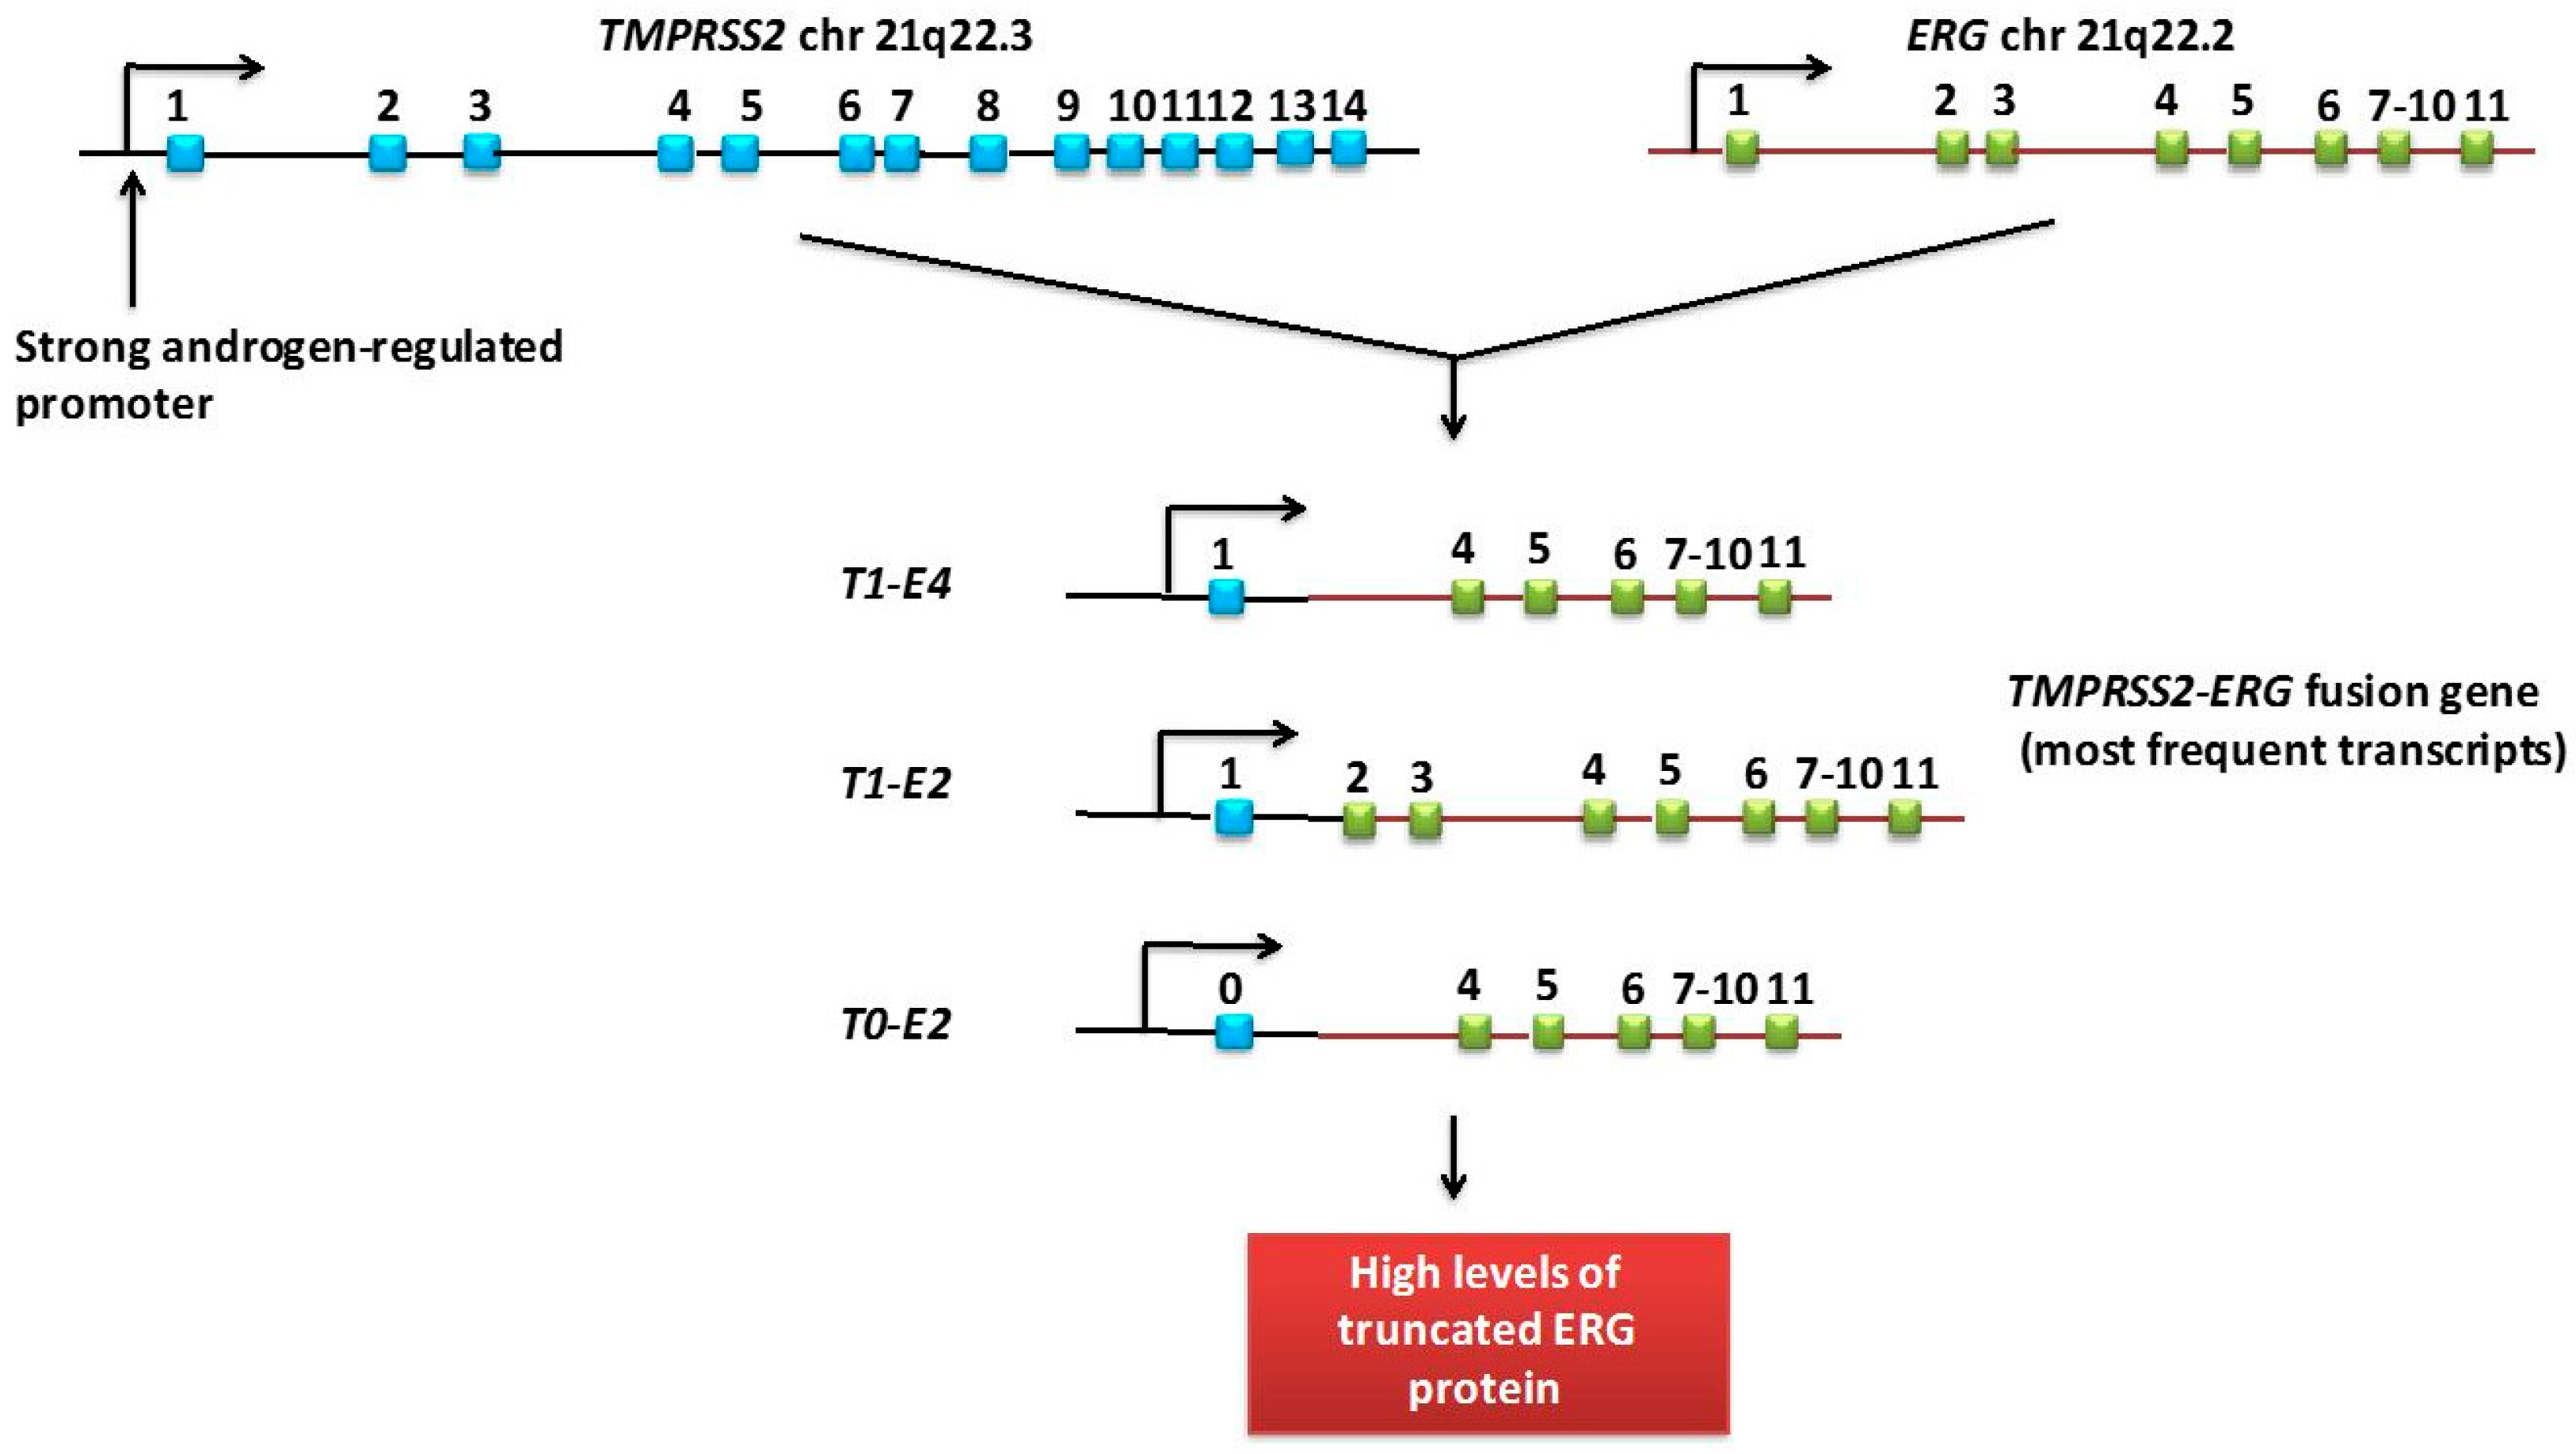
3.2. TMPRSS2:ERG Fusion Gene
4. miRNAs
5. Exosomal Biomarkers
6. Conclusions
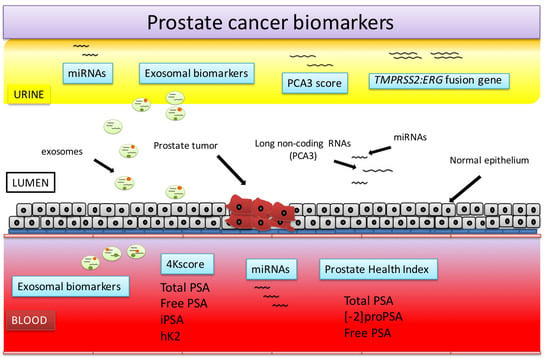
Prostate health index
Biomarkers measured: PSA, fPSA, [−2]proPSA
Sample: serum
Approved by the Food and Drug Administration (FDA)
Recommended by the National Comprehensive Cancer Network
Related to PCa aggressiveness
4Kscore
Biomarkers measured: PSA, fPSA, iPSA, hK2
Sample: serum
The test provides information about the probability of having a high-risk PCa
Recommended by the National Comprehensive Cancer Network
Related to PCa aggressiveness
PCA3 score
Biomarkers measured: mRNA PCA3 in relation to mRNA PSA
Sample: urine obtained after prostate massage
Approved by the Food and Drug Administration (FDA)
Recommended by the National Comprehensive Cancer Network
Inconclusive results about its relationship with PCa aggressiveness
TMPRSS2:ERG fusion gene
Biomarkers measured: mRNA TMPRSS2:ERG in relation to mRNA PSA
Sample: urine obtained after prostate massage
Preliminary results
miRNAs and other exosomal biomarkers
Sample: blood and urine
Directly related to development and progression of cancer
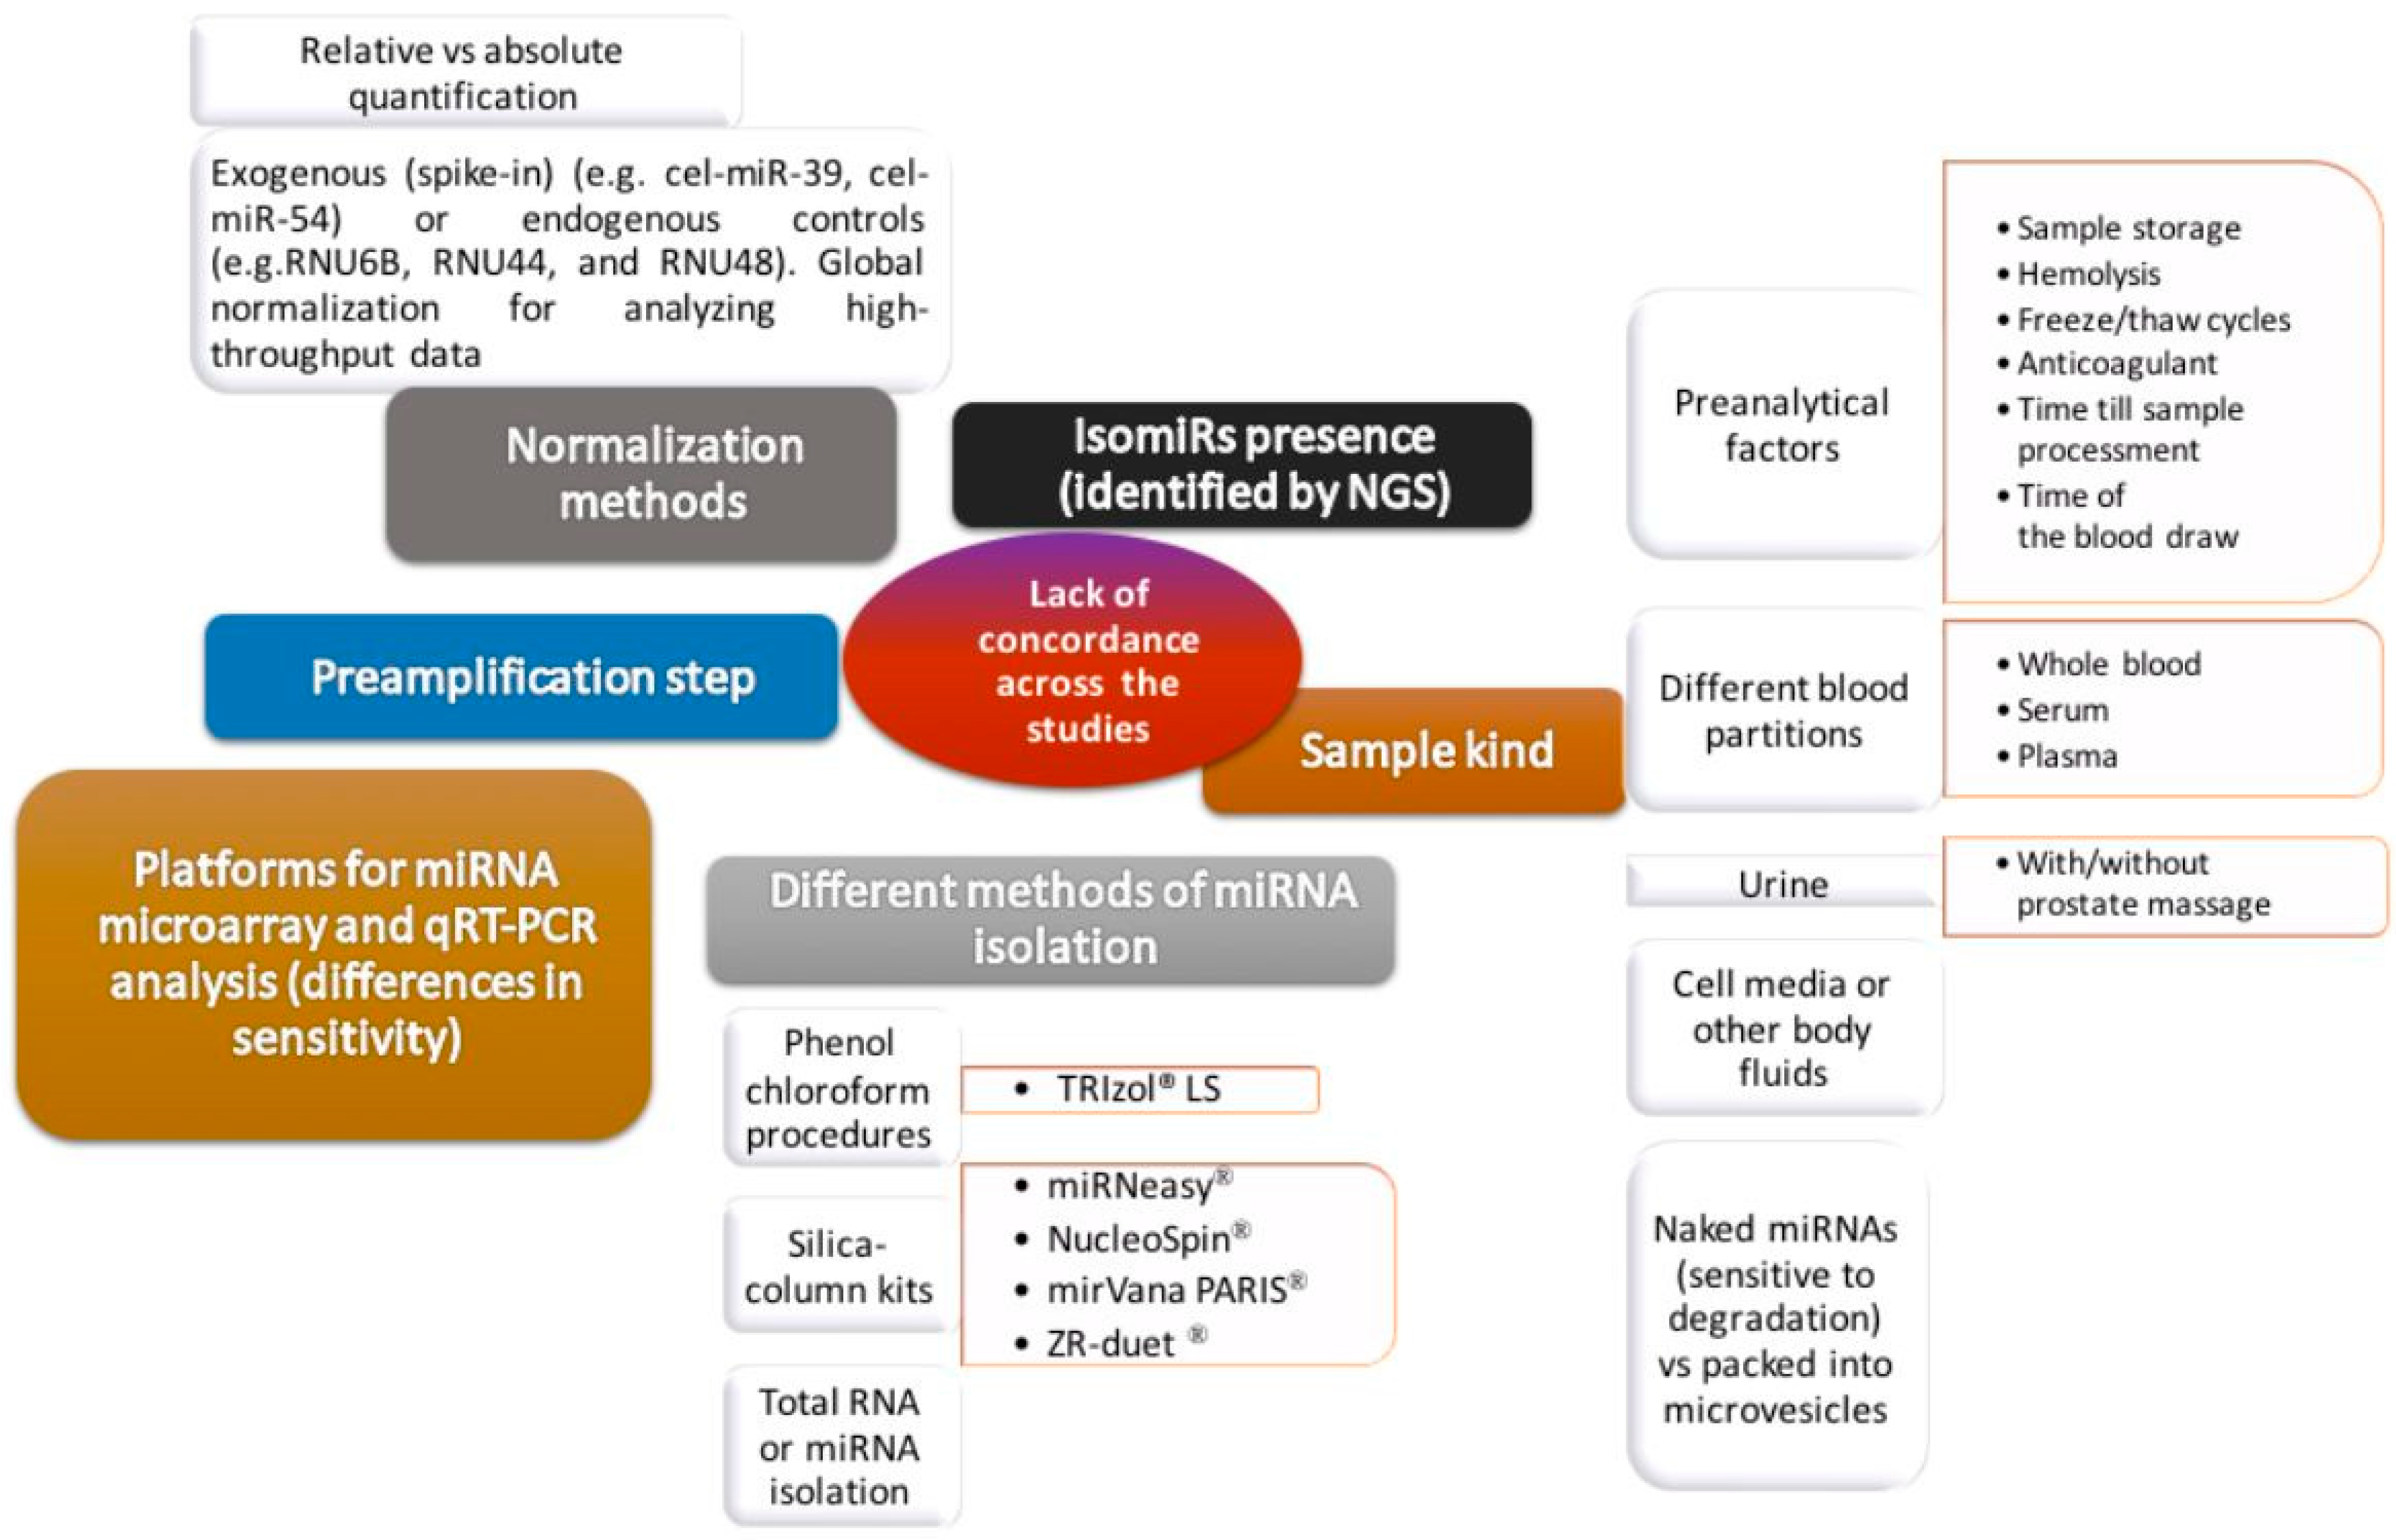
No standardized methodology
Preliminary results
Conflicts of Interest
References
- Zhou, C.K.; Check, D.P.; Lortet-Tieulent, J.; Laversanne, M.; Jemal, A.; Ferlay, J.; Bray, F.; Cook, M.B.; Devesa, S.S. Prostate cancer incidence in 43 populations worldwide: An analysis of time trends overall and by age group. Int. J. Cancer 2016, 138, 1388–1400. [Google Scholar] [CrossRef] [PubMed]
- Bohnen, A.M.; Groeneveld, F.P.; Bosch, J.L. Serum prostate-specific antigen as a predictor of prostate volume in the community: The Krimpen study. Eur. Urol. 2007, 51, 1645–1652. [Google Scholar] [CrossRef] [PubMed]
- Roobol, M.J.; van Vugt, H.A.; Loeb, S.; Zhu, X.; Bul, M.; Bangma, C.H.; van Leenders, A.G.; Steyerberg, E.W.; Schröder, F.H. Prediction of prostate cancer risk: The role of prostate volume and digital rectal examination in the ERSPC risk calculators. Eur. Urol. 2012, 61, 577–583. [Google Scholar] [CrossRef] [PubMed]
- Gudmundsson, J.; Besenbacher, S.; Sulem, P.; Gudbjartsson, D.F.; Olafsson, I.; Arinbjarnarson, S.; Agnarsson, B.A.; Benediktsdottir, K.R.; Isaksson, H.J.; Kostic, J.P.; et al. Genetic correction of PSA values using sequence variants associated with PSA levels. Sci. Transl. Med. 2010, 2, 62ra92. [Google Scholar] [CrossRef] [PubMed] [Green Version]
- Helfand, B.; Roehl, K.A.; Cooper, P.R.; McGuire, B.B.; Fitzgerald, L.M.; Cancel-Tassin, G.; Cornu, J.N.; Bauer, S.; van Blarigan, E.L.; Chen, X.; et al. Associations of prostate cancer risk variants with disease aggressiveness: Results of the NCI-SPORE Genetics Working Group analysis of 18,343 cases. Hum. Genet. 2015, 134, 439–450. [Google Scholar] [CrossRef] [PubMed]
- Helfand, B.T.; Loeb, S.; Hu, Q.; Cooper, P.R.; Roehl, K.A.; McGuire, B.B.; Baumann, N.A.; Catalona, W.J. Personalized prostate specific antigen testing using genetic variants may reduce unnecessary prostate biopsies. J. Urol. 2013, 189, 1697–1701. [Google Scholar] [CrossRef] [PubMed]
- Heidenreich, A.; Bastian, P.J.; Bellmunt, J.; Bolla, M.; Joniau, S.; van der Kwast, T.; Mason, M.; Matveev, V.; Wiegel, T.; Zattoni, F.; et al. EAU guidelines on prostate cancer. Part 1: Screening; diagnosis; and local treatment with curative intent-update 2013. Eur. Urol. 2014, 65, 124–137. [Google Scholar] [CrossRef] [PubMed]
- Palisaar, J.R.; Noldus, J.; Löppenberg, B.; von Bodman, C.; Sommerer, F.; Eggert, T. Comprehensive report on prostate cancer misclassification by 16 currently used low-risk and active surveillance criteria. BJU Int. 2012, 110, E172–E181. [Google Scholar] [CrossRef] [PubMed]
- Lee, R.; Localio, A.R.; Armstrong, K.; Malkowicz, S.B.; Schwartz, J.S. A meta-analysis of the performance characteristics of the free prostate-specific antigen test. Urology 2006, 67, 762–768. [Google Scholar] [CrossRef] [PubMed]
- Mikolajczyk, S.D.; Marks, L.S.; Partin, A.W.; Rittenhouse, H.G. Free prostate-specific antigen in serum is becoming more complex. Urology 2002, 59, 797–802. [Google Scholar] [CrossRef]
- Prostate Cancer Early Detection. National Cancer Comprehensive Network Clinical Practice Guidelines in Oncology. Version 2. 2016. Available online: https://www.nccn.org/professionals/physician_gls/pdf/prostate_detection.pdf (accessed on 9 September 2016).
- Stephan, C.; Vincendeau, S.; Houlgatte, A.; Cammann, H.; Jung, K.; Semjonow, A. Multicenter evaluation of [−2]proprostate-specific antigen and the prostate health index for detecting prostate cancer. Clin. Chem. 2013, 59, 306–314. [Google Scholar] [CrossRef] [PubMed]
- Lazzeri, M.; Haese, A.; de la Taille, A.; Palou Redorta, J.; McNicholas, T.; Lughezzani, G.; Scattoni, V.; Bini, V.; Freschi, M.; Sussman, A.; et al. Serum isoform [−2]proPSA derivatives significantly improve prediction of prostate cancer at initial biopsy in a total PSA range of 2–10 ng/mL: A multicentric European study. Eur. Urol. 2013, 63, 986–994. [Google Scholar] [CrossRef] [PubMed]
- Filella, X.; Giménez, N. Evaluation of [−2]proPSA and Prostate Health Index (phi) for the detection of prostate cancer: A systematic review and meta-analysis. Clin. Chem. Lab. Med. 2012, 15, 1–11. [Google Scholar] [CrossRef] [PubMed]
- Wang, W.; Wang, M.; Wang, L.; Adams, T.S.; Tian, Y.; Xu, J. Diagnostic ability of %p2PSA and prostate health index for aggressive prostate cancer: A meta-analysis. Sci. Rep. 2014, 4, 5012. [Google Scholar] [CrossRef] [PubMed]
- Bruzzese, D.; Mazzarella, C.; Ferro, M.; Perdonà, S.; Chiodini, P.; Perruolo, G.; Terracciano, D. Prostate health index vs. percent free prostate-specific antigen for prostate cancer detection in men with “gray” prostate-specific antigen levels at first biopsy: Systematic review and meta-analysis. Transl. Res. 2014, 164, 444–451. [Google Scholar] [PubMed]
- Loeb, S.; Sanda, M.G.; Broyles, D.L.; Shin, S.S.; Bangma, C.H.; Wei, J.T.; Partin, A.W.; Klee, G.G.; Slawin, K.M.; Marks, L.S.; et al. The prostate health index selectively identifies clinically significant prostate cancer. J. Urol. 2015, 193, 1163–1169. [Google Scholar] [CrossRef] [PubMed]
- Fossati, N.; Buffi, N.M.; Haese, A.; Stephan, C.; Larcher, A.; McNicholas, T.; de la Taille, A.; Freschi, M.; Lughezzani, G.; Abrate, A.; et al. Preoperative Prostate-specific Antigen isoform p2PSA and its derivatives; %p2PSA and Prostate Health Index; predict pathologic outcomes in patients undergoing radical prostatectomy for prostate cancer: Results from a multicentric European prospective study. Eur. Urol. 2015, 68, 132–138. [Google Scholar] [CrossRef] [PubMed]
- Stephan, C.; Kahrs, A.M.; Cammann, H.; Lein, M.; Schrader, M.; Deger, S.; Miller, K.; Jung, K. A [−2]proPSA-based artificial neural network significantly improves differentiation between prostate cancer and benign prostatic diseases. Prostate 2009, 69, 198–207. [Google Scholar] [CrossRef] [PubMed]
- Guazzoni, G.; Nava, L.; Lazzeri, M.; Scattoni, V.; Lughezzani, G.; Maccagnano, C.; Dorigatti, F.; Ceriotti, F.; Pontillo, M.; Bini, V.; et al. Prostate-specific antigen (PSA) isoform p2PSA significantly improves the prediction of prostate cancer at initial extended prostate biopsies in patients with total PSA between 2.0 and 10 ng/mL: Results of a prospective study in a clinical setting. Eur. Urol. 2011, 60, 214–222. [Google Scholar]
- Filella, X.; Foj, L.; Alcover, J.; Augé, J.M.; Molina, R.; Jiménez, W. The influence of prostate volume in prostate health index performance in patients with total PSA lower than 10 μg/L. Clin. Chim. Acta 2014, 436, 303–307. [Google Scholar] [CrossRef] [PubMed]
- Lughezzani, G.; Lazzeri, M.; Larcher, A.; Lista, G.; Scattoni, V.; Cestari, A.; Buffi, N.M.; Bini, V.; Guazzoni, G. Development and internal validation of a Prostate Health Index based nomogram for predicting prostate cancer at extended biopsy. J. Urol. 2012, 188, 1144–1150. [Google Scholar] [CrossRef] [PubMed]
- Lughezzani, G.; Lazzeri, M.; Haese, A.; McNicholas, T.; de la Taille, A.; Buffi, N.M.; Fossati, N.; Lista, G.; Larcher, A.; Abrate, A.; et al. Multicenter European external validation of a prostate health index-based nomogram for predicting prostate cancer at extended biopsy. Eur. Urol. 2014, 66, 906–912. [Google Scholar] [CrossRef] [PubMed]
- Roobol, M.J.; Moniek, M.; Vedder, M.M.; Nieboer, D.; Houlgatte, A.; Vincendeau, S.; Lazzeri, M.; Guazzoni, G.; Stephan, C.; Semjonow, A.; et al. Comparison of two prostate cancer risk calculators that include the Prostate Health Index. Eur. Urol. Foucs 2015, 1, 185–190. [Google Scholar]
- Heijnsdijk, E.A.; Denham, D.; de Koning, H.J. The cost-efectiveness of prostate cancer detection with the use of Prostate Health Index. Value Health 2016, 19, 153–157. [Google Scholar] [CrossRef] [PubMed]
- Vickers, A.J.; Cronin, A.M.; Aus, G.; Pihl, C.G.; Becker, C.; Pettersson, K.; Scardino, P.T.; Hugosson, J.; Lilja, H. A panel of kallikrein markers can reduce unnecessary biopsy for prostate cancer: Data from the European Randomized Study of Prostate Cancer Screening in Göteborg, Sweden. BMC Med. 2008, 6, 19. [Google Scholar] [CrossRef] [PubMed]
- Vickers, A.; Cronin, A.; Roobol, M.; Savage, C.; Peltola, M.; Pettersson, K.; Scardino, P.T.; Schröder, F.; Lilja, H. Reducing unnecessary biopsy during prostate cancer screening using a four-kallikrein panel: An independent replication. J. Clin. Oncol. 2010, 28, 2493–2498. [Google Scholar] [CrossRef] [PubMed]
- Vickers, A.J.; Cronin, A.M.; Roobol, M.J.; Savage, C.J.; Peltola, M.; Pettersson, K.; Scardino, P.T.; Schröder, F.H.; Lilja, H. A four-kallikrein panel predicts prostate cancer in men with recent screening: Data from the European Randomized Study of Screening for Prostate Cancer, Rotterdam. Clin. Cancer Res. 2010, 16, 3232–3239. [Google Scholar] [CrossRef] [PubMed]
- Vickers, A.J.; Cronin, A.M.; Aus, G.; Pihl, C.G.; Becker, C.; Pettersson, K.; Scardino, P.T.; Hugosson, J.; Lilja, H. Impact of recent screening on predicting the outcome of prostate cancer biopsy in men with elevated prostate-specific antigen: Data from the European Randomized Study of Prostate Cancer Screening in Gothenburg, Sweden. Cancer 2010, 116, 2612–2620. [Google Scholar] [CrossRef] [PubMed]
- Gupta, A.; Roobol, M.J.; Savage, C.J.; Peltola, M.; Pettersson, K.; Scardino, P.T.; Vickers, A.J.; Schröder, F.H.; Lilja, H. A four-kallikrein panel for the prediction of repeat prostate biopsy: Data from the European Randomized Study of Prostate Cancer screening in Rotterdam, Netherlands. Br. J. Cancer 2010, 103, 708–714. [Google Scholar] [CrossRef] [PubMed]
- Benchikh, A.; Savage, C.; Cronin, A.; Salama, G.; Villers, A.; Lilja, H.; Vickers, A. A panel of kallikrein markers can predict outcome of prostate biopsy following clinical work-up: An independent validation study from the European Randomized Study of Prostate Cancer screening, France. BMC Cancer 2010, 10, 635. [Google Scholar] [CrossRef] [PubMed]
- Vickers, A.J.; Gupta, A.; Savage, C.J.; Pettersson, K.; Dahlin, A.; Bjartell, A.; Manjer, J.; Scardino, P.T.; Ulmert, D.; Lilja, H. A panel of kallikrein marker predicts prostate cancer in a large; population-based cohort followed for 15 years without screening. Cancer Epidemiol. Biomark. Prev. 2011, 20, 255–261. [Google Scholar] [CrossRef] [PubMed]
- Carlsson, S.V.; Peltola, M.T.; Sjoberg, D.; Schröder, F.H.; Hugosson, J.; Pettersson, K.; Scardino, P.T.; Vickers, A.J.; Lilja, H.; Roobol, M.J. Can one blood draw replace transrectal ultrasonography-estimated prostate volume to predict prostate cancer risk? BJU Int. 2013, 112, 602–609. [Google Scholar] [CrossRef] [PubMed]
- Parekh, D.J.; Punnen, S.; Sjoberg, D.D.; Asroff, S.W.; Bailen, J.L.; Cochran, J.S.; Concepcion, R.; David, R.D.; Deck, K.B.; Dumbadze, I.; et al. A Multi-institutional prospective trial in the USA confirms that the 4K score accurately identifies men with high-grade prostate cancer. Eur. Urol. 2015, 68, 464–470. [Google Scholar] [CrossRef] [PubMed]
- Stattin, P.; Vickers, A.J.; Sjoberg, D.D.; Johansson, R.; Granfors, T.; Johansson, M.; Pettersson, K.; Scardino, P.T.; Hallmans, G.; Lilja, H. Improving the specificity of screening for lethal prostate cancer using Prostate-specific Antigen and a panel of kallikrein markers: A nested case-control study. Eur. Urol. 2015, 68, 207–213. [Google Scholar] [CrossRef] [PubMed]
- Filella, X.; Foj, L.; Milà, M.; Augé, J.M.; Molina, R.; Jiménez, W. PCA3 in the detection and management of early prostate cancer. Tumour Biol. 2013, 34, 1337–1347. [Google Scholar] [CrossRef] [PubMed]
- Haese, A.; de la Taille, A.; van Poppel, H.; Marberger, M.; Stenzl, A.; Mulders, P.F.; Huland, H.; Abbou, C.C.; Remzi, M.; Tinzl, M. Clinical utility of the PCA3 urine assay in European men scheduled for repeat biopsy. Eur. Urol. 2008, 54, 1081–1088. [Google Scholar] [CrossRef] [PubMed]
- Hu, B.; Yang, H.; Yang, H. Diagnostic value of urine prostate cancer antigen 3 test using a cutoff value of 35 μg/L in patients with prostate cancer. Tumour Biol. 2014, 35, 8573–8580. [Google Scholar] [CrossRef] [PubMed]
- Crawford, E.D.; Rove, K.O.; Trabulsi, E.J.; Qian, J.; Drewnowska, K.P.; Kaminetsky, J.C.; Huisman, T.K.; Bilowus, M.L.; Freedman, S.J.; Glover, W.L.; et al. Diagnostic performance of PCA3 to detect prostate cancer in men with increased prostate specific antigen: A prospective study of 1962 cases. J. Urol. 2012, 188, 1726–1731. [Google Scholar] [CrossRef] [PubMed]
- Bussemakers, M.J.; van Bokhoven, A.; Verhaegh, G.W.; Smit, F.P.; Karthaus, H.F.; Schalken, J.A.; Debruyne, F.M.; Ru, N.; Isaacs, W.B. DD3: A new prostate-specific gene, highly overexpressed in prostate cancer. Cancer Res. 1999, 59, 5975–5979. [Google Scholar] [PubMed]
- Schröder, F.H.; Venderbos, L.D.; van den Bergh, R.C.; Hessels, D.; van Leenders, G.J.; van Leeuwen, P.J.; Wolters, T.; Barentsz, J.; Roobol, M.J. Prostate cancer antigen 3: Diagnostic outcomes in men presenting with urinary prostate cancer antigen 3 scores ≥100. Urology 2014, 83, 613–616. [Google Scholar] [CrossRef] [PubMed]
- Merola, R.; Tomao, L.; Antenucci, A.; Sperduti, I.; Sentinelli, S.; Masi, S.; Mandoj, C.; Orlandi, G.; Papalia, R.; Guaglianone, S.; et al. PCA3 in prostate cancer and tumor aggressiveness detection on 407 high-risk patients: A National Cancer Institute experience. J. Exp. Clin. Cancer Res. 2015, 34, 15. [Google Scholar] [CrossRef] [PubMed]
- Chevli, K.K.; Duff, M.; Walter, P.; Yu, C.; Capuder, B.; Elshafei, A.; Malczewski, S.; Kattan, M.W.; Jones, J.S. Urinary PCA3 as a predictor for prostate cancer in a cohort of 3073 men undergoing initial prostate biopsy. J. Urol. 2014, 191, 1743–1748. [Google Scholar] [CrossRef] [PubMed]
- Hessels, D.; van Gils, M.P.; van Hooij, O.; Jannink, S.A.; Witjes, J.A.; Verhaegh, G.W.; Schalken, J.A. Predictive value of PCA3 in urinary sediments in determining clinico-pathological characteristics of prostate cancer. Prostate 2010, 70, 10–16. [Google Scholar] [CrossRef] [PubMed]
- Foj, L.; Milà, M.; Mengual, L.; Luque, P.; Alcaraz, A.; Jiménez, W.; Filella, X. Real-time PCR PCA3 assay is a useful test measured in urine to improve prostate cancer detection. Clin. Chim. Acta 2014, 435, 53–58. [Google Scholar] [CrossRef] [PubMed]
- Bradley, L.A.; Palomaki, G.E.; Gutman, S.; Samson, D.; Aronson, N. Comparative effectiveness review: Prostate cancer antigen 3 testing for the diagnosis and management of prostate cancer. J. Urol. 2013, 190, 389–398. [Google Scholar] [CrossRef] [PubMed]
- Roobol, M.J.; Schröder, F.H.; van Leeuwen, P.; Wolters, T.; van den Bergh, R.C.; van Leenders, G.J.; Hessels, D. Performance of the prostate cancer antigen 3 (PCA3) gene and prostate-specific antigen in prescreened men: Exploring the value of PCA3 for a first-line diagnostic test. Eur. Urol. 2010, 58, 475–481. [Google Scholar] [CrossRef] [PubMed]
- Tomlins, S.A.; Rhodes, D.R.; Perner, S.; Dhanasekaran, S.M.; Mehra, R.; Sun, X.W.; Varambally, S.; Cao, X.; Tchinda, J.; Kuefer, R.; et al. Recurrent fusion of TMPRSS2 and ETS transcription factor genes in prostate cancer. Science 2005, 310, 644–648. [Google Scholar] [CrossRef] [PubMed]
- Boström, P.J.; Bjartell, A.S.; Catto, J.W.; Eggener, S.E.; Lilja, H.; Loeb, S.; Schalken, J.; Schlomm, T.; Cooperberg, M.R. Genomic predictors of outcome in prostate cancer. Eur. Urol. 2015, 68, 1033–1044. [Google Scholar] [CrossRef] [PubMed]
- Boormans, J.L.; Porkka, K.; Visakorpi, T.; Trapman, J. Confirmation of the association of TMPRSS2 (exon 0):ERG expression and a favorable prognosis of primary prostate cancer. Eur. Urol. 2011, 60, 183–184. [Google Scholar] [CrossRef] [PubMed]
- FitzGerald, L.M.; Agalliu, I.; Johnson, K.; Miller, M.A.; Kwon, E.M.; Hurtado-Coll, A.; Fazli, L.; Rajput, A.B.; Gleave, M.E.; Cox, M.E.; et al. Association of TMPRSS2-ERG gene fusion with clinical characteristics and outcomes: Results from a population-based study of prostate cancer. BMC Cancer 2008, 8, 230. [Google Scholar] [CrossRef] [PubMed]
- Leyten, G.H.; Hessels, D.; Jannink, S.A.; Smit, F.P.; de Jong, H.; Cornel, E.B.; de Reijke, T.M.; Vergunst, H.; Kil, P.; Knipscheer, B.C.; et al. Prospective multicentre evaluation of PCA3 and TMPRSS2-ERG gene fusions as diagnostic and prognostic urinary biomarkers for prostate cancer. Eur. Urol. 2014, 65, 534–542. [Google Scholar] [CrossRef] [PubMed]
- Tomlins, S.A.; Day, J.R.; Lonigro, R.J.; Hovelson, D.H.; Siddiqui, J.; Kunju, L.P.; Dunn, R.L.; Meyer, S.; Hodge, P.; Groskopf, J.; et al. Urine TMPRSS2:ERG Plus PCA3 for individualized prostate cancer risk assessment. Eur. Urol. 2016, 70, 45–53. [Google Scholar] [CrossRef] [PubMed]
- Stephan, C.; Cammann, H.; Jung, K. Urine TMPRSS2:ERG Plus PCA3 for individualized prostate cancer risk assessment. Eur. Urol. 2015, 68, e106–e107. [Google Scholar] [CrossRef] [PubMed]
- Griffiths-Jones, S. miRBase: The microRNA sequence database. Methods Mol. Biol. Clifton NJ 2006, 342, 129–138. [Google Scholar]
- Calin, G.A.; Dumitru, C.D.; Shimizu, M.; Bichi, R.; Zupo, S.; Noch, E.; Aldler, H.; Rattan, S.; Keating, M.; Rai, K.; et al. Frequent deletions and down-regulation of micro-RNA genes miR15 and miR16 at 13q14 in chronic lymphocytic leukemia. Proc. Natl. Acad. Sci. USA 2002, 99, 15524–15529. [Google Scholar] [CrossRef] [PubMed]
- Lawrie, C.H.; Gal, S.; Dunlop, H.M.; Pushkaran, B.; Liggins, A.P.; Pulford, K.; Banham, A.H.; Pezzella, F.; Boultwood, J.; Wainscoat, J.S.; et al. Detection of elevated levels of tumour-associated microRNAs in serum of patients with diffuse large B-cell lymphoma. Br. J. Haematol. 2008, 141, 672–675. [Google Scholar] [CrossRef] [PubMed]
- Witwer, K.W. Circulating microRNA biomarker studies: Pitfalls and potential solutions. Clin. Chem. 2015, 61, 56–63. [Google Scholar] [CrossRef] [PubMed]
- Tam, S.; de Borja, R.; Tsao, M.S.; McPherson, J.D. Robust global microRNA expression profiling using next-generation sequencing technologies. Lab. Investig. 2014, 94, 350–358. [Google Scholar] [CrossRef] [PubMed]
- ChunJiao, S.; Huan, C.; ChaoYang, X.; GuoMei, R. Uncovering the roles of miRNAs and their relationship with androgen receptor in prostate cancer. IUBMB Life 2014, 66, 379–386. [Google Scholar] [CrossRef] [PubMed]
- Mitchell, P.S.; Parkin, R.K.; Kroh, E.M.; Fritz, B.R.; Wyman, S.K.; Pogosova-Agadjanyan, E.L.; Peterson, A.; Noteboom, J.; O’Briant, K.C.; Allen, A.; et al. Circulating microRNAs as stable blood-based markers for cancer detection. Proc. Natl. Acad. Sci. USA 2008, 105, 10513–10518. [Google Scholar] [CrossRef] [PubMed]
- Filella, X.; Foj, L. miRNAs as novel biomarkers in the management of prostate cancer. Clin. Chem. Lab. Med. 2016. [Google Scholar] [CrossRef] [PubMed]
- Mihelich, B.L.; Maranville, J.C.; Nolley, R.; Peehl, D.M.; Nonn, L. Elevated serum microRNA levels associate with absence of high-grade prostate cancer in a retrospective cohort. PLoS ONE 2015, 10, e0124245. [Google Scholar] [CrossRef] [PubMed]
- Chen, Z.H.; Zhang, G.L.; Li, H.R.; Luo, J.D.; Li, Z.X.; Chen, G.M.; Yang, J. A panel of five circulating microRNAs as potential biomarkers for prostate cancer. Prostate 2012, 72, 1443–1452. [Google Scholar] [CrossRef] [PubMed]
- Moltzahn, F.; Olshen, A.B.; Baehner, L.; Peek, A.; Fong, L.; Stöppler, H.; Simko, J.; Hilton, J.F.; Carroll, P.; Blelloch, R.; et al. Microfluidic-based multiplex qRT-PCR identifies diagnostic and prognostic microRNA signatures in the sera of prostate cancer patients. Cancer Res. 2011, 71, 550–560. [Google Scholar] [CrossRef] [PubMed]
- Salido-Guadarrama, A.I.; Morales-Montor, J.G.; Rangel-Escareño, C.; Langley, E.; Peralta-Zaragoza, O.; Cruz-Colin, J.L.; Rodriguez-Dorantes, M. Urinary microRNA-based signature improves accuracy of detection of clinically relevant prostate cancer within the prostate-specific antigen grey zone. Mol. Med. Rep. 2016, 13, 4549–4560. [Google Scholar] [CrossRef] [PubMed]
- Trams, E.G.; Lauter, C.J.; Salem, N., Jr.; Heine, U. Exfoliation of membrane ecto-enzymes in the form of micro-vesicles. Biochim. Biophys. Acta 1981, 645, 63–70. [Google Scholar] [CrossRef]
- Zhou, H.; Yuen, P.S.; Pisitkun, T.; Gonzales, P.A.; Yasuda, H.; Dear, J.W.; Gross, P.; Knepper, M.A.; Star, R.A. Collection; storage; preservation; and normalization of human urinary exosomes for biomarker discovery. Kidney Int. 2006, 69, 1471–1476. [Google Scholar] [CrossRef] [PubMed]
- Ge, Q.; Zhou, Y.; Lu, J.; Bai, Y.; Xie, X.; Lu, Z. miRNA in plasma exosome is stable under different storage conditions. Molecules 2014, 19, 1568–1575. [Google Scholar] [CrossRef] [PubMed]
- Taylor, D.D.; Gercel-Taylor, C. MicroRNA signatures of tumor-derived exosomes as diagnostic biomarkers of ovarian cancer. Gynecol. Oncol. 2008, 110, 13–21. [Google Scholar] [CrossRef] [PubMed]
- Duijvesz, D.; Versluis, C.Y.; van der Fels, C.A.; Vredenbregt-van den Berg, M.S.; Leivo, J.; Peltola, M.T.; Bangma, C.H.; Pettersson, K.S.; Jenster, G. Immuno-based detection of extracellular vesicles in urine as diagnostic marker for prostate cancer. Int. J. Cancer 2015, 137, 2869–2878. [Google Scholar] [CrossRef] [PubMed]
- Rabinowits, G.; Gercel-Taylor, C.; Day, J.M.; Taylor, D.D.; Kloecker, G.H. Exosomal microRNA: A diagnostic marker for lung cancer. Clin. Lung Cancer 2009, 10, 42–46. [Google Scholar] [CrossRef] [PubMed]
- Silva, J.; Garcia, V.; Rodriguez, M.; Compte, M.; Cisneros, E.; Veguillas, P.; Garcia, J.M.; Dominguez, G.; Campos-Martin, Y.; Cuevas, J.; et al. Analysis of exosome release and its prognostic value in human colorectal cancer. Genes Chromosomes Cancer 2012, 51, 409–418. [Google Scholar] [CrossRef] [PubMed]
- Yeh, Y.Y.; Ozer, H.G.; Lehman, A.M.; Maddocks, K.; Yu, L.; Johnson, A.J.; Byrd, J.C. Characterization of CLL exosomes reveals a distinct microRNA signature and enhanced secretion by activation of BCR signaling. Blood 2015, 125, 3297–3305. [Google Scholar] [CrossRef] [PubMed]
- Ratajczak, M.Z.; Ratajczak, J. Horizontal transfer of RNA and proteins between cells by extracellular microvesicles: 14 years later. Clin. Transl. Med. 2016, 5, 7. [Google Scholar] [CrossRef] [PubMed]
- O’Driscoll, L. Expanding on exosomes and ectosomes in cancer. N. Engl. J. Med. 2015, 372, 2359–2362. [Google Scholar] [CrossRef] [PubMed]
- Franzen, C.A.; Blackwell, R.H.; Todorovic, V.; Greco, K.A.; Foreman, K.E.; Flanigan, R.C.; Kuo, P.C.; Gupta, G.N. Urothelial cells undergo epithelial-to-mesenchymal transition after exposure to muscle invasive bladder cancer exosomes. Oncogenesis 2015, 4, e163. [Google Scholar] [CrossRef] [PubMed]
- Abd Elmageed, Z.Y.; Yang, Y.; Thomas, R.; Ranjan, M.; Mondal, D.; Moroz, K.; Fang, Z.; Rezk, B.M.; Moparty, K.; Sikka, S.C.; et al. Neoplastic reprogramming of patient-derived adipose stem cells by prostate cancer cell-associated exosomes. Stem Cells 2014, 32, 983–997. [Google Scholar] [CrossRef] [PubMed]
- Hosseini-Beheshti, E.; Choi, W.; Weiswald, L.B.; Kharmate, G.; Ghaffari, M.; Roshan-Moniri, M.; Hassona, M.D.; Chan, L.; Chin, M.Y.; Tai, I.T.; et al. Exosomes confer pro-survival signals to alter the phenotype of prostate cells in their surrounding environment. Oncotarget 2016. [Google Scholar] [CrossRef]
- Thery, C.; Amigorena, S.; Raposo, G.; Clayton, A. Isolation and characterization of exosomes from cell culture supernatants and biological fluids. Curr. Protoc. Cell Biol. 2006. [Google Scholar] [CrossRef]
- Øverbye, A.; Skotland, T.; Koehler, C.J.; Thiede, B.; Seierstad, T.; Berge, V.; Sandvig, K.; Llorente, A. Identification of prostate cancer biomarkers in urinary exosomes. Oncotarget 2015, 6, 30357–30376. [Google Scholar] [PubMed]
- Dijkstra, S.; Birker, I.L.; Smit, F.P.; Leyten, G.H.; de Reijke, T.M.; van Oort, I.M.; Mulders, P.F.; Jannink, S.A.; Schalken, J.A. Prostate cancer biomarker profiles in urinary sediments and exosomes. J. Urol. 2014, 191, 1132–1138. [Google Scholar] [CrossRef] [PubMed]
- Hendriks, R.J.; Dijkstra, S.; Jannink, S.A.; Steffens, M.G.; van Oort, I.M.; Mulders, P.F.; Schalken, J.A. Comparative analysis of prostate cancer specific biomarkers PCA3 and ERG in whole urine; urinary sediments and exosomes. Clin. Chem. Lab. Med. 2016, 54, 483–492. [Google Scholar] [CrossRef] [PubMed]
- Donovan, M.J.; Noerholm, M.; Bentink, S.; Belzer, S.; Skog, J.; O’Neill, V.; Cochran, J.S.; Brown, G.A. A molecular signature of PCA3 and ERG exosomal RNA from non-DRE urine is predictive of initial prostate biopsy result. Prostate Cancer Prostatic Dis. 2015, 18, 370–375. [Google Scholar] [CrossRef] [PubMed]
- Cheng, L.; Sun, X.; Scicluna, B.J.; Coleman, B.M.; Hill, A.F. Characterization and deep sequencing analysis of exosomal and non-exosomal miRNA in human urine. Kidney Int. 2014, 86, 433–444. [Google Scholar] [CrossRef] [PubMed]
- Cheng, L.; Sharples, R.A.; Scicluna, B.J.; Hill, A.F. Exosomes provide a protective and enriched source of miRNA for biomarker profiling compared to intracellular and cell-free blood. J. Extracell. Vesicles 2014, 3. [Google Scholar] [CrossRef] [PubMed]
- Mall, C.; Rocke, D.M.; Durbin-Johnson, B.; Weiss, R.H. Stability of miRNA in human urine supports its biomarker potential. Biomark. Med. 2013, 7, 623–631. [Google Scholar] [CrossRef] [PubMed]
- Hessvik, N.P.; Sandvigm, K.; Llorente, A. Exosomal miRNAs as Biomarkers for Prostate Cancer. Front. Genet. 2013, 4, 36. [Google Scholar] [CrossRef] [PubMed]
- Chevillet, J.R.; Kang, Q.; Ruf, I.K.; Briggs, H.A.; Vojtech, L.N.; Hughes, S.M.; Cheng, H.H.; Arroyo, J.D.; Meredith, E.K.; Gallichotte, E.N.; et al. Quantitative and stoichiometric analysis of the microRNA content of exosomes. Proc. Natl. Acad. Sci. USA 2014, 111, 14888–14893. [Google Scholar] [CrossRef] [PubMed]
- Arroyo, J.D.; Chevillet, J.R.; Kroh, E.M.; Ruf, I.K.; Pritchard, C.C.; Gibson, D.F.; Mitchell, P.S.; Bennett, C.F.; Pogosova-Agadjanyan, E.L.; Stirewalt, D.L.; et al. Argonaute2 complexes carry a population of circulating microRNAs independent of vesicles in human plasma. Proc. Natl. Acad. Sci. USA 2011, 108, 5003–5008. [Google Scholar] [CrossRef] [PubMed]
- Gallo, A.; Tandon, M.; Alevizos, I.; Illei, G.G. The majority of microRNAs detectable in serum and saliva is concentrated in exosomes. PLoS ONE 2012, 7, e30679. [Google Scholar] [CrossRef] [PubMed]
- Li, Z.; Ma, Y.Y.; Wang, J.; Zeng, X.F.; Li, R.; Kang, W.; Hao, X.K. Exosomal microRNA-141 is upregulated in the serum of prostate cancer patients. Onco. Targets Ther. 2015, 9, 139–148. [Google Scholar] [PubMed]
- Huang, X.; Yuan, T.; Liang, M.; Du, M.; Xia, S.; Dittmar, R.; Wang, D.; See, W.; Costello, B.A.; Quevedo, F.; et al. Exosomal miR-1290 and miR-375 as prognostic markers in castration-resistant prostate cancer. Eur. Urol. 2015, 67, 33–41. [Google Scholar] [CrossRef] [PubMed]
- Bryzgunova, O.E.; Zaripov, M.M.; Skvortsova, T.E.; Lekchnov, E.A.; Grigor’eva, A.E.; Zaporozhchenko, I.A.; Morozkin, E.S.; Ryabchikova, E.I.; Yurchenko, Y.B.; Voitsitskiy, V.E.; et al. Comparative Study of Extracellular Vesicles from the Urine of Healthy Individuals and Prostate Cancer Patients. PLoS ONE 2016, 11, e0157566. [Google Scholar] [CrossRef] [PubMed]
- Samsonov, R.; Shtam, T.; Burdakov, V.; Glotov, A.; Tsyrlina, E.; Berstein, L.; Nosov, A.; Evtushenko, V.; Filatov, M.; Malek, A. Lectin-induced agglutination method of urinary exosomes isolation followed by mi-RNA analysis: Application for prostate cancer diagnostic. Prostate 2016, 76, 68–79. [Google Scholar] [CrossRef] [PubMed]
- Koppers-Lalic, D.; Hackenberg, M.; Menezes, R.; Misovic, B.; Wachalska, M.; Geldof, A.; Zini, N.; Reijke, T.; Wurdinger, T.; Vis, A.; et al. Non-invasive prostate cancer detection by measuring miRNA variants (isomiRs) in urine extracellular vesicles. Oncotarget 2016. [Google Scholar] [CrossRef]
- Klotz, L. Low-risk prostate cancer can and should often be managed with active surveillance and selective delayed intervention. Nat. Clin. Pract. Urol. 2008, 5, 2–3. [Google Scholar] [CrossRef] [PubMed]
- Rubin, M.A.; Girelli, G.; Demichelis, F. Genomic Correlates to the Newly Proposed Grading Prognostic Groups for Prostate Cancer. Eur. Urol. 2016, 69, 557–560. [Google Scholar] [CrossRef] [PubMed]
- Carter, H.B.; Partin, A.W.; Walsh, P.C.; Trock, B.J.; Veltri, R.W.; Nelson, W.G.; Coffey, D.S.; Singer, E.A.; Epstein, J.I. Gleason score 6 adenocarcinoma: Should it be labeled as cancer? J. Clin. Oncol. 2012, 30, 4294–4296. [Google Scholar] [CrossRef] [PubMed]
- Kulac, I.; Haffner, M.C.; Yegnasubramanian, S.; Epstein, J.I.; de Marzo, A.M. Should Gleason 6 be labeled as cancer? Curr. Opin. Urol. 2015, 25, 238–245. [Google Scholar] [CrossRef] [PubMed]
- Scattoni, V.; Lazzeri, M.; Lughezzani, G.; de Luca, S.; Passera, R.; Bollito, E.; Randone, D.; Abdollah, F.; Capitanio, U.; Larcher, A.; et al. Head-to-head comparison of prostate health index and urinary PCA3 for predicting cancer at initial or repeat biopsy. J. Urol. 2013, 190, 496–501. [Google Scholar] [CrossRef] [PubMed]
- Stephan, C.; Jung, K.; Semjonow, A.; Schulze-Forster, K.; Cammann, H.; Hu, X.; Meyer, H.A.; Bögemann, M.; Miller, K.; Friedersdorff, F. Comparative assessment of urinary prostate cancer antigen 3 and TMPRSS2:ERG gene fusion with the serum [−2]proprostate-specific antigen-based prostate health index for detection of prostate cancer. Clin. Chem. 2013, 59, 280–288. [Google Scholar] [CrossRef] [PubMed]
- Tallon, L.; Luangphakdy, D.; Ruffion, A.; Colombel, M.; Devonec, M.; Champetier, D.; Paparel, P.; Decaussin-Petrucci, M.; Perrin, P.; Vlaeminck-Guillem, V. Comparative Evaluation of Urinary PCA3 and TMPRSS2:ERG Scores and Serum PHI in Predicting Prostate Cancer Aggressiveness. Int. J. Mol. Sci. 2014, 15, 13299–13316. [Google Scholar] [CrossRef] [PubMed]
- Nordström, T.; Vickers, A.; Assel, M.; Lilja, H.; Grönberg, H.; Eklund, M. Comparison between the four-kallikrein panel and Prostate Health Index for predicting Prostate Cancer. Eur. Urol. 2015, 68, 139–146. [Google Scholar] [CrossRef] [PubMed]
- Vedder, M.M.; de Bekker-Grob, E.W.; Lilja, H.G.; Vickers, A.J.; van Leenders, G.J.; Steyerberg, E.W.; Roobol, M.J. The added value of percentage of free to total Prostate-specific Antigen, PCA3, and a kallikrein panel to the ERSPC Risk Calculator for Prostate Cancer in prescreened Men. Eur. Urol. 2014, 66, 1109–1115. [Google Scholar] [CrossRef] [PubMed]
- Mottet, N.; Bellmunt, J.; Briers, E.; Bolla, M.; Cornford, P.; de Santis, M.; Henry, A.; Joniau, S.; Lam, T.; Mason, M.D.; et al. EAU Guideliness Prostate Cancer. Available online: http://uroweb.org/guideline/prostate-cancer/ (accessed on 9 September 2016).
- Vickers, A.J.; Eastham, J.A.; Scardino, P.T.; Lilja, H. The Memorial Sloan Kettering Cancer Center Recommendations for Prostate Cancer Screening. Urology 2016, 91, 12–18. [Google Scholar] [CrossRef] [PubMed]
- De Visschere, P.J.; Briganti, A.; Fütterer, J.J.; Ghadjar, P.; Isbarn, H.; Massard, C.; Ost, P.; Sooriakumaran, P.; Surcel, C.I.; Valerio, M.; et al. Role of multiparametric magnetic resonance imaging in early detection of prostate cancer. Insights Imaging 2016, 7, 205–214. [Google Scholar] [CrossRef] [PubMed]
- Porpiglia, F.; Cantiello, F.; de Luca, S.; Manfredi, M.; Veltri, A.; Russo, F.; Sottile, A.; Damiano, R. In-parallel comparative evaluation between multiparametric magnetic resonance imaging; prostate cancer antigen 3 and the prostate health index in predicting pathologically confirmed significant prostate cancer in men eligible for active surveillance. BJU Int. 2015. [Google Scholar] [CrossRef] [PubMed]
- Washino, S.; Okochi, T.; Saito, K.; Konishi, T.; Hirai, M.; Kobayashi, Y.; Miyagawa, T. Combination of PI-RADS score and PSA density predicts biopsy outcome in biopsy naïve patients. BJU Int. 2016. [Google Scholar] [CrossRef] [PubMed]
- Maurer, T.; Eiber, M.; Schwaiger, M.; Gschwend, J.E. Current use of PSMA-PET in prostate cancer management. Nat. Rev. Urol. 2016, 13, 226–235. [Google Scholar] [CrossRef] [PubMed]


| Reference | Body Fluid | miRNAs Analyzed | Methodology | Patients | Clinical Results |
|---|---|---|---|---|---|
| Mitchell et al. 2008 [61] | Serum | miR-100, -125b, -141, -143, -205, and -296 | qRT-PCR | 25 metastatic PCa and 25 matched healthy controls | AUC of 0.907 for miR-141 comparing PCa and healthy |
| Mihelich et al. 2015 [63] | Serum | 21 miRNAs | qRT-PCR | 100 no treated PCa (50 low-grade, 50 high-grade) and 50 BPH | A panel combining let-7a, miR-103, -451, -24, -26b, -30c, -93, -106a, -223, -874, -146a, -125b, -100, -107 and -130b distinguish high-grade PCa from low-grade PCa and BPH |
| Chen et al. 2012 [64] | Plasma | 1146 miRNAs, 8 selected miRNAs for validation study | Illumina’s Human miRNA microarray, qRT-PCR | Screening set: 17 BPH and 25 CaP. Validation set: 44 BPH, 54 healthy controls and 80 CaP | A panel combining miR-622, -1285, -30c, let-7e and let-7c discriminate CaP from BPH (AUC: 0.924) or healthy controls (AUC: 0.860) |
| Moltzahn et al. 2011 [65] | Serum | 384 miRNAs, 12 miRs selected for validation study | multiplex qRT-PCR | 12 low-risk PCa, 12 intermediate-risk PCa, 12 high-risk PCa and 12 healthy controls | AUCs: miR-106a, 0.928; miR-1274, 0.928; miR-93, 0.907; miR-223, 0.876; miR-874, 0.845; miR-1207, 0.812; miR-24: 0.778. miR-93, -106a and -24 differentiate healthy and metastatic groups |
| Salido-Guadarrama et al. 2016 [66] | urine obtained after prostate massage | 364 miRNAs | MicroRNA TaqMan Low Density Array, qRT-PCR | 73 patients with high-risk PCa and 70 patients with BPH | AUC for miR-100/200b signature was 0.738. Adding the miR-100/200b signature to a multivariate model based on age, DRE, total PSA and %fPSA the AUC increased from 0.816 to 0.876 |
| Li et al. 2015 [92] | serum exosomes | miR-141 | qRT-PCR | Serum vs. exosomes cohort: 20 PCa, 20 BPH, 20 healthy controls | Serum exosomal miR-141 was significantly higher in PCa patients compared with BPH patients and healthy controls |
| Huang et al. 2015 [93] | Plasma exosomes | let-7c, miR-30a/e, -99a, -1246, -1290, -16, -125a, and -375 | Illumina HiSeq2000 platform, qRT-PCR | Screening cohort: 23 CRPC patients. Follow-up cohort: 100 CRPC patients | Plasma exosomal miR-1290 and miR-375 were significantly associated with poor overall survival |
| Bryzgunova et al. 2016 [94] | total extracellular vesicles and exosome-enriched fractions | miR-19b, -25, -125b, and -205 | qRT-PCR | 20 healthy controls and 14 untreated PCa patients | Detection of miR-19b versus miR-16 in total vesicles and exosome-enriched fractions achieved 100%/93% and 95%/79% specificity/sensitivity in distinguishing cancer patients from healthy individuals, respectively, demonstrating the diagnostic value of urine extracellular vesicles. miR-19b in total extracellular vesicles distinguishes cancer patients from healthy individuals with a sensitivity of 93% and a specificity of 100% |
| Samsonov et al. 2016 [95] | Urinary exosomes | miR-21, -107, -141, -221, -298, -326, -375, -432, -574, -2110, -625, -301a, -191 | qRT-PCR | 35 PCa patients and 35 healthy controls | miR-21, -141 and -574 were upregulated in PCa patients compared with healthy controls in urinary exosomes |
© 2016 by the authors; licensee MDPI, Basel, Switzerland. This article is an open access article distributed under the terms and conditions of the Creative Commons Attribution (CC-BY) license (http://creativecommons.org/licenses/by/4.0/).
Share and Cite
Filella, X.; Foj, L. Prostate Cancer Detection and Prognosis: From Prostate Specific Antigen (PSA) to Exosomal Biomarkers. Int. J. Mol. Sci. 2016, 17, 1784. https://doi.org/10.3390/ijms17111784
Filella X, Foj L. Prostate Cancer Detection and Prognosis: From Prostate Specific Antigen (PSA) to Exosomal Biomarkers. International Journal of Molecular Sciences. 2016; 17(11):1784. https://doi.org/10.3390/ijms17111784
Chicago/Turabian StyleFilella, Xavier, and Laura Foj. 2016. "Prostate Cancer Detection and Prognosis: From Prostate Specific Antigen (PSA) to Exosomal Biomarkers" International Journal of Molecular Sciences 17, no. 11: 1784. https://doi.org/10.3390/ijms17111784