
Catastrophe Theory Applied to Neuropsychological Data: Nonlinear Effects of Depression on Financial Capacity in Amnestic Mild Cognitive Impairment and Dementia


Abstract
:1. Introduction
1.1. The Psychocognitive Framework
1.2. The Effects of Psychocognitive Resources on Financial Capacity
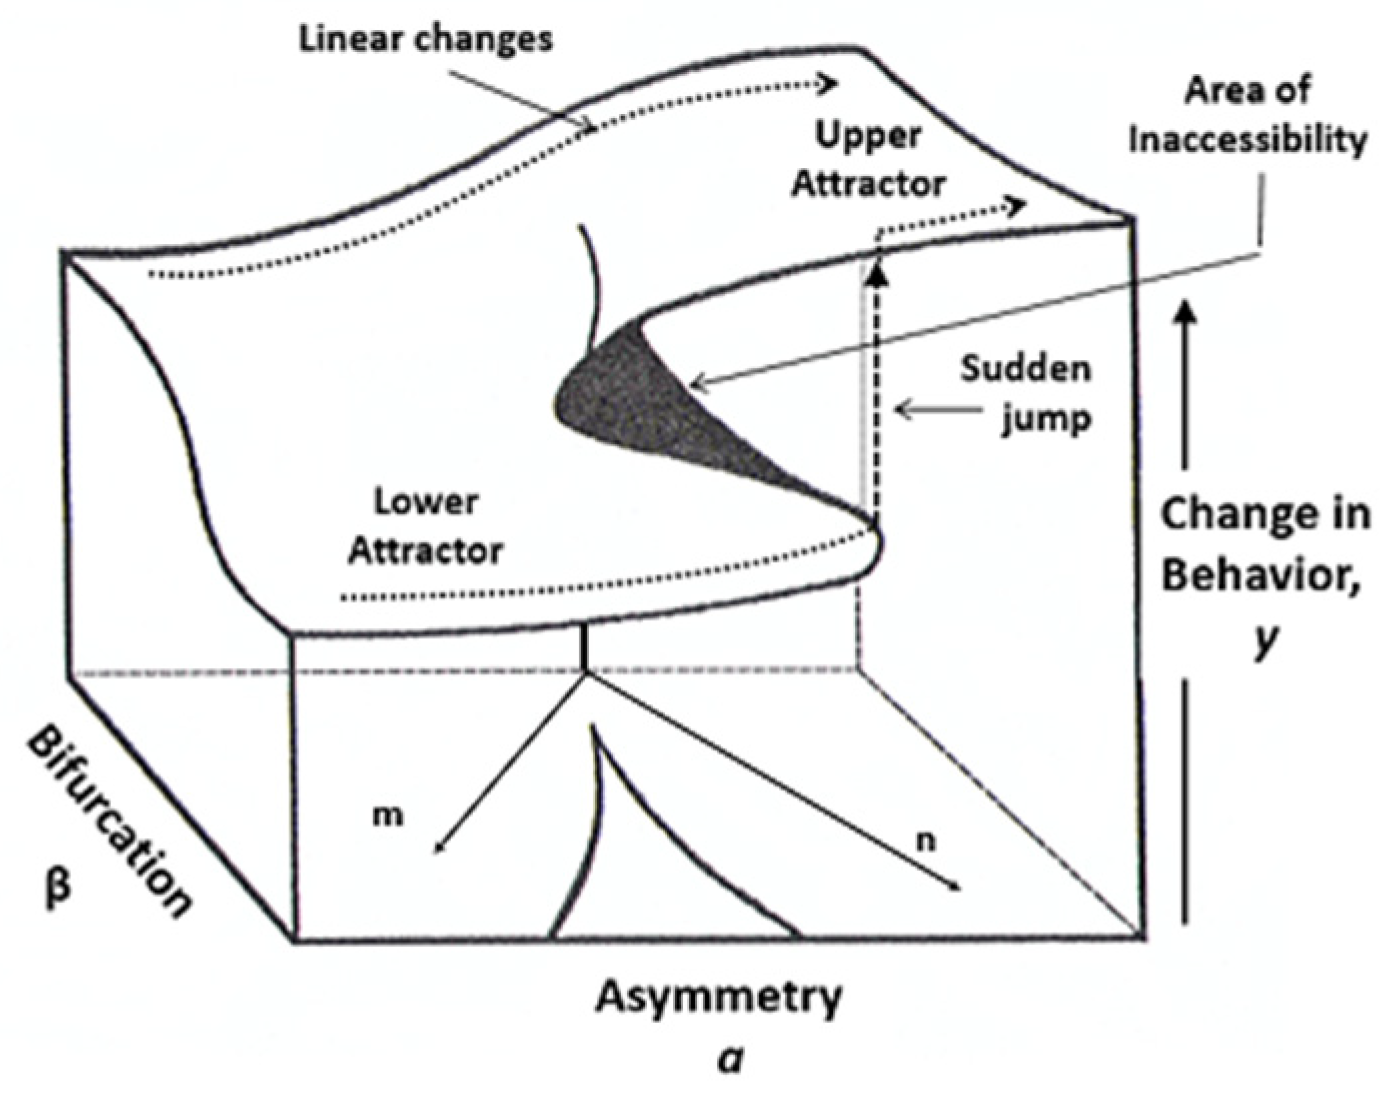
1.3. Catastrophe Theory
2. Materials and Methods
2.1. Rationale and Research Hypotheses
- (1)
- The effect of the GDS and FRSSD on the LCPLTAS can be described via a cusp catastrophe model.
- (2)
- The GDS is the main candidate for acting as a bifurcation factor.
- (3)
- Both the FRSSD and GDS could contribute to both the asymmetry and the bifurcation factors.
2.2. Participants and Measures
2.3. Method
3. Results
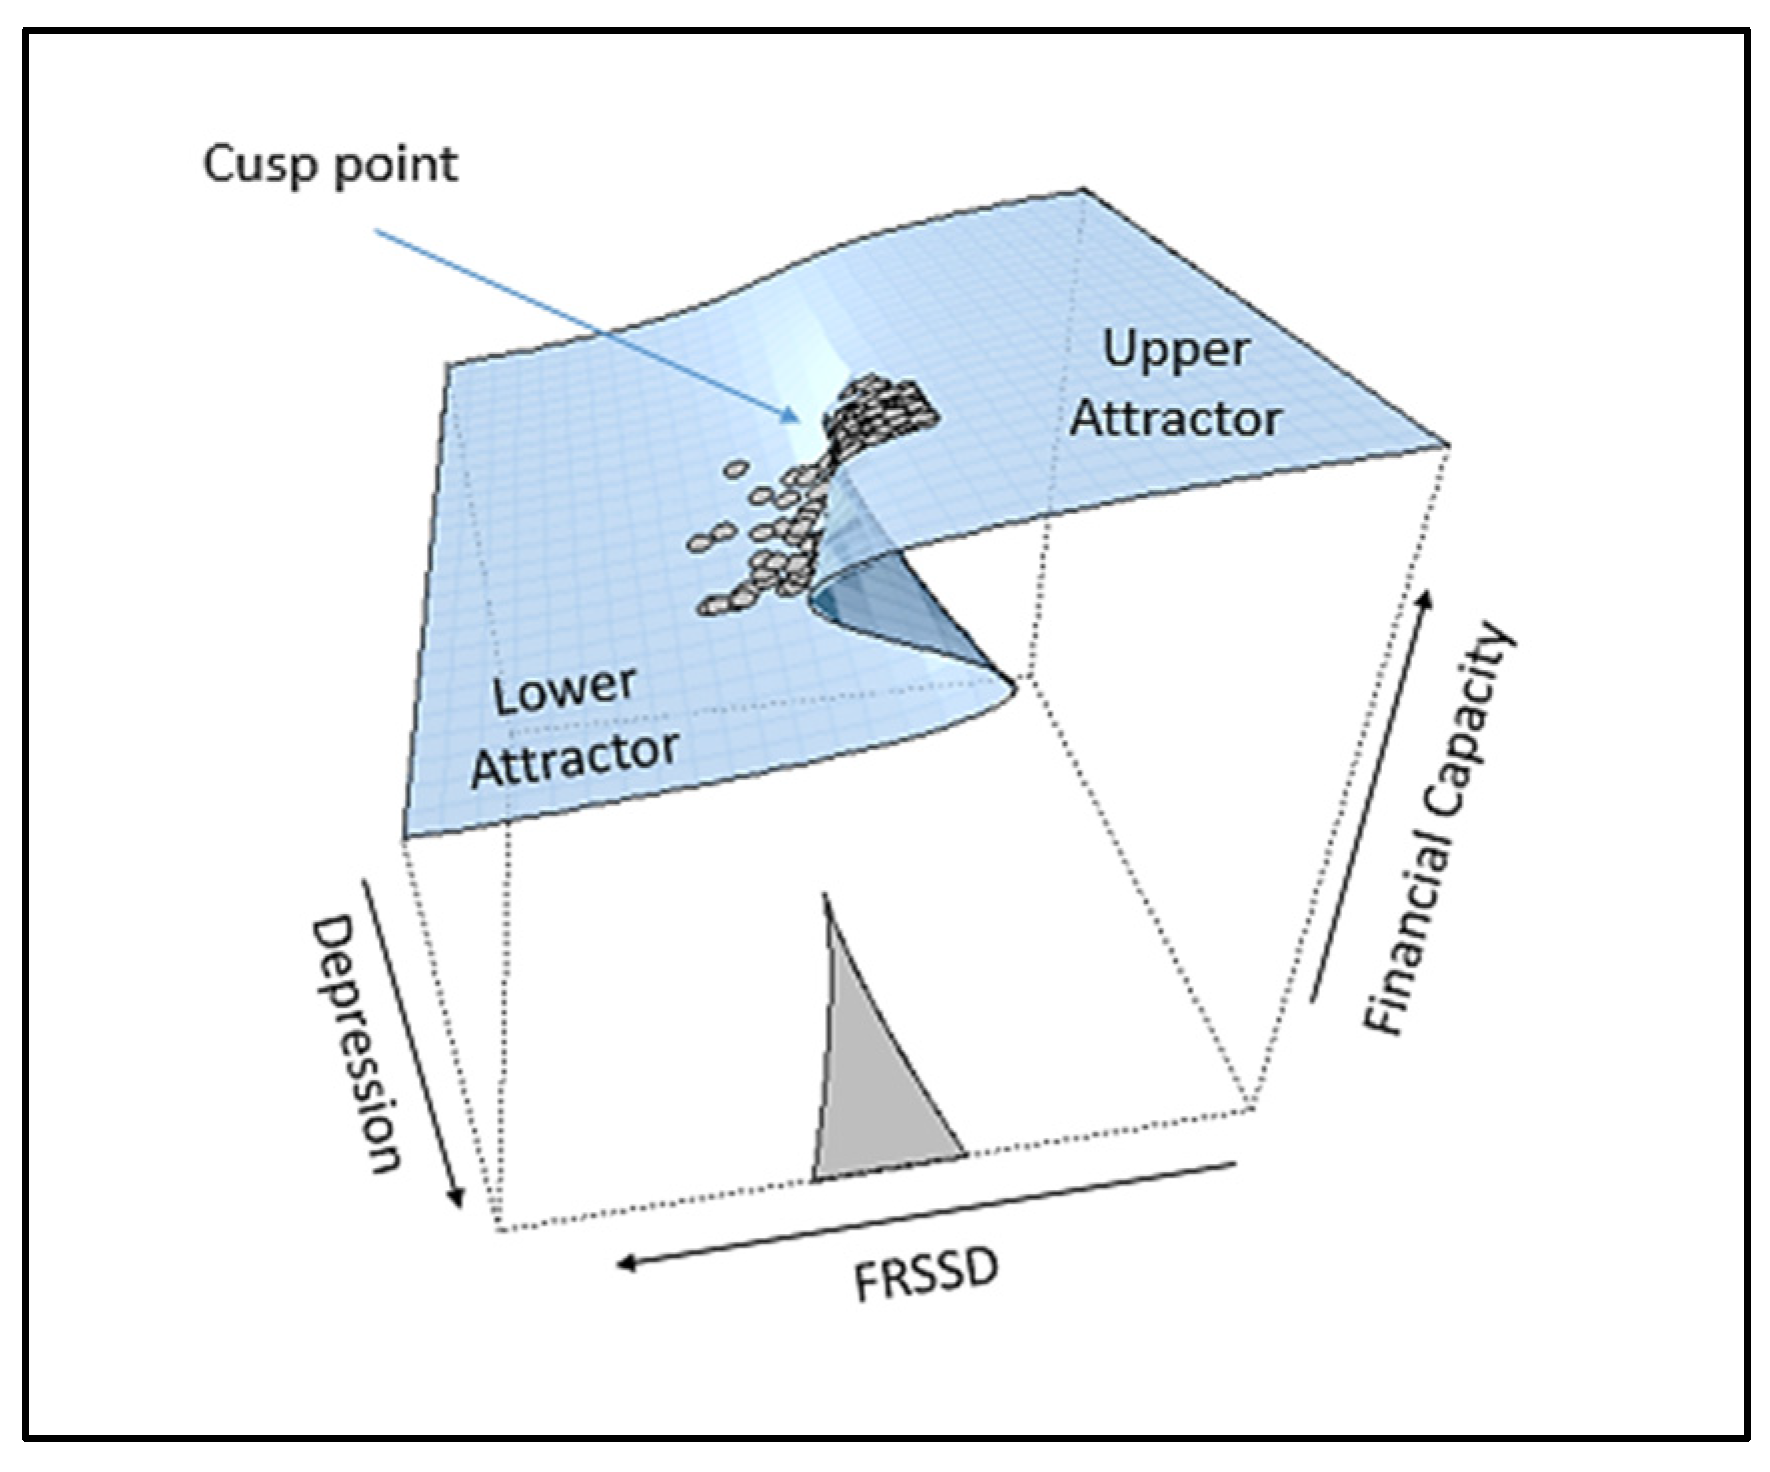
3.1. Cusp 1
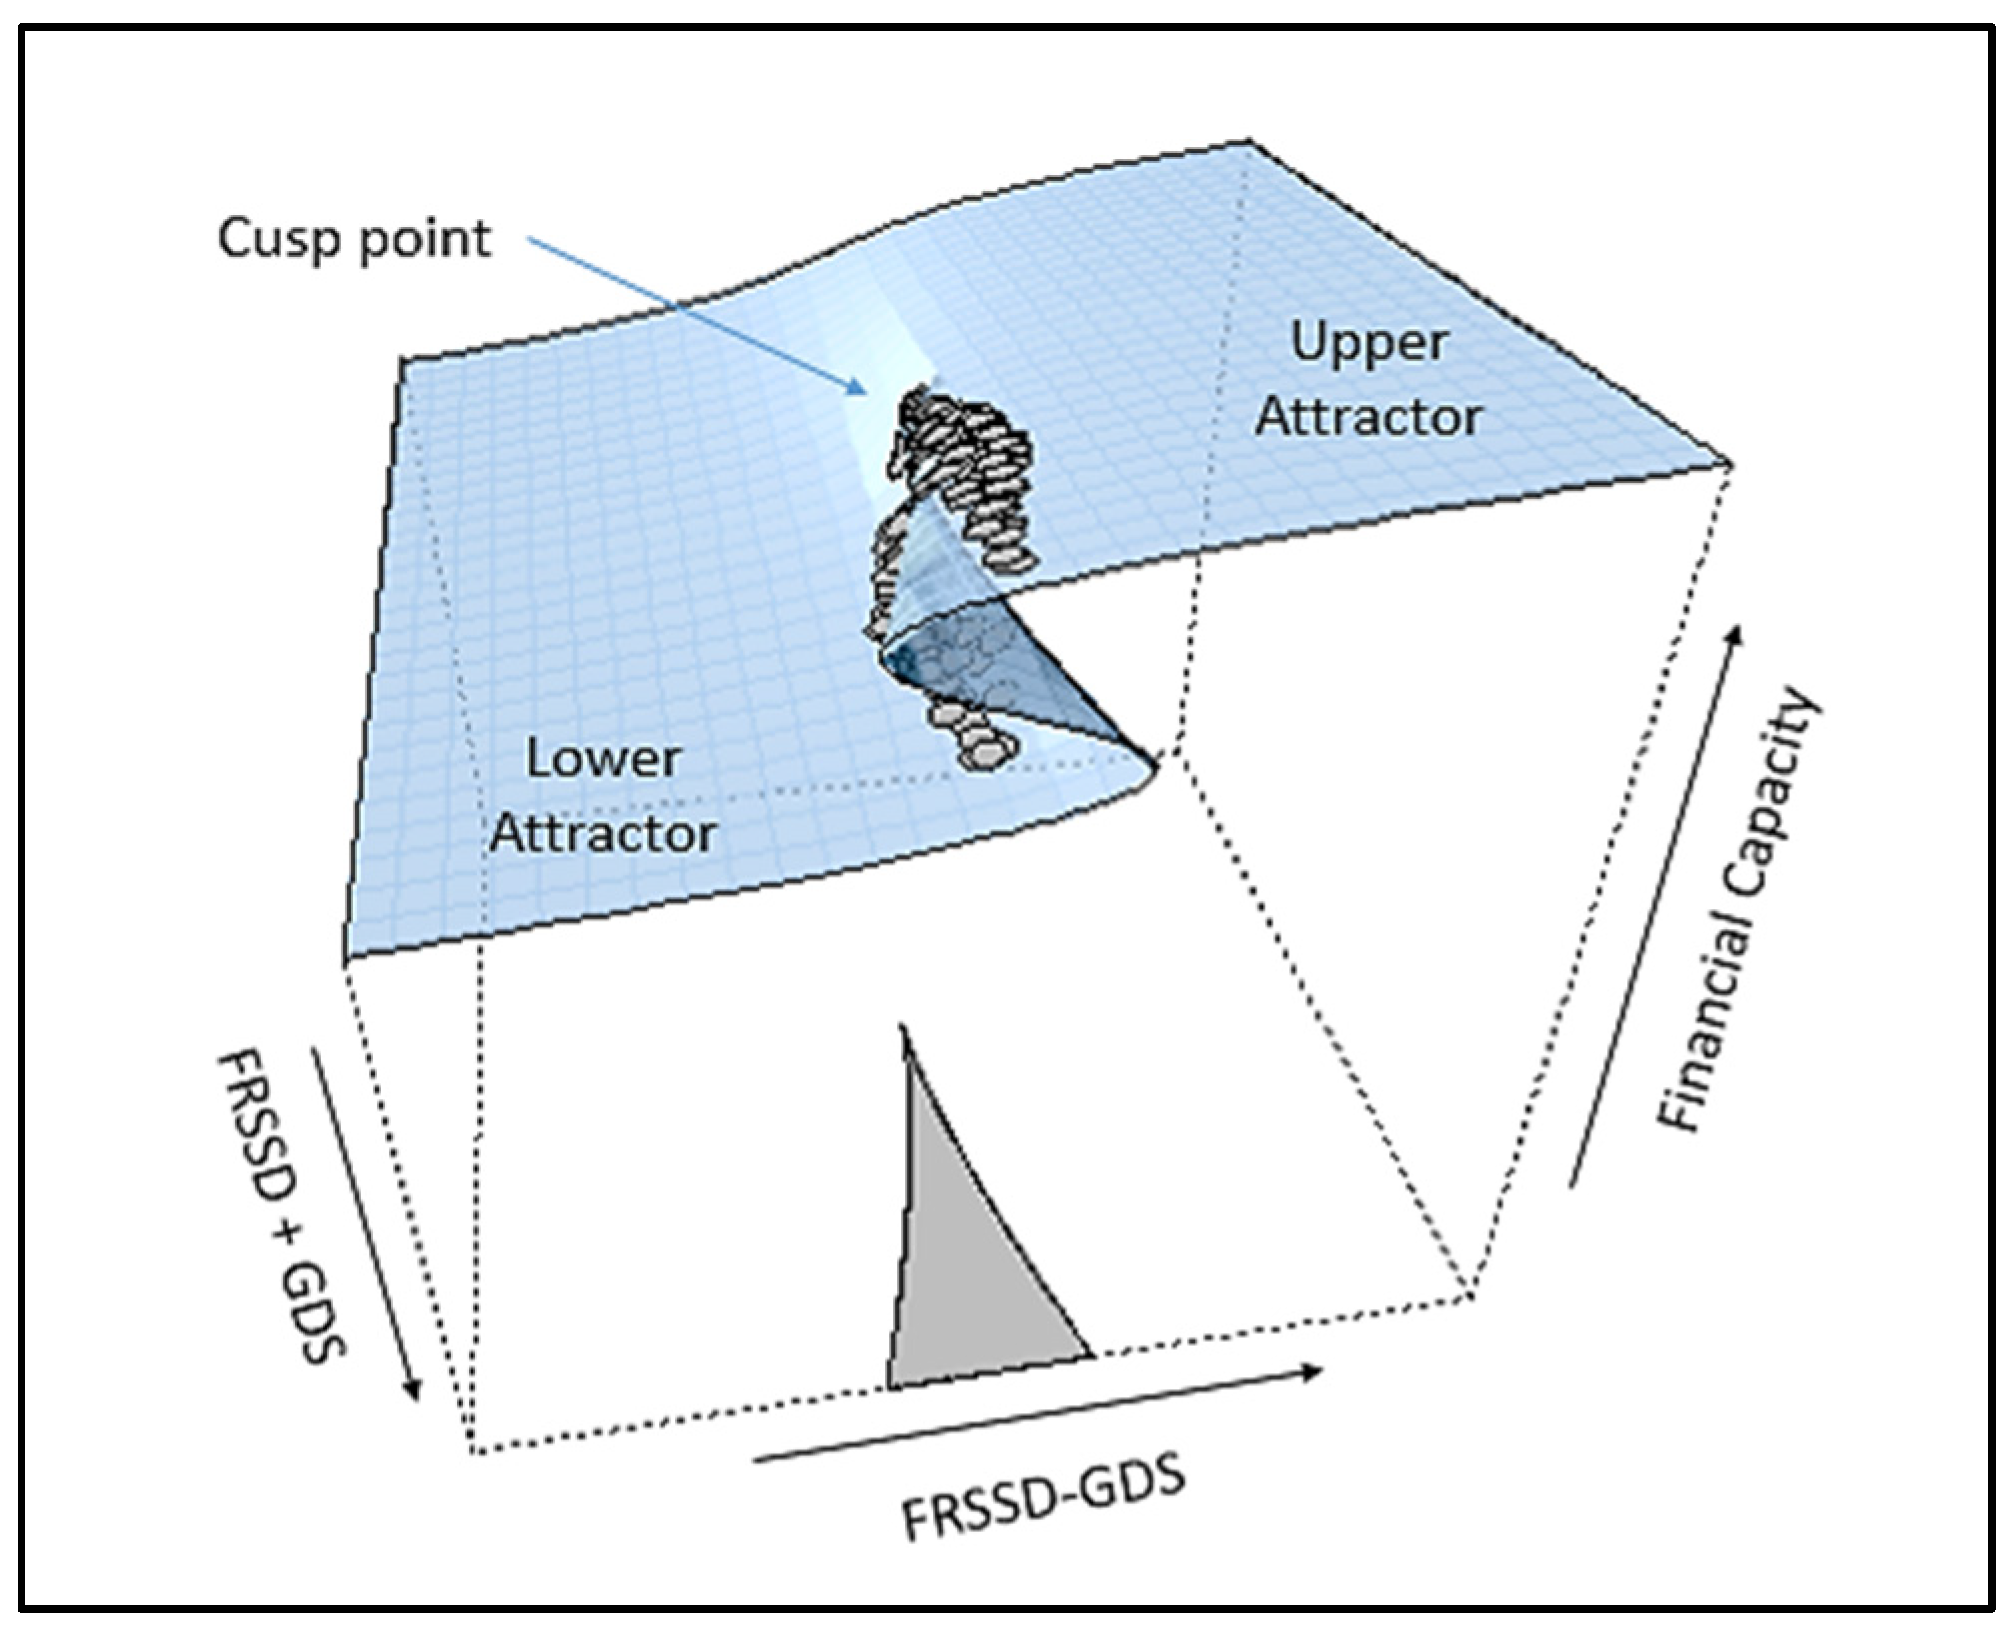
3.2. Cusp 2
3.3. Model Interpretation
4. Discussion
Author Contributions
Funding
Institutional Review Board Statement
Informed Consent Statement
Data Availability Statement
Conflicts of Interest
References
- American Psychological Association. Judicial Determination of Capacity of Older Adults in Guardianship Proceedings. A Handbook for Judges. 2008. Available online: https://www.apa.org/pi/aging/resources/guides/judges-diminished.pdf (accessed on 13 July 2022).
- Demakis, G.J. (Ed.) Civil Capacities in Clinical Neuropsychology: Research Findings and Practical Applications; Oxford University Press: New York, NY, USA, 2012. [Google Scholar]
- Marson, D.C. Loss of Financial Competency in Dementia: Conceptual and Empirical Approaches. Aging Neuropsychol. Cogn. 2001, 8, 164–181. [Google Scholar] [CrossRef]
- Marson, D.C.; Zebley, L. The Other Side of the Retirement Years: Cognitive Decline, Dementia, and Loss of Financial Capacity. J. Retire. Plan 2001, 4, 30–39. [Google Scholar]
- Marson, D.C.; Hebert, K.; Solomon, A.C. Assessing Civil Competencies in Older Adults with Dementia: Consent Capacity, Financial Capacity, and Testamentary Capacity. In Forensic Neuropsychology: A Scientific Approach; Larrabee, G.J., Ed.; Oxford University Press: New York, NY, USA, 2012; pp. 401–437. [Google Scholar]
- Marson, D.C.; Triebel, K.L.; Knight, A. Financial Capacity. In Civil Capacities in Clinical Neuropsychology: Research Findings and Practical Applications; Demakis, G.J., Ed.; Oxford University Press: New York, NY, USA, 2012; pp. 39–68. [Google Scholar]
- Marson, D.C.; Sawrie, S.M.; Snyder, S.; McInturff, B.; Stalvey, T.; Boothe, A.; Aldridge, T.; Chatterjee, A.; Harrell, L.E. Assessing Financial Capacity in Patients with Alzheimer Disease. Arch. Neurol. 2000, 57, 877–884. [Google Scholar] [CrossRef] [PubMed]
- Sousa, L.B.; Simões, M.R.; Firmino, H.; Peisah, C. Financial and Testamentary Capacity Evaluations: Procedures and Assessment Instruments underneath a Functional Approach. Int. Psychogeriatr. 2014, 26, 217–228. [Google Scholar] [CrossRef]
- Folia, V.; Kosmidis, M.H. Assessment of Memory Skills in Illiterates: Strategy Differences or Test Artifact? Clin. Neuropsychol. 2003, 17, 143–152. [Google Scholar] [CrossRef]
- Kosmidis, M.H.; Vlahou, C.H.; Panagiotaki, P.; Kiosseoglou, G. The Verbal Fluency Task in the Greek Population: Normative Data, and Clustering and Switching Strategies. J. Int. Neuropsychol. Soc. 2004, 10, 164–172. [Google Scholar] [CrossRef]
- Gerstenecker, A.; Eakin, A.; Triebel, K.; Martin, R.; Swenson-Dravis, D.; Petersen, R.C.; Marson, D.C. Age and Education Corrected Older Adult Normative Data for a Short Form Version of the Financial Capacity Instrument. Psychol. Assess. 2016, 28, 737–749. [Google Scholar] [CrossRef]
- Giannouli, V.; Stamovlasis, D.; Tsolaki, M. Exploring the Role of Cognitive Factors in a New Instrument for Elders’ Financial Capacity Assessment. J. Alzheimer’s Dis. 2018, 62, 1579–1594. [Google Scholar] [CrossRef]
- Triebel, K.L.; Martin, R.; Griffith, H.R.; Marceaux, J.; Okonkwo, O.C.; Harrell, L.; Clark, D.; Brockington, J.; Bartolucci, A.; Marson, D.C. Declining Financial Capacity in Mild Cognitive Impairment: A 1-Year Longitudinal Study. Neurology 2009, 73, 928–934. [Google Scholar] [CrossRef]
- Giannouli, V.; Tsolaki, M. Unraveling Ariadne’s Thread into the Labyrinth of AMCI. Alzheimer Dis. Assoc. Disord. 2021, 35, 363–365. [Google Scholar] [CrossRef] [PubMed]
- Giannouli, V.; Tsolaki, M. Depression and Financial Capacity Assessment in Parkinson’s Disease with Dementia: Overlooking an Important Factor? Psychiatriki 2019, 30, 66–70. [Google Scholar] [CrossRef] [PubMed]
- Giannouli, V.; Tsolaki, M. Vascular Dementia, Depression, and Financial Capacity Assessment. Alzheimer Dis. Assoc. Disord. 2021, 35, 84–87. [Google Scholar] [CrossRef] [PubMed]
- Giannouli, V.; Stamovlasis, D.; Tsolaki, M. Longitudinal Study of Depression on Amnestic Mild Cognitive Impairment and Financial Capacity. Clin. Gerontol. 2022, 45, 708–714. [Google Scholar] [CrossRef] [PubMed]
- Stamovlasis, D. Methodological and Epistemological Issues on Linear Regression Applied to Psychometric Variables in Problem Solving: Rethinking Variance. Chem. Educ. Res. Pract. 2010, 11, 59–68. [Google Scholar] [CrossRef]
- Giannouli, V.; Tsolaki, M. Is Depression or Apathy Playing a Key Role in Predicting Financial Capacity in Parkinson’s Disease with Dementia and Frontotemporal Dementia? Brain Sci. 2021, 11, 785. [Google Scholar] [CrossRef]
- Giannouli, V.; Tsolaki, M. Mild Alzheimer Disease, Financial Capacity, and the Role of Depression. Alzheimer Dis. Assoc. Disord. 2021, 35, 360–362. [Google Scholar] [CrossRef]
- Prigogine, I.; Stengers, I. Order Out of Chaos: Man’s New Dialogue with Nature; Bantam: New York, NY, USA, 1984. [Google Scholar]
- Glass, L. Dynamical Disease: Challenges for Nonlinear Dynamics and Medicine. Chaos Interdiscip. J. Nonlinear Sci. 2015, 25, 097603. [Google Scholar] [CrossRef]
- Guastello, S.J. Managing Emergent Phenomena: Nonlinear Dynamics in Work Organizations; Psychology Press: Mahwah, NJ, USA, 2002; ISBN 1135671958. [Google Scholar]
- Burge, S.K.; Katerndahl, D.A.; Wood, R.C.; Becho, J.; Ferrer, R.L.; Talamantes, M. Using Complexity Science to Examine Three Dynamic Patterns of Intimate Partner Violence. Fam. Syst. Health 2016, 34, 4–14. [Google Scholar] [CrossRef]
- Antoniou, F.; AlKhadim, G.; Stamovlasis, D.; Vasiou, A. The Regulatory Properties of Anger under Different Goal Orientations: The Effects of Normative and Outcome Goals. BMC Psychol. 2022, 10, 106. [Google Scholar] [CrossRef]
- Navarro, J.; Rueff-Lopes, R.; Rico, R. New Nonlinear and Dynamic Avenues for the Study of Work and Organizational Psychology: An Introduction to the Special Issue. Eur. J. Work. Organ. Psychol. 2020, 29, 477–482. [Google Scholar] [CrossRef]
- Sideridis, G.D.; Stamovlasis, D.; Antoniou, F. Reading Achievement, Mastery, and Performance Goal Structures Among Students with Learning Disabilities: A Nonlinear Perspective. J. Learn. Disabil. 2016, 49, 631–643. [Google Scholar] [CrossRef]
- Stamovlasis, D.; Vaiopoulou, J. The Role of Dysfunctional Myths in a Decision-Making Process under Bounded Rationality: A Complex Dynamical Systems Perspective. Nonlinear Dyn. Psychol. Life Sci. 2017, 21, 267–288. [Google Scholar]
- Martin, C.; Sturmberg, J. Universal Health (UHC) and Primary Health Care (PHC)—A Complex Dynamic Endeavor. J. Eval. Clin. Pract. 2022, 28, 332–334. [Google Scholar] [CrossRef] [PubMed]
- Ma, Y.; Sun, S.; Peng, C.-K. Applications of Dynamical Complexity Theory in Traditional Chinese Medicine. Front. Med. 2014, 8, 279–284. [Google Scholar] [CrossRef]
- Caffrey, L.; Wolfe, C.; McKevitt, C. Embedding Research in Health Systems: Lessons from Complexity Theory. Health Res. Policy Syst. 2016, 14, 54. [Google Scholar] [CrossRef] [PubMed]
- Brochet, T.; Lapuyade-Lahorgue, J.; Huat, A.; Thureau, S.; Pasquier, D.; Gardin, I.; Modzelewski, R.; Gibon, D.; Thariat, J.; Grégoire, V.; et al. A Quantitative Comparison between Shannon and Tsallis–Havrda–Charvat Entropies Applied to Cancer Outcome Prediction. Entropy 2022, 24, 436. [Google Scholar] [CrossRef] [PubMed]
- Thom, R. Structural Stability and Morphogenesis; Benjamin-Cummings Press: Reading, MA, USA, 1975; ISBN 9780429493027. [Google Scholar]
- Arnol’d, V.I. Geometrical Methods in the Theory of Ordinary Differential Equations; Springer: Berlin/Heidelberg, Germany, 1988. [Google Scholar]
- Castrigiano, D.P.L.; Hayes, S.A. Catastrophe Theory; Westview Press: Boulder, CO, USA, 2004; ISBN 9780813341255. [Google Scholar]
- Cobb, L. Stochastic Catastrophe Models and Multimodal Distributions. Behav. Sci. 1978, 23, 360–374. [Google Scholar] [CrossRef]
- Gilmore, R. Catastrophe Theory for Scientists and Engineers; Dover Publications: New York, NY, USA, 1993. [Google Scholar]
- Nicolis, G.; Nicolis, C. Foundations of Complex Systems; World Scientific Publishing Co.: Singapore, 2007; ISBN 9789812775658. [Google Scholar]
- Nicolis, G.; Prigogine, I. Self-Organization in Nonequilibrium Systems; Wiley: New York, NY, USA, 1977. [Google Scholar]
- Prigogine, I. Introduction to Thermodynamics of Irreversible Processes; Wiley: New York, NY, USA, 1961. [Google Scholar]
- Haken, H. Information and Self Organization: A Macroscopic Approach to Complex Systems; Springer: Berlin/Heidelberg, Germany, 1988. [Google Scholar]
- Haken, H. Synergetics: An Introduction: Nonequilibrium Phase Transition and Self-Organization in Physics, Chemistry, and Biology; Springer: Berlin/Heidelberg, Germany, 1983. [Google Scholar]
- Poston, T.; Stewart, I. Catastrophe Theory and Its Applications; Dover Publications: New York, NY, USA, 1978. [Google Scholar]
- Stamovlasis, D. Nonlinear Dynamics and Neo-Piagetian Theories in Problem Solving: Perspectives on a New Epistemology and Theory Development. Nonlinear Dyn. Psychol. Life Sci. 2011, 15, 145–173. [Google Scholar]
- Vaiopoulou, J.; Tsikalas, T.; Stamovlasis, D.; Papageorgiou, G. Nonlinear Dynamic Effects of Convergent and Divergent Thinking in Conceptual Change Process: Empirical Evidence from Primary Education. Nonlinear Dyn. Psychol. Life Sci. 2021, 25, 335–355. [Google Scholar]
- Fountoulakis, K.N.; Tsolaki, M.; Iacovides, A.; Yesavage, J.A.; O’Hara, R.; Kazis, A.; Ierodiakonou, C. The Validation of the Short Form of the Geriatric Depression Scale (GDS) in Greece. Aging Clin. Exp. Res. 1999, 11, 367–372. [Google Scholar] [CrossRef]
- Hutton, J.T. Alzheimer’s Disease. In Conn’s Current Therapy; Rakel, R.E., Ed.; W. B. Saunders: Philadelphia, PA, USA, 1990; pp. 778–781. [Google Scholar]
- Giannouli, V.; Tsolaki, M. Financial Incapacity of Patients with Mild Alzheimer’s Disease: What Neurologists Need to Know about Where the Impairment Lies. Neurol. Int. 2022, 14, 90–98. [Google Scholar] [CrossRef] [PubMed]
- Lazarou, I.; Moraitou, D.; Papatheodorou, M.; Vavouras, I.; Lokantidou, C.; Agogiatou, C.; Gialaoutzis, M.; Nikolopoulos, S.; Stavropoulos, T.G.; Kompatsiaris, I.; et al. Adaptation and Validation of the Memory Alteration Test (M@T) in Greek Middle-Aged, Older, and Older-Old Population with Subjective Cognitive Decline and Mild Cognitive Impairment. J. Alzheimer’s Dis. 2021, 84, 1219–1232. [Google Scholar] [CrossRef] [PubMed]
- Tsolaki, M.; Fountoulakis, K.; Nakopoulou, E.; Kazis, A.; Mohs, R.C. Alzheimer’s Disease Assessment Scale: The Validation of the Scale in Greece in Elderly Demented Patients and Normal Subjects. Dement. Geriatr. Cogn. Disord. 1997, 8, 273–280. [Google Scholar] [CrossRef] [PubMed]
- Papadopoulos, F.C.; Petridou, E.; Argyropoulou, S.; Kontaxakis, V.; Dessypris, N.; Anastasiou, A.; Katsiardani, K.P.; Trichopoulos, D.; Lyketsos, C. Prevalence and Correlates of Depression in Late Life: A Population Based Study from a Rural Greek Town. Int. J. Geriatr. Psychiatry 2005, 20, 350–357. [Google Scholar] [CrossRef]
- Cobb, L. An Introduction to Cusp Surface Analysis; Corrales Software Development: Carbondale, CO, USA, 1998. [Google Scholar]
- Grasman, R.; van der Maas, H.L.J.; Wagenmakers, E.-J. Fitting the Cusp Catastrophe in R: A Cusp Package Primer. J. Stat. Softw. 2009, 32, 1–27. [Google Scholar] [CrossRef]
- Oliva, T.A.; Desarbo, W.S.; Day, D.L.; Jedidi, K. GEMCAT: A General Multivariate Methodology for Estimating Catastrophe Models. Behav. Sci. 1987, 32, 121–137. [Google Scholar] [CrossRef]
- Guastello, S.J. Discontinuities and Catastrophes with Polynomial Regression. In Nonlinear Dynamics Systems Analysis for the Behavioral Sciences Using Real Data; Guastello, S.J., Gregson, R.A.M., Eds.; CRC Press: Boca Raton FL, USA, 2011; pp. 252–280. [Google Scholar]
- Stamovlasis, D. Catastrophe Theory: Methodology, Epistemology, and Applications in Learning Science. In Complex Dynamical Systems in Education: Concepts, Methods and Applications; Koopmans, M., Stamovlasis, D., Eds.; Springer: Cham, Switzerland, 2016; pp. 141–175. ISBN 9783319275772. [Google Scholar]
- Chen, D.-G.; Chen, X.; Lin, F.; Tang, W.; Lio, Y.; Guo, Y. Cusp Catastrophe Polynomial Model: Power and Sample Size Estimation. Open J. Stat. 2014, 4, 803–813. [Google Scholar] [CrossRef]
- Zeeman, E.C. Catastrophe Theory. Sci. Am. 1976, 234, 65–83. [Google Scholar] [CrossRef]
- van der Maas, H.L.J.; Molenaar, P.C.M. Stagewise Cognitive Development: An Application of Catastrophe Theory. Psychol. Rev. 1992, 99, 395–417. [Google Scholar] [CrossRef]
- van der Maas, H.L.J.; Kolstein, R.; van der Pligt, J. Sudden Transitions in Attitudes. Sociol. Methods Res. 2003, 32, 125–152. [Google Scholar] [CrossRef]
- Haken, H.; Portugali, J. Information and Selforganization: A Unifying Approach and Applications. Entropy 2016, 18, 197. [Google Scholar] [CrossRef]
- Haken, H.; Portugali, J. Information and Self-Organization II: Steady State and Phase Transition. Entropy 2021, 23, 707. [Google Scholar] [CrossRef] [PubMed]
- Koopmans, M. Ergodicity and the Merits of the Single Case. In Complex Dynamical Systems in Education: Concepts, Methods and Applications; Koopmans, M., Stamovlasis, D., Eds.; Springer International Publishing: Cham, Switzerland, 2016; pp. 119–139. ISBN 9783319275772. [Google Scholar]
- Koopmans, M. Using Time Series to Analyze Long-Range Fractal Patterns; SAGE Publications: Los Angeles, CA, USA, 2021. [Google Scholar]
- Tschacher, W.; Haken, H. The Process of Psychotherapy: Causation and Chance; Springer: Cham, Switzerland, 2019; ISBN 9783030127473. [Google Scholar]
- Guastello, S.J.; Peressini, A.F. Development of a Synchronization Coefficient for Biosocial Interactions in Groups and Teams. Small Group Res. 2017, 48, 3–33. [Google Scholar] [CrossRef]
- Avdi, E.; Paraskevopoulos, E.; Lagogianni, C.; Kartsidis, P.; Plaskasovitis, F. Studying Physiological Synchrony in Couple Therapy through Partial Directed Coherence: Associations with the Therapeutic Alliance and Meaning Construction. Entropy 2022, 24, 517. [Google Scholar] [CrossRef] [PubMed]
- Orsucci, F.; Petrosino, R.; Paoloni, G.; Canestri, L.; Conte, E.; Reda, M.A.; Fulcheri, M. Prosody and Synchronization in Cognitive Neuroscience. EPJ Nonlinear Biomed. Phys. 2013, 1, 6. [Google Scholar] [CrossRef]
- Molenaar, P.C.M. A Manifesto on Psychology as Idiographic Science: Bringing the Person Back into Scientific Psychology, This Time Forever. Meas. Interdiscip. Res. Perspect. 2004, 2, 201–218. [Google Scholar] [CrossRef]
- Epskamp, S.; Rhemtulla, M.; Borsboom, D. Generalized Network Psychometrics: Combining Network and Latent Variable Models. Psychometrika 2017, 82, 904–927. [Google Scholar] [CrossRef]
- Epskamp, S.; Maris, G.; Waldorp, L.J.; Borsboom, D. Network Psychometrics. In The Wiley Handbook of Psychometric Testing: A Multidisciplinary Reference on Survey, Scale and Test Development; Irwing, P., Booth, T., Hughes, D.J., Eds.; Wiley: New York, NY, USA, 2018; pp. 953–986. [Google Scholar]
- Cramer, A.O.J.; van Borkulo, C.D.; Giltay, E.J.; van der Maas, H.L.J.; Kendler, K.S.; Scheffer, M.; Borsboom, D. Major Depression as a Complex Dynamic System. PLoS ONE 2016, 11, e0167490. [Google Scholar] [CrossRef]


| Mean | Std. Deviation | Minimum | Maximum | |
|---|---|---|---|---|
| LCPLTAS | 160.605 | 63.550 | 0.000 | 212.000 |
| sLCPLTAS | 108.708 | 43.850 | 0.000 | 144.000 |
| MMSE | 24.892 | 6.538 | 0.000 | 30.000 |
| GDS | 2.725 | 3.561 | 0.000 | 21.000 |
| FRSSD | 4.641 | 6.454 | 0.000 | 32.000 |
| Age | 72.555 | 8.061 | 45.000 | 98.000 |
| Variable | LCPLTAS | sLCPLTAS | FRSSD | GDS | MMSE | Age |
|---|---|---|---|---|---|---|
| 1. LCPLTAS | 1 | |||||
| 2. sLCPLTAS | 0.998 *** | 1 | ||||
| 3. FRSSD | −0.792 *** | −0.789 *** | 1 | |||
| 4. GDS | −0.220 *** | −0.223 *** | 0.281 *** | 1 | ||
| 5. MMSE | 0.944 *** | 0.942 *** | −0.824 *** | −0.201 *** | 1 | |
| 6. Age | −0.288 *** | −0.289 *** | 0.246 *** | −0.018 | −0.291 *** | 1 |
| Model | b | seb | Z-Value | ||
|---|---|---|---|---|---|
| Cusp 1 | |||||
| a(Intercept) | 1.0628 | 0.1248 | 8.52 *** | ||
| a[FRSSD] | Functional Rating Scale for Symptoms of Dementia | −1.4557 | 0.1468 | −9.91 *** | |
| b(Intercept) | −1.5417 | 0.2165 | −7.12 ** | ||
| b[GDS] | Depression Scale | −0.3493 | 0.0912 | −3.83 *** | |
| w(Intercept) | 0.8830 | 0.0355 | 24.87 *** | ||
| w(FC) | Financial Capacity | 1.2059 | 0.02921 | 41.28 *** | |
| Models’ fit statistics (chi-square test of linear vs. cusp model: χ2 = 247.0, df = 2, p < 0.001) | |||||
| Model | Pseudo-R2 | Npar | AIC | AICc | BIC |
| Linear model | 0.61 | 4 | 781.203 | 781.300 | 797.345 |
| Logistic model | 0.61 | 5 | 744.210 | 744.351 | 764.388 |
| Cusp model | 0.63 | 6 | 538.190 | 538.392 | 562.403 |
| Note: *** p < 0.001, ** p < 0.01, * p < 0.05, † p < 0.05 (one-tailed); ns = non-significant. | |||||
| Model | b | seb | Z-Value | ||
|---|---|---|---|---|---|
| Cusp 2 | |||||
| a(Intercept) | −0.1606 | 0.1096 | −1.46 ns | ||
| a[FRSSD − GDS] | Functional Rating Scale for Symptoms of Dementia | 1.3450 | 0.2181 | 6.19 *** | |
| b(Intercept) | 0.98163 | 0.3388 | 2.90 ** | ||
| b[GDS + FRSSD] | Depression Scale | 1.2804 | 0.1886 | 6.79 *** | |
| w(Intercept) | 0.02605 | 0.0528 | 0.50 ns | ||
| w(FC) | Financial Capacity | 1.02722 | 0.0472 | 21.75 *** | |
| Models’ fit statistics (chi-square test of linear vs. cusp model: χ2 = 147.6, df = 2, p < 0.001) | |||||
| Model | Pseudo-R2 | Npar | AIC | AICc | BIC |
| Linear model | 0.39 | 4 | 414.767 | 415.043 | 426.809 |
| Logistic model | 0.47 | 5 | 395.039 | 395.456 | 410.093 |
| Cusp model | 0.63 | 6 | 271.213 | 271.801 | 289.277 |
| Note: *** p < 0.001, ** p < 0.01, * p < 0.05, † p < 0.05 (one-tailed); ns = non-significant. | |||||
Publisher’s Note: MDPI stays neutral with regard to jurisdictional claims in published maps and institutional affiliations. |
© 2022 by the authors. Licensee MDPI, Basel, Switzerland. This article is an open access article distributed under the terms and conditions of the Creative Commons Attribution (CC BY) license (https://creativecommons.org/licenses/by/4.0/).
Share and Cite
Stamovlasis, D.; Giannouli, V.; Vaiopoulou, J.; Tsolaki, M. Catastrophe Theory Applied to Neuropsychological Data: Nonlinear Effects of Depression on Financial Capacity in Amnestic Mild Cognitive Impairment and Dementia. Entropy 2022, 24, 1089. https://doi.org/10.3390/e24081089
Stamovlasis D, Giannouli V, Vaiopoulou J, Tsolaki M. Catastrophe Theory Applied to Neuropsychological Data: Nonlinear Effects of Depression on Financial Capacity in Amnestic Mild Cognitive Impairment and Dementia. Entropy. 2022; 24(8):1089. https://doi.org/10.3390/e24081089
Chicago/Turabian StyleStamovlasis, Dimitrios, Vaitsa Giannouli, Julie Vaiopoulou, and Magda Tsolaki. 2022. "Catastrophe Theory Applied to Neuropsychological Data: Nonlinear Effects of Depression on Financial Capacity in Amnestic Mild Cognitive Impairment and Dementia" Entropy 24, no. 8: 1089. https://doi.org/10.3390/e24081089