Antibody Tests in Detecting SARS-CoV-2 Infection: A Meta-Analysis
by
 ,
,
Panagiota I. Kontou
1,†, 
Georgia G. Braliou
1,† ,
,
Niki L. Dimou
2,
Georgios Nikolopoulos
3 and 
Pantelis G. Bagos
1,* 1
Department of Computer Science and Biomedical Informatics, University of Thessaly, Papasiopoulou 2-4, 35131 Lamia, Greece
2
International Agency for Research on Cancer, 69372 Lyon, France
3
Medical School, University of Cyprus, 1678 Nicosia, Cyprus
*
Author to whom correspondence should be addressed.
†
These authors contributed equally to this work.
Diagnostics 2020, 10(5), 319; https://doi.org/10.3390/diagnostics10050319
Submission received: 27 April 2020
/
Revised: 13 May 2020
/
Accepted: 14 May 2020
/
Published: 19 May 2020
(This article belongs to the Collection Virus Diagnostic Methods and Techniques: Learning from the COVID-19 Global Outbreak)
Abstract
:The emergence of Coronavirus disease 2019 (COVID-19) caused by SARS-CoV-2 made imperative the need for diagnostic tests that can identify the infection. Although Nucleic Acid Test (NAT) is considered to be the gold standard, serological tests based on antibodies could be very helpful. However, individual studies are usually inconclusive, thus, a comparison of different tests is needed. We performed a systematic review and meta-analysis in PubMed, medRxiv and bioRxiv. We used the bivariate method for meta-analysis of diagnostic tests pooling sensitivities and specificities. We evaluated IgM and IgG tests based on Enzyme-linked immunosorbent assay (ELISA), Chemiluminescence Enzyme Immunoassays (CLIA), Fluorescence Immunoassays (FIA), and the Lateral Flow Immunoassays (LFIA). We identified 38 studies containing data from 7848 individuals. Tests using the S antigen are more sensitive than N antigen-based tests. IgG tests perform better compared to IgM ones and show better sensitivity when the samples were taken longer after the onset of symptoms. Moreover, a combined IgG/IgM test seems to be a better choice in terms of sensitivity than measuring either antibody alone. All methods yield high specificity with some of them (ELISA and LFIA) reaching levels around 99%. ELISA- and CLIA-based methods perform better in terms of sensitivity (90%–94%) followed by LFIA and FIA with sensitivities ranging from 80% to 89%. ELISA tests could be a safer choice at this stage of the pandemic. LFIA tests are more attractive for large seroprevalence studies but show lower sensitivity, and this should be taken into account when designing and performing seroprevalence studies.
1. Introduction
In December 2019, a pneumonia outbreak occurred in Wuhan in China due to a new coronavirus that was later officially named SARS-CoV-2 by the World Health Organization (WHO) [1,2]. The disease rapidly spread worldwide, and on February 24, WHO declared COVID-19 (coronavirus disease 2019) a pandemic [3]. SARS-CoV-2 shares pathogenicity features with the human coronaviruses SARS-CoV and MERS-CoV [4], but the incubation period is longer (up to 14 days) [3]. Most patients exhibit mild symptoms, and only a few cases progress to severe or critical disease. Risk factors for severe disease include older age [5] and comorbidities such as hypertension, diabetes, chronic obstructive pulmonary disease (COPD), and cardiovascular disease [6], whereas a higher incidence in males has also been reported [7].
The genome of SARS-CoV-2 is predicted to encode 4 structural proteins (including Spike (S), and Nucleocapsid (N)), 8 accessory, and 15 non-structural proteins [8]. The S protein comprises the receptor binding domain (RBD), which is responsible for binding to the ACE2 membrane receptor of the host cell [9,10,11,12]. The N protein is the structural helical nucleocapsid protein of the virus and is important for transcription and viral replication and packaging [13,14]. The S and N proteins show high antigenicity [15,16,17].
Although rigorous public health measures have been taken globally including mass quarantine, COVID-19 incidence is rising leading to 2,402,980 laboratory-confirmed cases and over 165,641 deaths worldwide by April 20. Due to the ongoing COVID 19 outbreak, there is an urgent global need for diagnostic tests. WHO suggests that detection of SARS-CoV-2 nucleic acid (E gene followed by the RdRp gene) is performed in respiratory samples [18,19,20], while the United States Centers for Disease Control (CDC) recommends the nucleocapsid protein targets N1 and N2 [21]. However, the global shortage of diagnostic tests and especially of swabs for collecting respiratory samples, the frequency of false negative results, and the inability of these tests to be performed in a balk and quick manner that is often required at hospital admission highlight the necessity to develop additional testing methods.
COVID-19 serological tests are mainly based on detecting specific antibodies against SARS-CoV-2 antigens. IgM are the first antibodies that appear in response to the initial exposure to an antigen, while IgG appear later and are more specific to the antigen. COVID-19 serological tests for IgG and IgM have been developed by many laboratories and companies and can be useful in various ways: (a) they can confirm Nucleic Acid Tests (NAT) results or detect infected people who were negative according to NATs [22]; (b) they are cheap, quick, and amenable to rapid broad screening at points of care (POC); (c) blood/serum samples that are used show reduced heterogeneity compared to respiratory specimens; and (d) blood/serum sampling encompasses lower risk for health care workers compared to respiratory sampling where patients are more likely to disperse the virus. Additionally, serological assays can help determine the immune status of individuals [15] and estimate herd immunity.
Since all the above serological tests have been developed rapidly and under urgent market demands, they are poorly validated with clinical samples in everyday practice. Within several studies, these tests show divergence in sensitivity and specificity that may deviate from what the manufacturers report. Given the importance of serological tests in combating COVID-19, this systematic review and meta-analysis aims to summarize the available evidence on the performance of all available antibody-tests for SARS-CoV-2.
2. Materials and Methods
2.1. Search Strategy and Selection Criteria
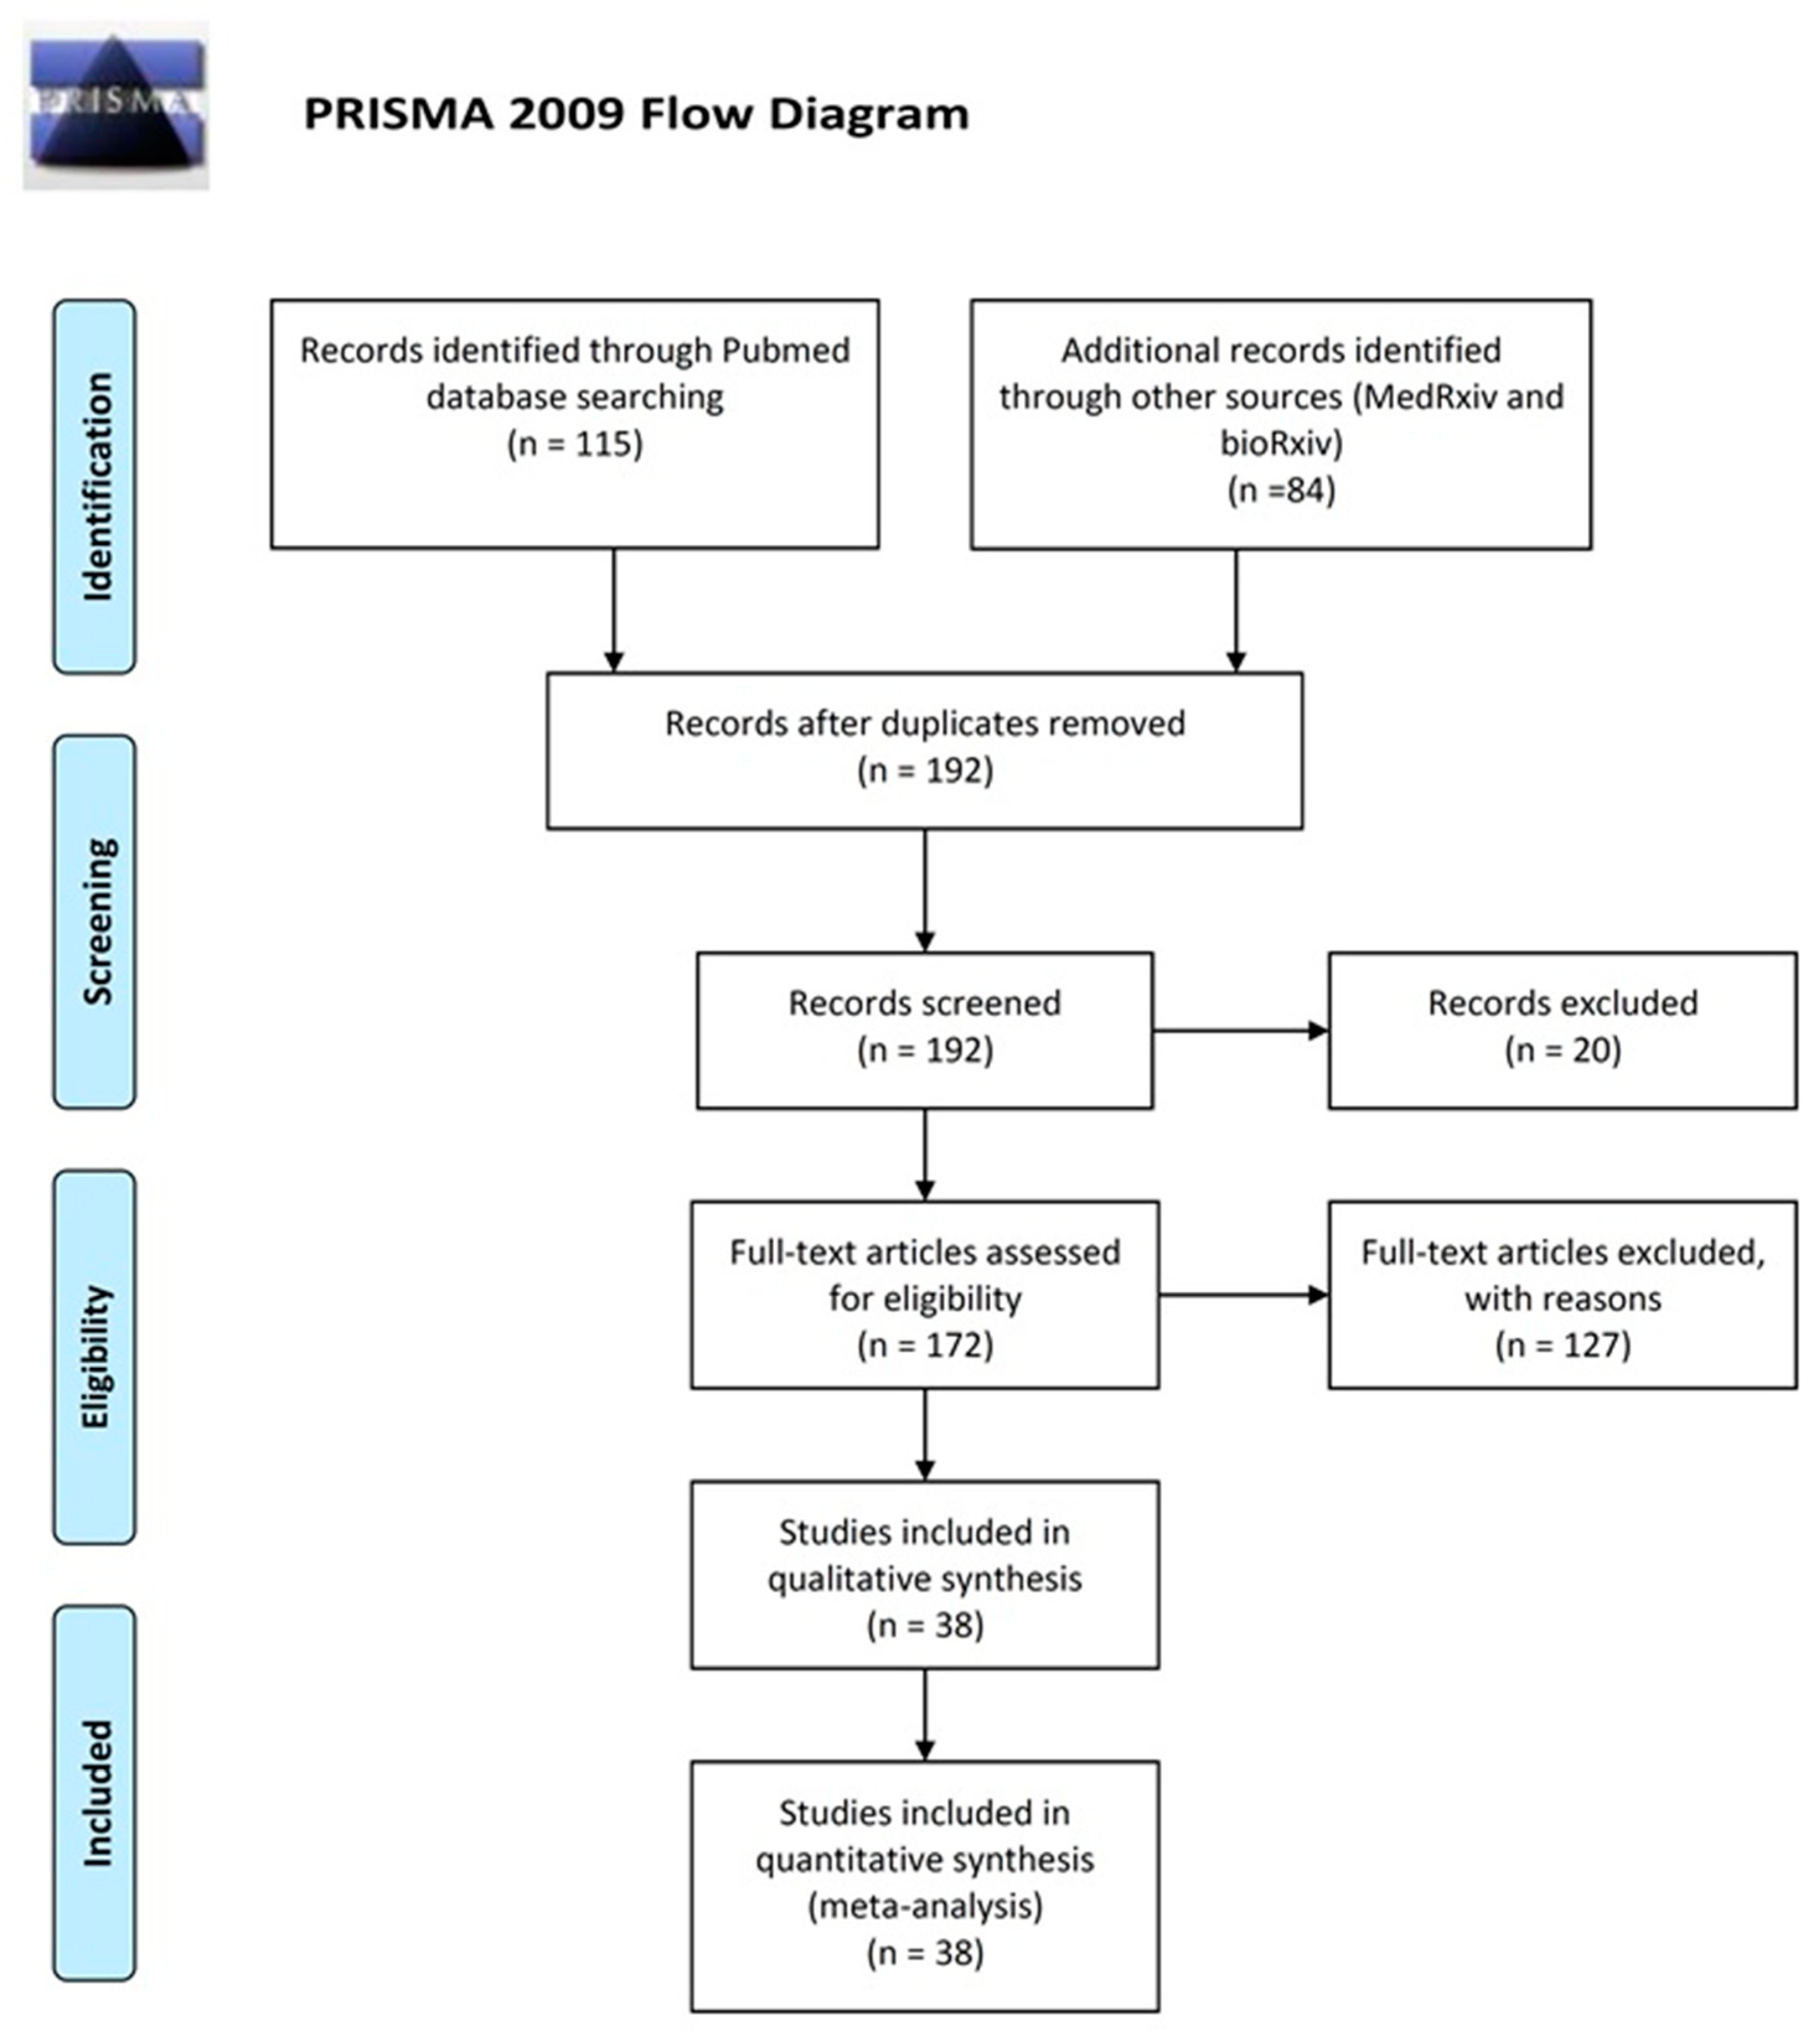
For conducting the systematic review and the meta-analysis we followed the Preferred Reporting Items for Systematic reviews and Meta-analyses (PRISMA) guidelines [23] and the advises for best practices [24]. We conducted the literature search using PubMed (https://www.ncbi.nlm.nih.gov/pubmed/), medRxiv (https://medrxiv.org/) and bioRxiv (https://www.biorxiv.org/). The search terms used were (SARS-CoV-2 OR “Coronavirus disease 2019” OR COVID-19) AND (IgM OR IgG or antibodies OR antibody OR ELISA or “rapid test”). The references of selected articles were also searched. The searches were concluded by April 17, 2020, and four different researchers independently evaluated search results. Disagreements in the initial evaluation were resolved by consensus. We did not impose language criteria and included studies written in English and Chinese. We required that eligible studies met the following criteria: (a) COVID-19 cases (SARS-CoV-2 infection) were confirmed either by NAT such as RT-PCR or sequencing or by a combination of NAT and clinical findings and (b) measurements of IgM and/or IgG antibodies were obtained with the use of any of the available methods. We considered eligible studies reporting the comparison of COVID-19 cases against non COVID-19 individuals, as well as case series reporting data only from COVID-19 patients.
Data extracted for each study included (if available): first author’s last name, percentage of male patients, mean age of COVID-19 patients, mean number of days from onset, and percentage of severe or critically ill COVID-19 patients. In addition, the different bioanalytical methods used for detection and determination of IgG and IgM were also recorded, along with the antigen used to detect the antibodies. In order to construct the 2 × 2 contingency table and obtain estimates for sensitivity and specificity, we recorded the numbers of true positive (TP), false positive (FP), true negative (TN), and false negative (FN) for each study. For studies reporting only COVID-19 patients, we recorded only TP and FN.
The immunoassay methods used for COVID-19 antibody (Ab) detection in all studies included in the present meta-analysis comprise enzyme-linked immunosorbent assay (ELISA), chemiluminescence immunoassays (CLIA), fluorescence immunoassays (FIA), and the point-of-care (POC) lateral flow immunoassays (LFIA) that are based on immunochromatography [25,26,27,28,29]. All methods were created to detect IgG and/or IgM antibodies (and in few cases total antibodies) [30,31,32] against S (mainly RBD) and/or N viral proteins of human sera/blood samples. For detection of IgM with ELISA, the μ-chain capture principle was used. Plates were firstly coated with mouse anti-human IgM (μ chain) monoclonal antibody. Diluted serum samples (heat-inactivated) together with positive and negative controls were added into the pre-coated plates according to individuals’ protocols and incubated at 37 °C for usually 1 h. Washing followed, and horse radish peroxidase (HRP) conjugated recombinant protein of SARS-CoV-2 (rN or rS produced in-house or obtained from a company) was added. After incubation of plates at 37 °C and washes, Tetramethylbenzidine (TMB) substrate solution and the corresponding buffer were added followed by incubation at 37 °C. The reactions were terminated by sulfuric acid addition and the absorbance values at 450 nm (A450) were determined. Usually, the cut off values were calculated by sum and average A450 of negative control replicates. The principle for the detection of IgG was indirect ELISA, where serum sample dilutions (plus positive and negative controls) were added to previously coated with rN or rS protein ELISA plates. Subsequently, incubation and washes were performed, and HRP-conjugated mouse anti-human IgG monoclonal antibody was added into the plates. Absorbance values at 450 nm were measured for detection. The cut off value was calculated by the sum and average A450 of negative control replicates [27].
LFIA is a rapid method based on immunochromatography, which uses colloidal gold conjugated COVID-19 antigens. It comprises a plastic pad where a nitrocellulose membrane is fitted. Three separate lines are created by immobilizing goat anti-human IgM, IgG, and goat anti-rabbit-IgG at test M, G, and control (C) lines, respectively. The entire conjugate pad is sprayed with a mixture of AuNP-COVID-19 recombinant antigen conjugate (colloidal-gold pretreated with SARS-CoV-2 recombinant protein) and AuNP-rabbit-IgG. Sample is applied to the sample pad and with the aid of a buffer migrates towards the immobilized lines of antibodies spread with the AuNP-recombinant antigen. When a reaction occurs, a visible line is formed suggesting the existence of IgM and IgG. It should be noted that color in the control line should be formed for a test to be valid [26,33]. The test gives qualitative results that are judged by optical inspection, usually 15 min after sample application. In some LFIAs purchased from companies, the specific antigen that LFIA was based on was not reported. Since most of the companies provide combined N- and S-based LFIAs, we assumed that in unspecified cases the LFIAs were N- and S-based.
CLIA is a chemiluminescence-based assay, mainly developed by companies. The detection of IgG or IgM is based on double-antibodies sandwich immunoassay. Recombinant antigens rN and rS are conjugated with fluorescein isothiocyanate (FITC) and immobilized on the anti-FITC antibody conjugated magnetic particles. Alkaline phosphatase conjugated human IgG/IgM antibody is used as the detection antibody. An automated magnetic chemiluminescence analyzer is needed to read the measured values of chemiluminescence, and results are given as arbitrary units. As threshold, 10 AU/mL is usually used for both IgM and IgG and according to manufacturer recommendations [34]. The analyzer can be batch and random access with the possibility to give results within half an hour at best [34,35]. Because in most cases CLIA detected both anti-N and anti-S IgG and IgM antibodies (with only one study detecting anti-N [34]), we assumed N- and S-based IgG and IgM CLIAs in studies without relevant information.
With FIA, we denote fluorescence immunoassays that can be performed on multi-test cover slides [36] or be based on fluorescence immunochromatography (AIE/Quantum dot-based fluorescence immunochromatographic assay, AFIA) [37,38]. The latter can be rapid, but all fluorescence-based immunoassays need analyzers to read the results [38].
2.2. Data Analysis
We performed a quality assessment of the included studies using the Quality Assessment of Diagnostic Accuracy Studies 2 (QUADAS-2) tool, offered by the Review Manager Software (RevMan 5.2.3) (Table S1). The QUADAS is a quality assessment tool specifically developed for systematic reviews of diagnostic accuracy studies and consists of four key domains: patient selection, index test, reference standard, and flow and timing; each domain is rated as low risk, high risk and unclear risk (Table S2, Figure S1).
We used the bivariate meta-analytic method modified for the meta-analysis of diagnostic tests [39]. The method has been shown to be equivalent to the so-called hsROC method [40,41] and uses logit-transforms of TPR (true positive rate) and FPR (false positive rate) in order to model Sensitivity and Specificity, as well as to account for the between-studies variability (heterogeneity). Studies that include information only for logit (TPR) are included under the missing at random assumptions in order to maximize the sample and allow for modelling the between-studies variability and correlation. The Begg’s rank correlation test [42] and the Egger’s regression test [43] were used on logit (TPR) to evaluate possible publication bias. The analysis was performed using Stata 13 (Stata Corporation, College Station, TX, USA) and the command “mvmeta” with the method of moments for multivariate meta-analysis and meta-regression [44]. Statistical significance was set at p < 0.05. Meta-analysis was performed in cases where two or more studies were available whereas meta-regression and tests for publication bias where 5 or more studies were available.
3. Results
The electronic search revealed 115 articles from PubMed, 72 from medRxiv and 12 from bioRxiv, from which we identified 38 eligible studies after scrutiny [25,26,27,28,29,30,31,32,33,34,35,36,37,38,45,46,47,48,49,50,51,52,53,54,55,56,57,58,59,60,61,62,63,64,65,66,67,68] (Figure 1). These include in total 7848 individuals (3522 COVID-19 cases and 4326 healthy, or non COVID-19, individuals). A total of 21 studies reported data for both COVID-19 cases and controls, whereas 17 studies reported data only for COVID-19 cases (Table 1). A total of 13 studies used RT-PCR or other nucleic acid-based tests (NATs) as the gold standard for case ascertainment, whereas 25 studies ascertained COVID-19 cases using a combination of molecular and clinical features. We built our analysis on grouping the tests according to the method and the specific antigen used. Because we found kits and reagents from 25 different companies, plus the various in-house tests developed for research purposes, stratification according to different kits was pointless. Several studies reported the results of multiple tests on the same individuals; however, they were not included in the same meta-analysis since we analyzed each test separately. In one study that compared several different LFIA tests, we used the results of the one with the median performance (even though the differences were small). Other studies reported samples from multiple populations, and in such cases, they were considered distinct.
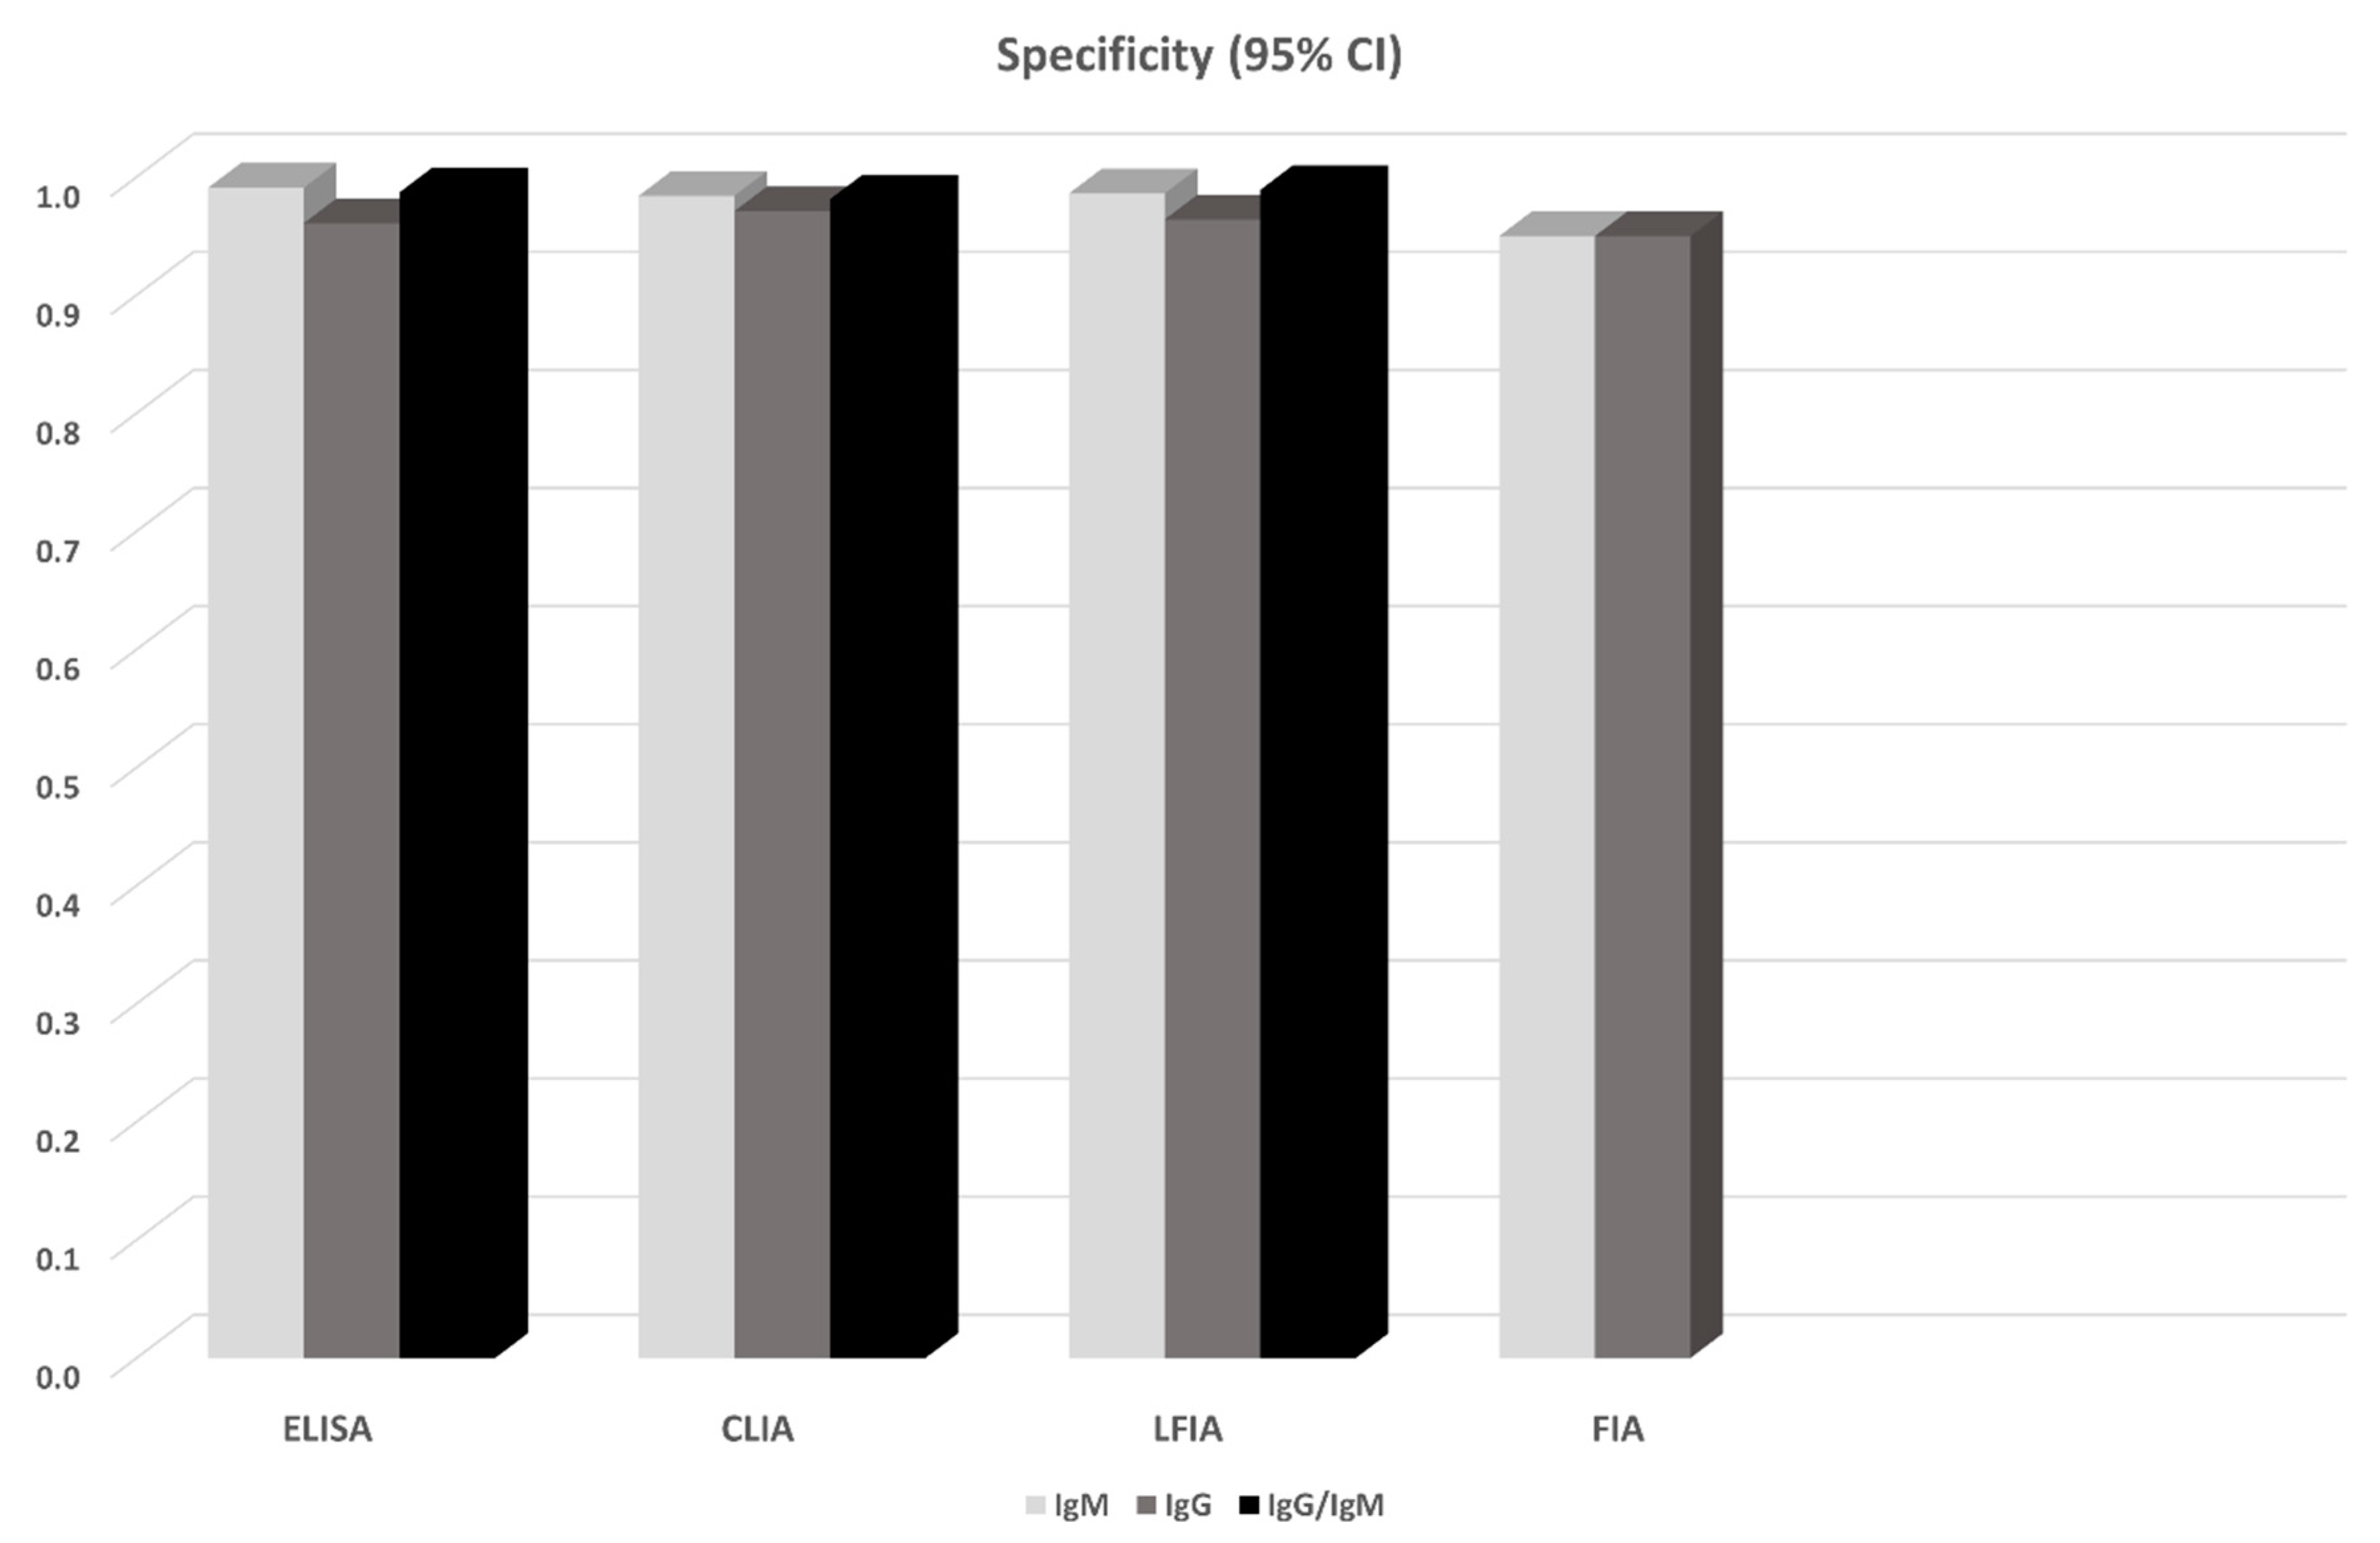
14 studies in total reported results from ELISA-based tests (detecting anti-N or anti-S IgG, IgM antibodies, or both). S-based ELISAs, in general, perform better compared to those based on N antigen. IgG and IgM seem to perform similarly, but the combination of IgG and IgM seems to be superior leading to a sensitivity of 0.935 (95% CI: 0.900, 0.971) (Figure 1). All ELISA-based methods seem to have rather high specificities (ranging from 0.961 to 0.995). Meta-regression analysis showed that the mean number of days from disease onset and the proportion of severe/critical patients have an influence on the overall sensitivity of the IgG tests. Both Egger’s and Begg’s tests did not detect publication bias or other small study effects.
CLIA-based tests were used in 13 studies. In all cases IgGs and IgMs were investigated. In this analysis, we also pooled together the studies that considered NS antigens with the studies that used N antigen. The sensitivities of detecting IgG seem to be better compared to that of IgM (0.944 vs. 0.810). Combining IgM and IgG yields a slightly worse sensitivity (0.907, 95% CI: 0.753, 1.000), but this estimate arises from only two studies (970 patients) and thus has large uncertainty (Figure 1). Specificities range from 0.954 to 0.984. Meta-regression analysis revealed that the mean number of days from disease onset has an influence on the overall outcome in the IgG tests. The Begg’s test provided some evidence for publication bias in the IgG analysis.
13 studies reported results from LFIA-based tests. The majority of the tests identified antibodies against both N and S antigens, and results were obtained for both IgG and IgM. In this analysis, we also pooled together the studies that considered NS antigens with the studies that used S antigen. IgG and IgM seem to perform comparably but rather low since the sensitivities range from 0.53 to 0.66. Combining IgG and IgM yields better estimates (0.78–0.83) but still with lower sensitivity compared to ELISA- and CLIA-based tests (Figure 1). Specificity in all cases ranged from 0.914 to 0.994. In the largest overall analysis, pooling together the 11 studies that used N, S, or NS antigens, the combination of IgG and IgM antibodies yields a sensitivity of 0.800 (95% CI: 0.663, 0.935) and specificity of 0.984 (95%CI: 0.969, 0.999). Meta-regression analysis revealed that the mean number of days from disease onset influences the overall outcome in the IgG and IgG/IgM tests. Both Egger’s and Begg’s tests could not find evidence for publication bias or other small study effects.
Lastly, FIA-based tests were found in three studies using a combination of N and S antigens. Both IgG and IgM show similar sensitivities (~0.86) and specificities (0.95) (Figure 2, Figure 3); however, the sample is small (3 studies, 327 patients). Due to the small number of studies, tests for publication bias or meta-regression could not be applied.
4. Discussion
Non-pharmaceutical interventions including increased testing rates, contact tracing, school closures, ban of mass gatherings, physical distancing, restriction of movement, and cordon sanitaire were effective in reducing transmission rates of SARS-CoV-2 in Wuhan, China, and other settings [69]. However, this type of intervention has tremendous societal and economic consequences potentially resulting in social disorganization and great recession. One approach to de-escalating public health measures and returning to a state of normalcy, while maintaining epidemiological vigilance and ability to respond fast to viral resurgence, is to identify people with immunity to SARS-CoV-2 and estimate their proportion in the entire population. This approach would indicate immune people including health-care workers who can go back to work without risking their health or that of others, help reopen borders, and monitor the development of herd immunity. Unfortunately, human immune response to the new pathogen is not well studied yet. The serological tests that have recently been developed employ different methods and target either IgG or IgM or both. In an attempt to fill the knowledge gap, this systematic review summarized evidence from 38 studies involving 7848 individuals. Although the US Food and Drug Administration (FDA) has approved ELISA, LFIA, and neutralization assays, we included in the present meta-analysis studies using CLIA and FIA methods as well, because they can potentially be approved in the future. We did not consider neutralization assays since they are more time demanding (3–5 days) and can only be performed in laboratories of Biosafety Level-3 (BSL-3) [70]. The meta-analysis showed that all methods yielded high specificity with some of the methods (ELISA and LFIA) reaching levels higher than 99%. ELISA- and CLIA-based methods performed better in terms of sensitivity (90–96%) followed by LFIA and FIA with sensitivities ranging from 80% to 89%.
Sample quality, low antibody concentrations, and especially timing of the test—too soon after a person is infected when antibodies have not been developed yet or too late when IgM antibodies have decreased or disappeared—could potentially explain the low ability of the antibody tests to identify people with COVID-19 [70]. According to kinetic measurements of some of the included studies [22,50,55] IgM peaks between days 5 and 12 and then drops slowly. IgGs reach peak concentrations after day 20 or so as IgM antibodies disappear. This meta-analysis showed, through meta-regression, that IgG tests did have better sensitivity when the samples were taken after the first week that follows the onset of symptoms. This is further corroborated by the lower specificity of IgM antibodies compared to IgG [15]. Only few of the included studies provided data stratified by the time of onset of symptoms, so a separate stratified analysis was not feasible, but this should be a goal for future studies. In any case, care should be paid when antibody tests are used in the first week after the onset of disease symptoms. Moreover, irrespective of the method, a combined IgG/IgM test seems to be a better choice in terms of sensitivity than measuring either antibody type alone. The analyses also showed that tests that use the S antigen are more sensitive than N antigen-based ELISA tests, probably due to higher sensitivity and earlier immune response to the S antigen [53] and more specific perhaps due to lower cross-reactivity with less conserved regions of spike proteins existing in other coronaviruses (SARS-CoV) [17,56,64]. Finally, despite the suboptimal sensitivity, antibody tests could certainly supplement NATs in the diagnosis of people with suspected SARS-CoV-2 infection [65]. In any case, a direct comparison of antibody tests against NATs is also needed in future studies (in the current review only a handful of studies performed this, and they did that only in COVID-19 patients).
Antibody tests for SARS-CoV-2 have other accuracy issues that deserve attention and further assessment. For instance, cross-reaction with human endemic coronaviruses could make antibody tests less specific and produce false positive results [30,35,56,63]. A low specificity may have important consequences both in terms of diagnosis and population surveillance. At the individual level, false positive results pose risks as people who have never been infected are perhaps allowed to work or travel because they are considered immune. At a population level and regarding epidemiological studies, given the low prevalence of SARS-CoV-2 in most settings at the moment, false positives may inflate prevalence estimates and give a distorted picture of lower mortality rate and higher population immunity than what is in reality. On the other hand, low sensitivity may result in falsely assuming that a person is not infected and consequently jeopardizing measures to prevent the spread of the epidemic. Based on the results of this meta-analysis, ELISA tests that achieved specificity higher than 99% and sensitivity ~93% could be the safer choice at this stage of the pandemic. CLIA tests show comparable sensitivity (~90%) but slightly decreased specificity (95–98%). LFIA tests on the other hand are particularly attractive for large seroprevalence studies and can be used as POC tests. They show high specificity, comparable to ELISA (~99%), but lower sensitivity (~80%), and these estimates should be taken into account when designing and performing seroprevalence studies, for instance, by adjusting properly the obtained positive and negative findings. At the individual level, perhaps mixed strategies could be adopted (for instance re-testing a negative finding using a different test).
Of note, even if tests are highly accurate, much about protective immunity is unknown, and the true presence of binding antibodies might not mean that people have indeed developed high titers of neutralizing antibodies and are thus immune to re-infection [71]. Research on Rhesus macaques infected with SARS-CoV-2 was promising though showing that reinfection did not occur following rechallenge with the same dose of SARS-CoV-2 strain [72]. Finally, viral load does not decline rapidly after seroconversion and people may remain infectious despite being truly positive in antibodies tests [36].
Supplementary Materials
The following are available online at https://www.mdpi.com/2075-4418/10/5/319/s1, Table S1: The QUADAS tool, Table S2: The Quadas Tool 2, Figure S1: The Quadas Tool 2 graph.
Author Contributions
P.G.B. conceived the study, participated in data collection, and performed the analysis. P.I.K., G.G.B., N.L.D., and G.N. participated in data collection and in the interpretation of the results. All authors participated in drafting the manuscript. All authors read and approved the final version of the manuscript.
Funding
This research received no external funding.
Conflicts of Interest
The authors declare no conflict of interest.
Disclaimer
Where authors are identified as personnel of the International Agency for Research on Cancer/World Health Organization, the authors alone are responsible for the views expressed in this article and they do not necessarily represent the decisions, policy, or views of the International Agency for Research on Cancer/World Health Organization.
References
- Chan, J.F.-W.; Yuan, S.; Kok, K.-H.; To, K.K.-W.; Chu, H.; Yang, J.; Xing, F.; Liu, J.; Yip, C.C.-Y.; Poon, R.W.-S.; et al. A familial cluster of pneumonia associated with the 2019 novel coronavirus indicating person-to-person transmission: A study of a family cluster. Lancet 2020, 395, 514–523. [Google Scholar] [CrossRef] [Green Version]
- Wu, F.; Zhao, S.; Yu, B.; Chen, Y.M.; Wang, W.; Song, Z.G.; Hu, Y.; Tao, Z.W.; Tian, J.H.; Pei, Y.Y.; et al. A new coronavirus associated with human respiratory disease in China. Nature 2020, 579, 265–269. [Google Scholar] [CrossRef] [Green Version]
- Sohrabi, C.; Alsafi, Z.; O’Neill, N.; Khan, M.; Kerwan, A.; Al-Jabir, A.; Iosifidis, C.; Agha, R. World Health Organization declares global emergency: A review of the 2019 novel coronavirus (COVID-19). Int. J. Surg. 2020, 76, 71–76. [Google Scholar] [CrossRef]
- Liu, J.; Zheng, X.; Tong, Q.; Li, W.; Wang, B.; Sutter, K.; Trilling, M.; Lu, M.; Dittmer, U.; Yang, D. Overlapping and discrete aspects of the pathology and pathogenesis of the emerging human pathogenic coronaviruses SARS-CoV, MERS-CoV, and 2019-nCoV. J. Med. Virol. 2020, 92, 491–494. [Google Scholar] [CrossRef] [Green Version]
- Promislow, D.E.L. A geroscience perspective on COVID-19 mortality. J. Gerontol. Ser. A Biol. Sci. Med. Sci. 2020. [Google Scholar] [CrossRef] [Green Version]
- Wang, B.; Li, R.; Lu, Z.; Huang, Y. Does comorbidity increase the risk of patients with COVID-19: Evidence from meta-analysis. Aging 2020, 12, 6049–6057. [Google Scholar] [CrossRef]
- Zhang, J.; Wang, X.; Jia, X.; Li, J.; Hu, K.; Chen, G.; Wei, J.; Gong, Z.; Zhou, C.; Yu, H.; et al. Risk factors for disease severity, unimprovement, and mortality of COVID-19 patients in Wuhan, China. Clin. Microbiol. Infect. Off. Publ. Eur. Soc. Clin. Microbiol. Infect. Dis. 2020. [Google Scholar] [CrossRef]
- Wu, A.; Peng, Y.; Huang, B.; Ding, X.; Wang, X.; Niu, P.; Meng, J.; Zhu, Z.; Zhang, Z.; Wang, J.; et al. Genome Composition and Divergence of the Novel Coronavirus (2019-nCoV) Originating in China. Cell Host Microbe 2020, 27, 325–328. [Google Scholar] [CrossRef] [Green Version]
- Cui, J.; Li, F.; Shi, Z.L. Origin and evolution of pathogenic coronaviruses. Nat. Rev. Microbiol. 2019, 17, 181–192. [Google Scholar] [CrossRef] [Green Version]
- Lu, R.; Zhao, X.; Li, J.; Niu, P.; Yang, B.; Wu, H.; Wang, W.; Song, H.; Huang, B.; Zhu, N.; et al. Genomic characterisation and epidemiology of 2019 novel coronavirus: Implications for virus origins and receptor binding. Lancet 2020, 395, 565–574. [Google Scholar] [CrossRef] [Green Version]
- Woo, P.C.; Lau, S.K.; Wong, B.H.; Tsoi, H.W.; Fung, A.M.; Kao, R.Y.; Chan, K.H.; Peiris, J.S.; Yuen, K.Y. Differential sensitivities of severe acute respiratory syndrome (SARS) coronavirus spike polypeptide enzyme-linked immunosorbent assay (ELISA) and SARS coronavirus nucleocapsid protein ELISA for serodiagnosis of SARS coronavirus pneumonia. J. Clin. Microbiol. 2005, 43, 3054–3058. [Google Scholar] [CrossRef] [PubMed] [Green Version]
- Zhou, P.; Yang, X.L.; Wang, X.G.; Hu, B.; Zhang, L.; Zhang, W.; Si, H.R.; Zhu, Y.; Li, B.; Huang, C.L.; et al. A pneumonia outbreak associated with a new coronavirus of probable bat origin. Nature 2020, 579, 270–273. [Google Scholar] [CrossRef] [PubMed] [Green Version]
- Chang, C.K.; Sue, S.C.; Yu, T.H.; Hsieh, C.M.; Tsai, C.K.; Chiang, Y.C.; Lee, S.J.; Hsiao, H.H.; Wu, W.J.; Chang, W.L.; et al. Modular organization of SARS coronavirus nucleocapsid protein. J. Biomed. Sci. 2006, 13, 59–72. [Google Scholar] [CrossRef] [PubMed] [Green Version]
- Hurst, K.R.; Koetzner, C.A.; Masters, P.S. Identification of in vivo-interacting domains of the murine coronavirus nucleocapsid protein. J. Virol. 2009, 83, 7221–7234. [Google Scholar] [CrossRef] [PubMed] [Green Version]
- Tang, Y.W.; Schmitz, J.E.; Persing, D.H.; Stratton, C.W. The Laboratory Diagnosis of COVID-19 Infection: Current Issues and Challenges. J. Clin. Microbiol. 2020. [Google Scholar] [CrossRef] [Green Version]
- Walls, A.C.; Park, Y.J.; Tortorici, M.A.; Wall, A.; McGuire, A.T.; Veesler, D. Structure, Function, and Antigenicity of the SARS-CoV-2 Spike Glycoprotein. Cell 2020, 181, 281–292.e286. [Google Scholar] [CrossRef]
- Zheng, M.; Song, L. Novel antibody epitopes dominate the antigenicity of spike glycoprotein in SARS-CoV-2 compared to SARS-CoV. Cell Mol. Immunol. 2020. [Google Scholar] [CrossRef] [Green Version]
- Corman, V.M.; Landt, O.; Kaiser, M.; Molenkamp, R.; Meijer, A.; Chu, D.K.; Bleicker, T.; Brunink, S.; Schneider, J.; Schmidt, M.L.; et al. Detection of 2019 novel coronavirus (2019-nCoV) by real-time RT-PCR. Eur. Surveill. Bull. Eur. Sur Les Mal. Transm. Eur. Commun. Dis. Bull. 2020, 25. [Google Scholar] [CrossRef] [Green Version]
- ECDC. Novel Coronavirus Disease 2019 (COVID-19) Pandemic: Increased Transmission in the EU/EEA and the UK—Sixth Update—12 March 2020; European Centre for Disease Prevention and Control: Stockholm, Sweden, 2020. [Google Scholar]
- Service, R.F. The standard coronavirus test, if available, works well—But can new diagnostics help in this pandemic? ScienceMag 2020. [Google Scholar] [CrossRef]
- Holshue, M.L.; DeBolt, C.; Lindquist, S.; Lofy, K.H.; Wiesman, J.; Bruce, H.; Spitters, C.; Ericson, K.; Wilkerson, S.; Tural, A.; et al. First Case of 2019 Novel Coronavirus in the United States. New Engl. J. Med. 2020, 382, 929–936. [Google Scholar] [CrossRef]
- Pang, J.; Wang, M.X.; Ang, I.Y.H.; Tan, S.H.X.; Lewis, R.F.; Chen, J.I.; Gutierrez, R.A.; Gwee, S.X.W.; Chua, P.E.Y.; Yang, Q.; et al. Potential Rapid Diagnostics, Vaccine and Therapeutics for 2019 Novel Coronavirus (2019-nCoV): A Systematic Review. J. Clin. Med. 2020, 9, 623. [Google Scholar] [CrossRef] [PubMed] [Green Version]
- Moher, D.; Liberati, A.; Tetzlaff, J.; Altman, D.G. Preferred reporting items for systematic reviews and meta-analyses: The PRISMA statement. PLoS Med. 2009, 6, e1000097. [Google Scholar] [CrossRef] [Green Version]
- Forero, D.A.; Lopez-Leon, S.; González-Giraldo, Y.; Bagos, P.G. Ten simple rules for carrying out and writing meta-analyses. PLoS Comput. Biol. 2019, 15, e1006922. [Google Scholar] [CrossRef] [PubMed]
- Du, Z.; Zhu, F.; Guo, F.; Yang, B.; Wang, T. Detection of antibodies against SARS-CoV-2 in patients with COVID-19. J. Med. Virol. 2020. [Google Scholar] [CrossRef] [PubMed] [Green Version]
- Li, Z.; Yi, Y.; Luo, X.; Xiong, N.; Liu, Y.; Li, S.; Sun, R.; Wang, Y.; Hu, B.; Chen, W.; et al. Development and clinical application of a rapid IgM-IgG combined antibody test for SARS-CoV-2 infection diagnosis. J. Med. Virol. 2020. [Google Scholar] [CrossRef]
- Liu, R.; Liu, X.; Han, H.; Shereen, M.A.; Niu, Z.; Li, D.; Liu, F.; Wu, K.; Luo, Z.; Zhu, C. The comparative superiority of IgM-IgG antibody test to real-time reverse transcriptase PCR detection for SARS-CoV-2 infection diagnosis. medRxiv 2020. [Google Scholar] [CrossRef] [Green Version]
- Xiang, J.; Yan, M.; Li, H.; Liu, T.; Lin, C.; Huang, S.; Shen, C. Evaluation of Enzyme-Linked Immunoassay and Colloidal Gold—Immunochromatographic Assay Kit for Detection of Novel Coronavirus (SARS-Cov-2) Causing an Outbreak of Pneumonia (COVID-19). medRxiv 2020. [Google Scholar] [CrossRef] [Green Version]
- Xiao, D.A.T.; Gao, D.C.; Zhang, D.S. Profile of Specific Antibodies to SARS-CoV-2: The First Report. J. Infect. 2020. [Google Scholar] [CrossRef]
- Lassaunière, R.; Frische, A.; Harboe, Z.B.; Nielsen, A.C.Y.; Fomsgaard, A.; Krogfelt, K.A.; Jørgensen, C.S. Evaluation of nine commercial SARS-CoV-2 immunoassays. medRxiv 2020. [Google Scholar] [CrossRef] [Green Version]
- Lou, B.; Li, T.; Zheng, S.; Su, Y.; Li, Z.; Liu, W.; Yu, F.; Ge, S.; Zou, Q.; Yuan, Q.; et al. Serology characteristics of SARS-CoV-2 infection since the exposure and post symptoms onset. medRxiv 2020. [Google Scholar] [CrossRef]
- Zhang, B.; Zhou, X.; Zhu, C.; Feng, F.; Qiu, Y.; Feng, J.; Jia, Q.; Song, Q.; Zhu, B.; Wang, J. Immune phenotyping based on neutrophil-to-lymphocyte ratio and IgG predicts disease severity and outcome for patients with COVID-19. medRxiv 2020. [Google Scholar] [CrossRef] [Green Version]
- Xu, Y. Dynamic profile of severe or critical COVID-19 cases. medRxiv 2020. [Google Scholar] [CrossRef] [Green Version]
- Wang, Z.; Li, H.; Li, J.; Yang, C.; Guo, X.; Hu, Z.; Chen, Z.; Wang, S.; Liu, J. Elevated serum IgM levels indicate poor outcome in patients with coronavirus disease 2019 pneumonia: A retrospective case-control study. medRxiv 2020. [Google Scholar] [CrossRef]
- Lin, D.; Liu, L.; Zhang, M.; Hu, Y.; Yang, Q.; Guo, J.; Dai, Y.; Xu, Y.; Cai, Y.; Chen, X.; et al. Evaluations of serological test in the diagnosis of 2019 novel coronavirus (SARS-CoV-2) infections during the COVID-19 outbreak. medRxiv 2020. [Google Scholar] [CrossRef] [Green Version]
- Wölfel, R.; Corman, V.M.; Guggemos, W.; Seilmaier, M.; Zange, S.; Müller, M.A.; Niemeyer, D.; Jones, T.C.; Vollmar, P.; Rothe, C.; et al. Virological assessment of hospitalized patients with COVID-2019. Nature 2020. [Google Scholar] [CrossRef] [Green Version]
- Hu, X.; An, T.; Situ, B.; Hu, Y.; Ou, Z.; Li, Q.; He, X.; Zhang, Y.; Tian, P.; Sun, D.; et al. Heat inactivation of serum interferes with the immunoanalysis of antibodies to SARS-CoV-2. medRxiv 2020. [Google Scholar] [CrossRef] [Green Version]
- Jia, X.; Zhang, P.; Tian, Y.; Wang, J.; Zeng, H.; Wang, J.; Jiao, L.; Chen, Z.; Zhang, L.; He, H.; et al. Clinical significance of IgM and IgG test for diagnosis of highly suspected COVID-19 infection. medRxiv 2020. [Google Scholar] [CrossRef] [Green Version]
- Van Houwelingen, H.C.; Zwinderman, K.H.; Stijnen, T. A bivariate approach to meta-analysis. Stat. Med. 1993, 12, 2273–2284. [Google Scholar] [CrossRef]
- Arends, L.R.; Hamza, T.H.; van Houwelingen, J.C.; Heijenbrok-Kal, M.H.; Hunink, M.G.; Stijnen, T. Bivariate random effects meta-analysis of ROC curves. Med. Decis. Mak. Int. J. Soc. Med. Decis. Mak. 2008, 28, 621–638. [Google Scholar] [CrossRef]
- Liu, Y.; Chen, Y.; Chu, H. A unification of models for meta-analysis of diagnostic accuracy studies without a gold standard. Biometrics 2015, 71, 538–547. [Google Scholar] [CrossRef] [Green Version]
- Begg, C.B.; Mazumdar, M. Operating characteristics of a rank correlation test for publication bias. Biometrics 1994, 50, 1088–1101. [Google Scholar] [CrossRef] [PubMed]
- Egger, M.; Smith, G.D.; Schneider, M.; Minder, C. Bias in meta-analysis detected by a simple, graphical test. BMJ 1997, 315, 629. [Google Scholar] [CrossRef] [Green Version]
- White, I.R. Multivariate random-effects meta-regression: Updates to mvmeta. Stata J. 2011, 11, 255–270. [Google Scholar] [CrossRef] [Green Version]
- Bai, S.L.; Wang, J.Y.; Zhou, Y.Q.; Yu, D.S.; Gao, X.M.; Li, L.L.; Yang, F. Analysis of the first cluster of cases in a family of novel coronavirus pneumonia in Gansu Province. Zhonghua Yu Fang Yi Xue Za Zhi Chin. J. Prev. Med. 2020, 54, E005. [Google Scholar] [CrossRef]
- Bendavid, E.; Mulaney, B.; Sood, N.; Shah, S.; Ling, E.; Bromley-Dulfano, R.; Lai, C.; Weissberg, Z.; Saavedra, R.; Tedrow, J.; et al. COVID-19 Antibody Seroprevalence in Santa Clara County, California. medRxiv 2020. [Google Scholar] [CrossRef]
- Cassaniti, I.; Novazzi, F.; Giardina, F.; Salinaro, F.; Sachs, M.; Perlini, S.; Bruno, R.; Mojoli, F.; Baldanti, F. Performance of VivaDiag COVID-19 IgM/IgG Rapid Test is inadequate for diagnosis of COVID-19 in acute patients referring to emergency room department. J. Med. Virol. 2020. [Google Scholar] [CrossRef] [Green Version]
- Gao, Y.; Yuan, Y.; Li, T.T.; Wang, W.X.; Li, Y.X.; Li, A.; Han, F.M. Evaluation the auxiliary diagnosis value of antibodies assays for detection of novel coronavirus (SARS-Cov-2) causing an outbreak of pneumonia (COVID-19). medRxiv 2020. [Google Scholar] [CrossRef]
- Garcia, F.P.; Perez Tanoira, R.; Romanyk Cabrera, J.P.; Arroyo Serrano, T.; Gomez Herruz, P.; Cuadros Gonzalez, J. Rapid diagnosis of SARS-CoV-2 infection by detecting IgG and IgM antibodies with an immunochromatographic device: A prospective single-center study. medRxiv 2020. [Google Scholar] [CrossRef] [Green Version]
- Guo, L.; Ren, L.; Yang, S.; Xiao, M.; Chang, D.; Yang, F.; Dela Cruz, C.S.; Wang, Y.; Wu, C.; Xiao, Y.; et al. Profiling Early Humoral Response to Diagnose Novel Coronavirus Disease (COVID-19). Clin. Infect. Dis. Off. Publ. Infect. Dis. Soc. Am. 2020. [Google Scholar] [CrossRef] [Green Version]
- Jin, Y.; Wang, M.; Zuo, Z.; Fan, C.; Ye, F.; Cai, Z.; Wang, Y.; Cui, H.; Pan, K.; Xu, A. Diagnostic value and dynamic variance of serum antibody in coronavirus disease 2019. Int. J. Infect. Dis. IJID Off. Publ. Int. Soc. Infect. Dis. 2020, 94, 49–52. [Google Scholar] [CrossRef]
- Liu, L.; Liu, W.; Wang, S.; Zheng, S. A preliminary study on serological assay for severe acute respiratory syndrome coronavirus 2 (SARS-CoV-2) in 238 admitted hospital patients. medRxiv 2020. [Google Scholar] [CrossRef] [Green Version]
- Liu, W.; Liu, L.; Kou, G.; Zheng, Y.; Ding, Y.; Ni, W.; Wang, Q.; Tan, L.; Wu, W.; Tang, S.; et al. Evaluation of Nucleocapsid and Spike Protein-based ELISAs for detecting antibodies against SARS-CoV-2. J. Clin. Microbiol. 2020. [Google Scholar] [CrossRef] [PubMed] [Green Version]
- Liu, Y.; Liu, Y.; Diao, B.; Ren, F.; Wang, Y.; Ding, J.; Huang, Q. Diagnostic Indexes of a Rapid IgG/IgM Combined Antibody Test for SARS-CoV-2. medRxiv 2020. [Google Scholar] [CrossRef] [Green Version]
- Long, Q.-X.; Deng, H.-J.; Chen, J.; Hu, J.; Liu, B.-Z.; Liao, P.; Lin, Y.; Yu, L.-H.; Mo, Z.; Xu, Y.-Y.; et al. Antibody responses to SARS-CoV-2 in COVID-19 patients: The perspective application of serological tests in clinical practice. medRxiv 2020. [Google Scholar] [CrossRef] [Green Version]
- Okba, N.M.A.; Muller, M.A.; Li, W.; Wang, C.; GeurtsvanKessel, C.H.; Corman, V.M.; Lamers, M.M.; Sikkema, R.S.; de Bruin, E.; Chandler, F.D.; et al. Severe Acute Respiratory Syndrome Coronavirus 2-Specific Antibody Responses in Coronavirus Disease 2019 Patients. Emerg. Infect. Dis. 2020, 26. [Google Scholar] [CrossRef]
- Pan, Y.; Li, X.; Yang, G.; Fan, J.; Tang, Y.; Zhao, J.; Long, X.; Guo, S.; Zhao, Z.; Liu, Y.; et al. Serological immunochromatographic approach in diagnosis with SARS-CoV-2 infected COVID-19 patients. J. Infect. 2020. [Google Scholar] [CrossRef]
- Paradiso, A.V.; De Summa, S.; Loconsole, D.; Procacci, V.; Sallustio, A.; Centrone, F.; Silvestris, N.; Cafagna, V.; De Palma, G.; Tufaro, A.; et al. Clinical meanings of rapid serological assay in patients tested for SARS-Co2 RT-PCR. medRxiv 2020. [Google Scholar] [CrossRef] [Green Version]
- Tan, W.; Lu, Y.; Zhang, J.; Wang, J.; Dan, Y.; Tan, Z.; He, X.; Qian, C.; Sun, Q.; Hu, Q.; et al. Viral Kinetics and Antibody Responses in Patients with COVID-19. medRxiv 2020. [Google Scholar] [CrossRef] [Green Version]
- To, K.K.; Tsang, O.T.; Leung, W.S.; Tam, A.R.; Wu, T.C.; Lung, D.C.; Yip, C.C.; Cai, J.P.; Chan, J.M.; Chik, T.S.; et al. Temporal profiles of viral load in posterior oropharyngeal saliva samples and serum antibody responses during infection by SARS-CoV-2: An observational cohort study. Lancet Infect. Dis. 2020. [Google Scholar] [CrossRef] [Green Version]
- Zeng, H.; Xu, C.; Fan, J.; Tang, Y.; Deng, Q.; Zhang, W.; Long, X. Antibodies in Infants Born to Mothers With COVID-19 Pneumonia. JAMA 2020. [Google Scholar] [CrossRef]
- Zeng, Z.; Chen, L.; Pan, Y.; Deng, Q.; Ye, G.; Li, Y.; Wang, X. Re: Profile of specific antibodies to SARS-CoV-2: The first report. J. Infect. 2020. [Google Scholar] [CrossRef]
- Zhang, J.; Liu, J.; Li, N.; Liu, Y.; Ye, R.; Qin, X.; Zheng, R. Serological detection of 2019-nCoV respond to the epidemic: A useful complement to nucleic acid testing. medRxiv 2020. [Google Scholar] [CrossRef] [Green Version]
- Zhang, P.; Gao, Q.; Wang, T.; Ke, Y.; Mo, F.; Jia, R.; Liu, W.; Liu, L.; Zheng, S.; Liu, Y.; et al. Evaluation of recombinant nucleocapsid and spike proteins for serological diagnosis of novel coronavirus disease 2019 (COVID-19). medRxiv 2020. [Google Scholar] [CrossRef] [Green Version]
- Zhao, J.; Yuan, Q.; Wang, H.; Liu, W.; Liao, X.; Su, Y.; Wang, X.; Yuan, J.; Li, T.; Li, J.; et al. Antibody responses to SARS-CoV-2 in patients of novel coronavirus disease 2019. Clin. Infect. Dis. Off. Publ. Infect. Dis. Soc. Am. 2020. [Google Scholar] [CrossRef] [PubMed]
- Zhao, R.; Li, M.; Song, H.; Chen, J.; Ren, W.; Feng, Y.; Song, J.-W.; Peng, Y.; Su, B.; Guo, X.; et al. Serological diagnostic kit of SARS-CoV-2 antibodies using CHO-expressed full-length SARS-CoV-2 S1 proteins. medRxiv 2020. [Google Scholar] [CrossRef]
- Zheng, C.; Wang, J.; Guo, H.; Lu, Z.; Ma, Y.; Zhu, Y.; Xia, D.; Wang, Y.; He, H.; Zhou, J.; et al. Risk-adapted Treatment Strategy For COVID-19 Patients. Int. J. Infect. Dis. IJID Off. Publ. Int. Soc. Infect. Dis. 2020. [Google Scholar] [CrossRef] [Green Version]
- Zhong, L.; Chuan, J.; Gong, B.O.; Shuai, P.; Zhou, Y.; Zhang, Y.; Jiang, Z.; Zhang, D.; Liu, X.; Ma, S.; et al. Detection of serum IgM and IgG for COVID-19 diagnosis. Sci. China Life Sci. 2020. [Google Scholar] [CrossRef] [Green Version]
- Pan, A.; Liu, L.; Wang, C.; Guo, H.; Hao, X.; Wang, Q.; Huang, J.; He, N.; Yu, H.; Lin, X.; et al. Association of Public Health Interventions With the Epidemiology of the COVID-19 Outbreak in Wuhan, China. JAMA 2020. [Google Scholar] [CrossRef] [Green Version]
- Sethuraman, N.; Jeremiah, S.S.; Ryo, A. Interpreting Diagnostic Tests for SARS-CoV-2. JAMA 2020. [Google Scholar] [CrossRef]
- Wu, F.; Wang, A.; Liu, M.; Wang, Q.; Chen, J.; Xia, S.; Ling, Y.; Zhang, Y.; Xun, J.; Lu, L.; et al. Neutralizing antibody responses to SARS-CoV-2 in a COVID-19 recovered patient cohort and their implications. medRxiv 2020. [Google Scholar] [CrossRef]
- Bao, L.; Deng, W.; Gao, H.; Xiao, C.; Liu, J.; Xue, J.; Lv, Q.; Liu, J.; Yu, P.; Xu, Y.; et al. Reinfection could not occur in SARS-CoV-2 infected rhesus macaques. BioRxiv 2020. [Google Scholar] [CrossRef] [Green Version]
Figure 1.
Preferred reporting items for systematic reviews and meta-analyses (PRISMA) flow diagram.

Figure 2.
Pooled sensitivity of antibody tests obtained from meta-analysis. For the details see Table 2 and the Results section.
Figure 2.
Pooled sensitivity of antibody tests obtained from meta-analysis. For the details see Table 2 and the Results section.

Figure 3.
Pooled specificity of antibody tests obtained from meta-analysis. For the details see Table 2 and the Results section.
Figure 3.
Pooled specificity of antibody tests obtained from meta-analysis. For the details see Table 2 and the Results section.


Table 1.
Characteristics of the 38 studies included in the meta-analysis.
| Author [Ref] | Covid19/Healthy | Covid19 Ascertainment | Severe Covid19 (%) | Male Cases (%) | Cases Age | Days from Onset | Antibodies | Method | Company | Limit of Detection IgM/IgG | Sensitivity | Specificity |
|---|---|---|---|---|---|---|---|---|---|---|---|---|
| Liu [27] | 238/120 | RT-PCR/clinical features | NR | 58 | 55 | 14 | IgM (N)/IgG (N) | ELISA | ZhuHai LivZon, Diagnostics | A450: 0.100/0.130 | 0.11–0.81 | 0.96–0.99 |
| Long [55] | 262/148 | RT-PCR | 13.6 | 55.4 | 47 | 13 | IgM (N,S)/IgG (N,S) | CLIA | Bioscience (Chongqing) Co., Ltd. | NR | 0.67–0.80 | 0.95 |
| Jia [38] | 33/242 | NR-NAT/clinical features | NR | NR | NR | 15 | IgM (N,S)/IgG (N,S) | FIA | Beijing Diagreat Biotechnologies Co., Ltd. | Fluorescence Intensity: 0.88/1.02 (Flu units) | 0.45–0.72 | 0.95 |
| Liu [54] | 95/84 | RT-PCR | 49 | 70 | 76 | 18 | IgM (N)/IgG (N) | LFIA | Not Reported (a Chinese Company) | NA | 0.37–0.86 | 0.93–0.94 |
| Xu [33] | 10/0 | NAT/sequencing | 100 | 60 | NR | 22 | IgM (S)/IgG (S) | LFIA | In-house test | NA | 0.3–0.9 | NA |
| Wang [34] | 116/0 | RT-PCR/clinical features | 12.9 | 56 | 68.8 | 31 | IgM (N,S)/IgG (N,S) | CLIA | YHLO Biotechnology (Shenzhen, China) | 10 AU/mL | 1 | NA |
| Xiang [28] | 63/35 ELISA, 91/35 LFIA | RT-PCR/clinical features | 6.3 | 55.5 | 57.82 | NR | IgM (N,S)/IgG (N,S) | ELISA/LFIA | ZhuHai LivZon, Diagnostics Inc.BioEasy/Shenzhen BioEasy Biotechnology Co. | NR/NA | 0.44–0.87 | 1 |
| Zhang [64] | 154/660 | RT-PCR/clinical features | NR | NR | NR | NR | IgM (S)/IgG (S) | LFIA | In-house test | NA | 0.82 | 0.99 |
| Lin [35] | 79/80 | RT-PCR/clinical features | NR | 35 | 43.6 | 14 | IgM (N)/IgG (N) | ELISA/CLIA | Darui Biotech, China/Tianshen Tech, Shenzhen, China | NR/NR | 0.23–0.91 | 0.78–1 |
| Hu [37] | 34/9 | RT-PCR | NR | NR | NR | NR | IgM (N,S)/IgG (N,S) | FIA | KingFocus Biomedical engineering Co., Ltd. | Cutoff values were based on of seronegative samples | 0.97-1 | 1 |
| Zhang [32] | 222/0 | RT-PCR | 39.2 | 48.2 | 64 | 20 | IgM (N,S)/IgG (N,S) | CLIA | YHLO Biotechnology (Shenzhen, China) and the high-speed CLIA system iFlash 3000, BATCH ANALYZER | Cutoff values were based on of seronegative samples | 0.83–0.99 | NA |
| Okba [56] | 12/0 | RT-PCR | NR | NR | NR | 11 | IgG (S) | ELISA | EUROIMMUN Medizinische Labordiagnostika AG | Cutoff values set by mean of seronegative samples plus 6SD | 0.92 | 1 |
| Zhang [63] | 3/733 | RT-PCR/clinical features | 66.6 | 66.6 | 50.67 | 10 | IgM (N,S)/IgG (N,S) | CLIA | YHLO Biotechnology (Shenzhen, China) | 10 AU/mL | 1 | 0.98 |
| Zhao [66] | 69/412 | NR-NAT/clinical features | NR | NR | NR | NR | IgM (S)/IgG (S) | ELISA | In-house test | Cutoff values were based on seronegative samples | 0.97 | 0.97 |
| Pan [57] | 86/0 | RT-PCR/clinical features | NR | 45.7 | 58 | 12 | IgM (N,S)/IgG (N,S) | LFIA | ZhuHai LivZon, Diagnostics | NA | 0.55–0.69 | NA |
| Lou [31] | 80/300 | RT-PCR/clinical features | 33 | 61.3 | 55 | 15 | IgM (N,S)/IgG (N,S) | ELISA/CLIA/LFIA | Beijing Wantai Biological Pharmacy Enterprise Co., Ltd., China (Beijing, China)/Xiamen InnoDx Biotech Co., Ltd. | NR/NR/NA | 0.86–0.97 | 0.95–1 |
| Liu [27] | 133/0 | RT-PCR/clinical features | 66.9 | 52.6 | 68.5 | NR | IgM (N,S)/IgG (N,S) | CLIA | YHLO Biotechnology (Shenzhen, China) | 10 AU/mL | 0.79–0.97 | NA |
| Tan [59] | 65/0 | RT-PCR/clinical features | 43.3 | 52.2 | 49 | 15 | IgM (N)/IgG (N) | ELISA | ZhuHai LivZon, Diagnostics | Titer cutoff value set according to non-responders | 0.43–0.78 | NA |
| To [60] | 16/0 | RT-PCR/sequencing/clinical features | 43.5 | 56.5 | 62 | 20 | IgM (N,S)/IgG (N,S) | ELISA | In-house test | Cutoff set by mean of seronegative samples plus 3SD | 0.87–1 | NA |
| Xiao [29] | 34/0 | RT-PCR/clinical features | NR | 64.7 | 55 | 25 | IgM (N,S)/IgG (N,S) | CLIA | YHLO Biotechnology (Shenzhen, China) | 10 AU/mL | 0.82–0.94 | NA |
| Cassaniti [47] | 30/38 | RT-PCR | NR | 83.3 | 73.5/61.5 | 7 | IgM (N,S)/IgG (N,S) | LFIA | VivaChekTM | NA | 0.13–0.83 | 1 |
| Liu [53] | 214/100 | RT-PCR | NR | NR | NR | 15 | IgM (N,S)/IgG (N,S) | ELISA | ZhuHai LivZon, Diagnostics | A450: 0.100/0.130 | 0.68–0.77 | 1 |
| Li [26] | 397/128 | RT-PCR | NR | NR | NR | 20 | IgM (S)/IgG (S) | LFIA | Jiangsu Medomics Medical Technologies | NA | 0.7–0.82 | 0.91 |
| Zhao [65] | 173/0 | RT-PCR/clinical features | 18.5 | 48.5 | 48 | 7 | IgM (S)/IgG (S) | ELISA | Beijing Wantai Biological Pharmacy Enterprise Co., Ltd. | Cutoff value set by seronegative samples | 0.65–0.93 | NA |
| Bai [45] | 6/0 | RT-PCR/clinical features | 16.7 | 50 | 49 | 2 | IgM (N,S) | LFIA | Institute of Microbiology and Epidemiology of the Military Medical Research Institute and Beijingh Rejing Biotecnology Co., Ltd. | NA | 0.83 | NA |
| Zheng [67] | 55/0 | RT-PCR/clinical features | 40 | 43.6 | 60 | 11 | IgM (N,S)/IgG (N,S) | CLIA | Not Reported | NR | 0.82–0.98 | NA |
| Zeng [61] | 6/0 | RT-PCR/clinical features | 0 | 0 | NR | NR | IgM (N,S)/IgG (N,S) | CLIA | YHLO Biotechnology (Shenzhen, China) | 10 AU/mL | 0.83 | 1 |
| Guo [50] | 140/285 | RT-PCR/sequencing/clinical features | 23.6 | NR | NR | 13 | IgM (N) | ELISA | In-house test | A450: 0.130/0.300 | 0.83 | 1 |
| Jin [51] | 27/33 | RT-PCR | 0 | 39.5 | 47 | 16 | IgM (N,S)/IgG (N,S) | CLIA | YHLO Biotechnology (Shenzhen, China) | 10 AU/mL | 0.48–0.89 | 0.9-1 |
| Du [25] | 60/0 | NR-NAT/clinical features | NR | NR | NR | 43 | IgM (N,S)/IgG (N,S) | CLIA | YHLO Biotechnology (Shenzhen, China) | 10 AU/mL | 0.78–1 | NA |
| Wölfel [36] | 9/0 | RT-PCR/clinical features | 0 | NR | NR | 18 | IgM (S)/IgG (S) | FIA | In-house with reagents from Euroimmun AG, Lübeck, Germany | NR | 0.66–1 | NA |
| Zhong [68] | 47/300 | NR-NAT | 23.4 | 34 | 48.21 | 15 | IgM (N,S)/IgG (N,S) | ELISA / CLIA | In-house test | A450: IgM(N) 0.059, IgM(S) 0.167/IgG(N) 0.036, IgG(S) 0.079/NR | 0.89–0.98 | 0.85–0.97 |
| Lassaunière [30] | 30/82 | RT-PCR | 100 | NR | NR | NR | IgM (N,S)/IgG (N,S) | ELISA / LFIA | Εuroimmun Medizinische Labordiagnostika, Lübeck, Germany/Beijing Wantai Biological Pharmacy Enterprise, Beijing, China/Dynamiker Biotechnology, Tianjin, China/CTK Biotech, Poway, CA, USA/AutoBio Diagnostics, Zhengzhou, China/Artron, Laboratories, Burnaby, Canada | NR/NA | 0.66–0.93 | 0.95–1 |
| Gao [48] | 38/0 | RT-PCR/clinical features | 7.9 | 55.3 | 40.5 | 16 | IgM (N,S)/IgG (N,S) | LFIA | Innovita Biological Technology Co., Ltd. | NA | 0.51–0.92 | NA |
| Zeng [62] | 27/36 | RT-PCR/clinical features | 63 | 51.8 | 62 | 18 | IgM (N)/IgG (N) | ELISA | ZhuHai LivZon, Diagnostics | A450: 0.105/0.105 | 1 | 1 |
| Garcia [49] | 118/45 | RT-PCR/clinical features | NR | 67.8 | 65.14 | 14 | IgM (N,S)/IgG (N,S) | LFIA | Biotech AllTest, Hangzhou, China | NA | 0.31–0.69 | 1 |
| Paradiso [58] | 191/0 | RT-PCR/clinical features | NR | 60.62 | 58.5 | 4 | IgM (N,S)/IgG (N,S) | LFIA | VivaChekTM | NA | 0.14–0.16 | NA |
| Bendavid [46] | 122/456 | RT-PCR | NR | NR | NR | NR | IgM (N,S)/IgG (N,S) | LFIA | Premier Biotech | NA | 0.67–0.92 | 0.99–1 |
Severe Covid19 (%): Percentage of severe cases with Covid19. Male cases (%): Percentage of male cases. NR: not reported. NR-NAT: A nucleic acid test was used but the exact type of the test was not reported. NA: Not applicable. Multiple values for specificity and specificity are recorded in each study because different assays were used in most cases (i.e., IgG, IgM, and so on).
Table 2.
Results of the meta-analysis for the different types of antibody tests. We list the characteristics of the included studies, the pooled sensitivity and specificity along with the 95% confidence intervals, the variables that were found statistically significant in meta-regression, and the results of the tests for publication bias. For the description of the test, the antibodies (Ab) and antigens (Ag), see Methods section (mdfo: mean days from onset; severe: percent of patients with severe or critical condition; NA: not applicable). N: nucleocapsid protein, S: spike protein, NS: nucleocapsid and Spike proteins.
| Method | Ab | Ag | Studies/Patients | Sensitivity (95% CI) | Specificity (95% CI) | Covariates | Begg’s/Egger’s |
|---|---|---|---|---|---|---|---|
| ELISA | IgG | N | 8/1472 | 0.747 (0.509, 0.984) | 0.994 (0.988, 0.999) | mdfo, severe | -/- |
| ELISA | IgG | S | 7/1072 | 0.814 (0.688, 0.940) | 0.961 (0.910, 1.000) | - | -/- |
| ELISA | IgM | N | 8/1717 | 0.722 (0.449, 0.996) | 0.995 (0.989, 1.000) | - | -/- |
| ELISA | IgM | S | 6/1328 | 0.817 (0.704, 0.931) | 0.991 (0.976, 1.000) | - | -/- |
| ELISA | IgG/IgM | N | 2/423 | 0.808 (0.764, 0.853) | 0.967 (0.915, 0.987) | NA | NA |
| ELISA | IgG/IgM | S | 5/1244 | 0.935 (0.900, 0.971) | 0.987 (0.973, 1.000) | - | -/- |
| LFIA | IgG | S | 2/535 | 0.537 (0.123, 0.951) | 0.914 (0.853, 0.951) | NA | NA |
| LFIA | IgG | NS | 8/944 | 0.650 (0.404, 0.895) | 0.988 (0.973, 1.000) | mdfo | -/- |
| LFIA | IgG | S/NS | 10/1479 | 0.626 (0.439, 0.814) | 0.964 (0.922, 1.000) | - | -/- |
| LFIA | IgM | S | 2/535 | 0.663 (0.236, 1.000) | 0.914 (0.852, 0.951) | NA | NA |
| LFIA | IgM | NS | 9/1059 | 0.528 (0.329, 0.726) | 0.986 (0 974, 0.998) | - | -/- |
| LFIA | IgM | S/NS | 11/1594 | 0.555 (0.352, 0.758) | 0.979 (0.958, 0.999) | - | -/- |
| LFIA | IgG/IgM | S | 2/824 | 0.828 (0.770, 0.886) | 0.994 (0.984, 0.998) | NA | NA |
| LFIA | IgG/IgM | NS | 8/1373 | 0.777 (0.592. 0.962) | 0.986 (0.973, 1.000) | mdfo | -/- |
| LFIA | IgG/IgM | S/NS | 10/2197 | 0.793 (0.643, 0.942) | 0.989 (0.978, 0.999) | mdfo | -/- |
| LFIA | IgG/IgM | S/N/NS | 11/2376 | 0.800 (0.663, 0.935) | 0.984 (0.969, 0.999) | mdfo | -/- |
| CLIA | IgG | NS | 12/2320 | 0.944 (0.906, 0.983) | 0 971 (0.931, 1.000) | mdfo | -/+ |
| CLIA | IgG | N/NS | 13/2479 | 0.935 (0.896, 0.975) | 0.974 (0.953, 0.994) | mdfo | -/+ |
| CLIA | IgM | NS | 12/2411 | 0.810 (0.722, 0.897) | 0.984 (0.970, 0.999) | - | -/- |
| CLIA | IgM | N/NS | 13/2570 | 0.799 (0.737, 0.860) | 0.967 (0.927, 1.000) | - | -/- |
| CLIA | IgG/IgM | NS | 2/790 | 0.907 (0.753, 1.000) | 0.981 (0.944, 1.000) | NA | NA |
| CLIA | IgG/IgM | N/NS | 3/949 | 0.902 (0.811, 0.993) | 0.954 (0.875, 1.000) | NA | NA |
| FIA | IgG | NS | 2/318 | 0.859 (0.339, 1.000) | 0.950 (0.923, 0.977) | NA | NA |
| FIA | IgG | S/NS | 3/327 | 0.890 (0.591, 1.000) | 0.950 (0.923, 0.977) | NA | NA |
| FIA | IgM | NS | 2/318 | 0.860 (0.500, 1.000) | 0.950 (0.923, 0.977) | NA | NA |
| FIA | IgM | S/NS | 3/327 | 0.786 (0.531, 1.000) | 0.950 (0.923, 0.977) | NA | NA |
© 2020 by the authors. Licensee MDPI, Basel, Switzerland. This article is an open access article distributed under the terms and conditions of the Creative Commons Attribution (CC BY) license (http://creativecommons.org/licenses/by/4.0/).
Share and Cite
MDPI and ACS Style
Kontou, P.I.; Braliou, G.G.; Dimou, N.L.; Nikolopoulos, G.; Bagos, P.G. Antibody Tests in Detecting SARS-CoV-2 Infection: A Meta-Analysis. Diagnostics 2020, 10, 319. https://doi.org/10.3390/diagnostics10050319
AMA Style
Kontou PI, Braliou GG, Dimou NL, Nikolopoulos G, Bagos PG. Antibody Tests in Detecting SARS-CoV-2 Infection: A Meta-Analysis. Diagnostics. 2020; 10(5):319. https://doi.org/10.3390/diagnostics10050319
Chicago/Turabian StyleKontou, Panagiota I., Georgia G. Braliou, Niki L. Dimou, Georgios Nikolopoulos, and Pantelis G. Bagos. 2020. "Antibody Tests in Detecting SARS-CoV-2 Infection: A Meta-Analysis" Diagnostics 10, no. 5: 319. https://doi.org/10.3390/diagnostics10050319
Note that from the first issue of 2016, this journal uses article numbers instead of page numbers. See further details here.