
Cladribine Alters Immune Cell Surface Molecules for Adhesion and Costimulation: Further Insights to the Mode of Action in Multiple Sclerosis

 ,
,  and
and
Abstract
:1. Introduction
2. Materials and Methods
2.1. Study Cohorts
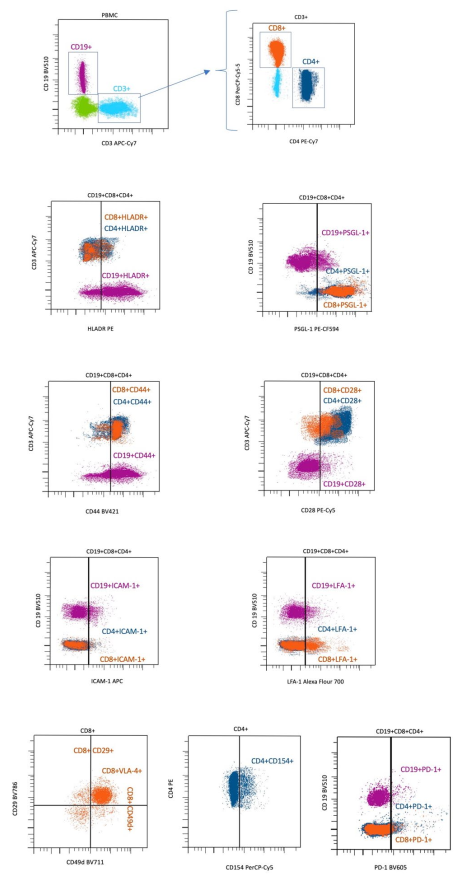
2.2. Antibodies and Flow Cytometry
2.3. Statistical Analysis
3. Results
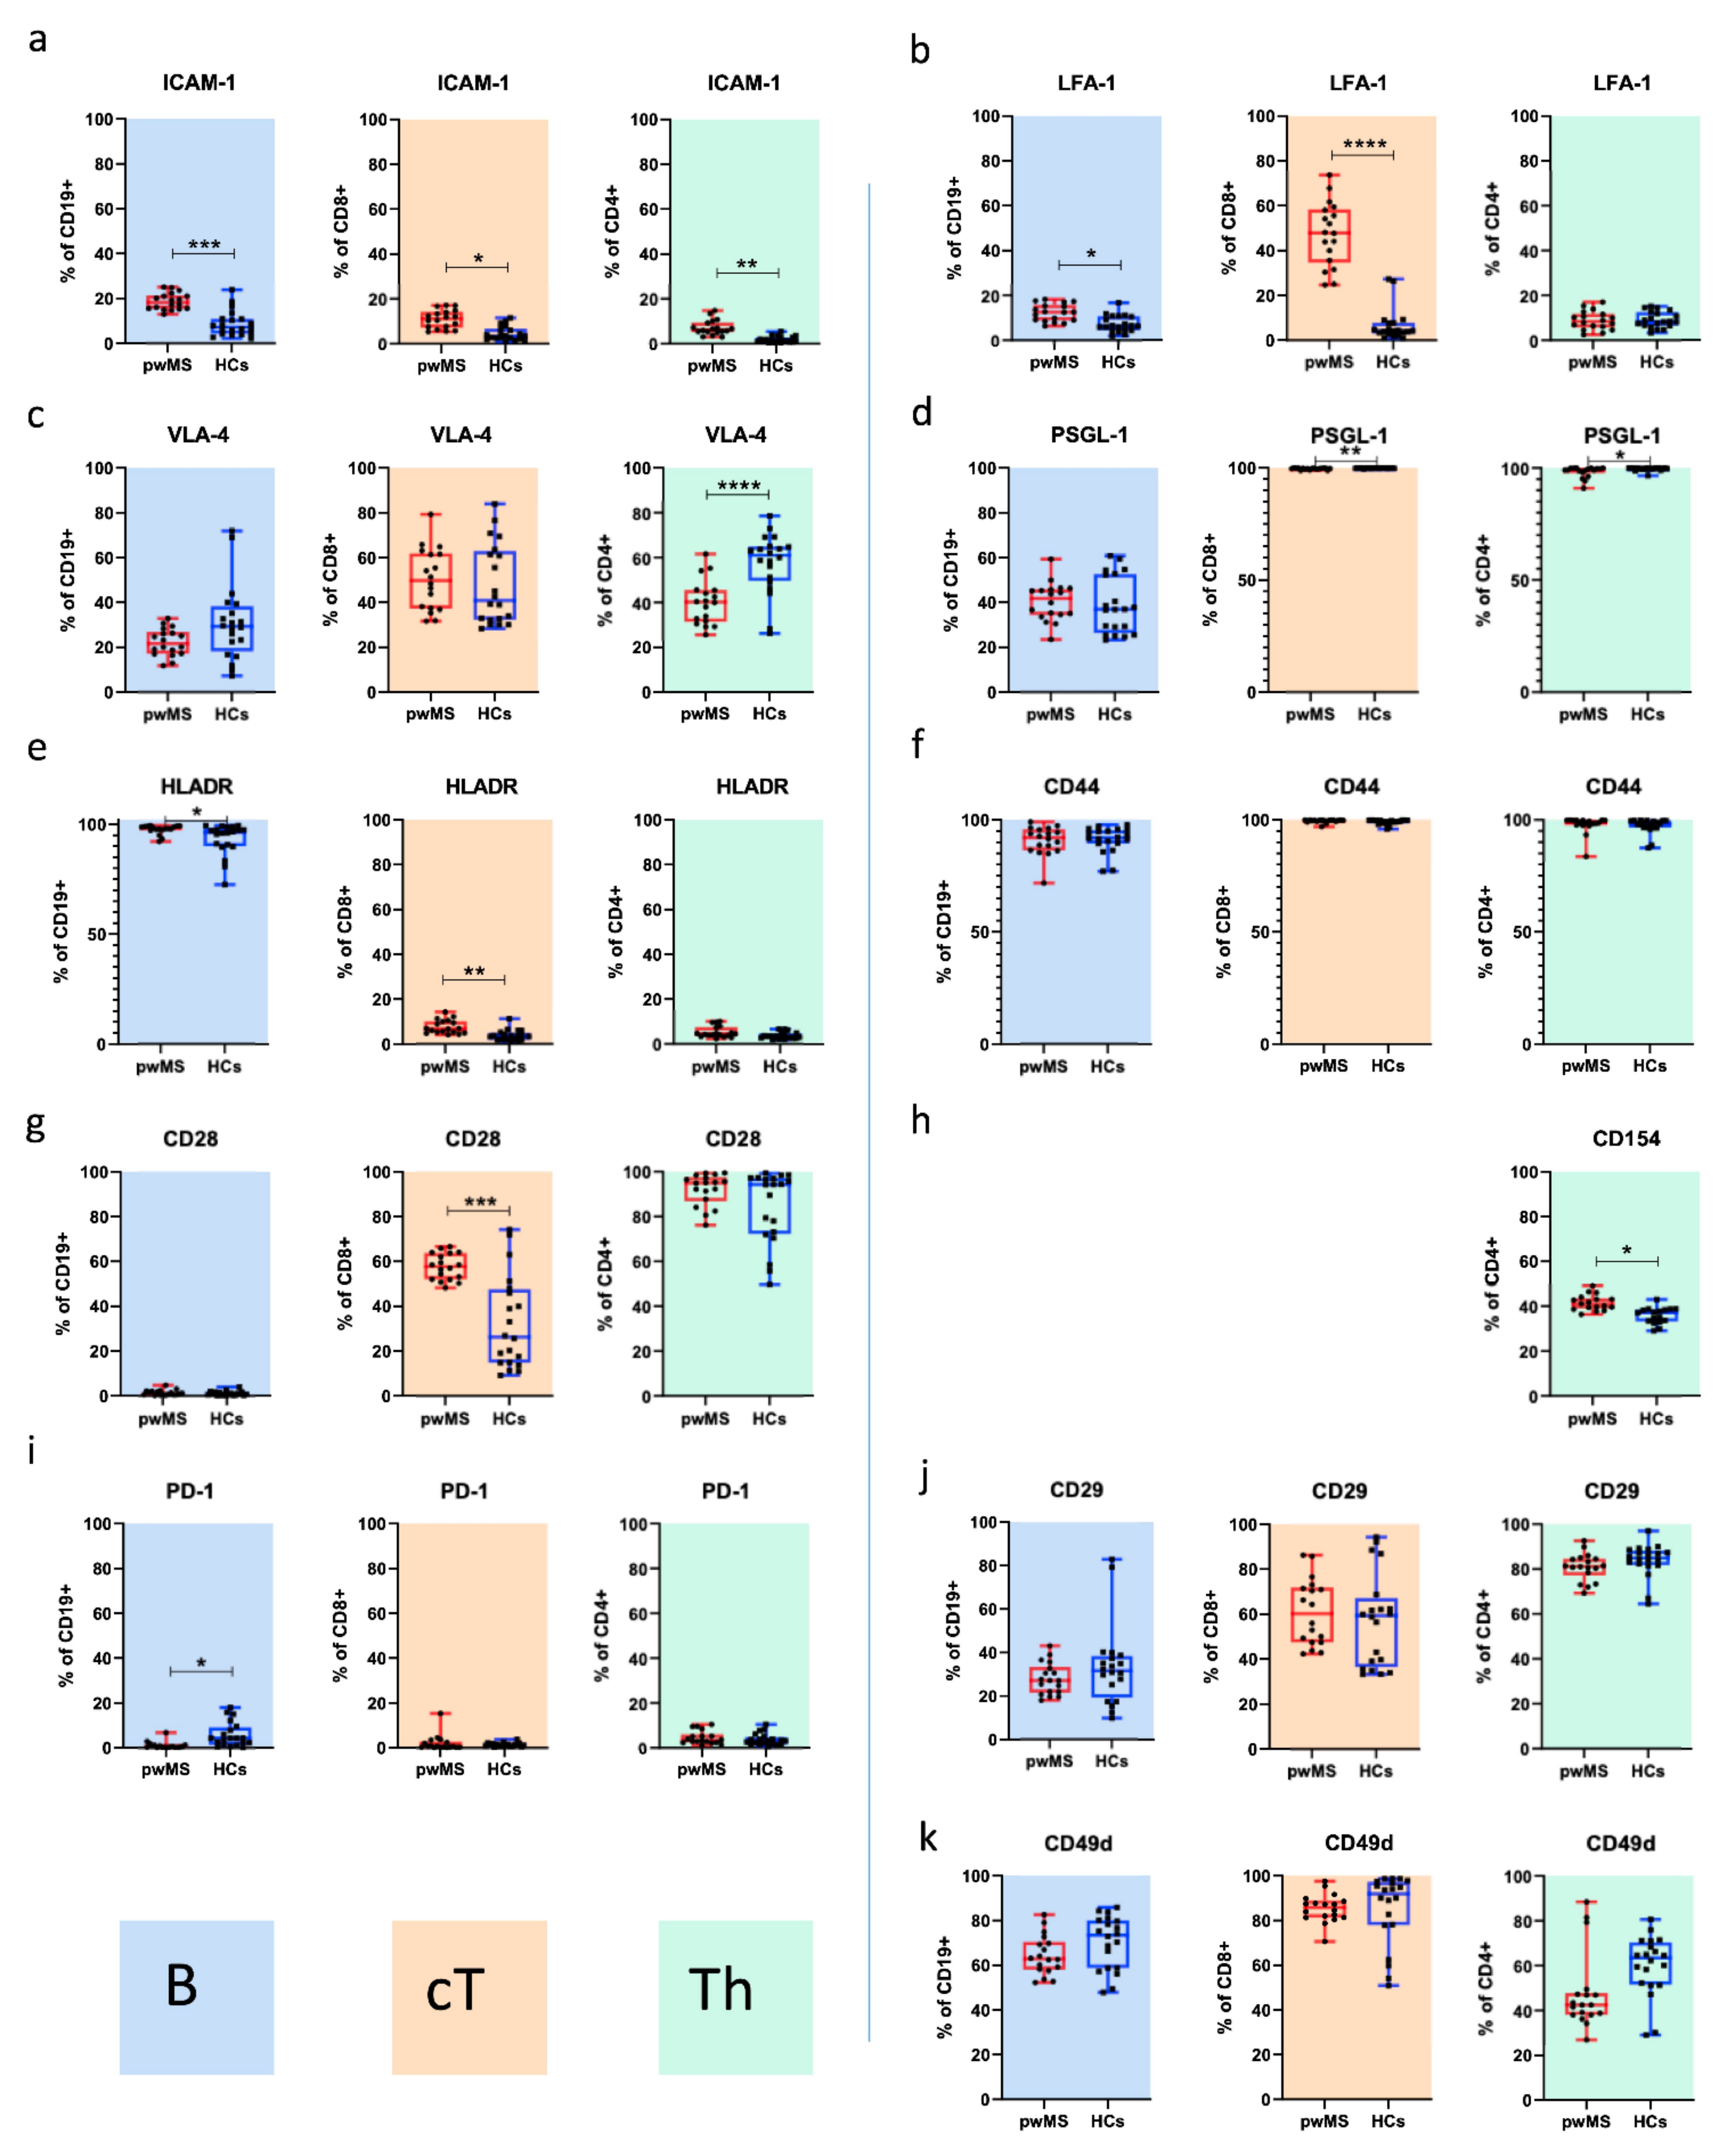
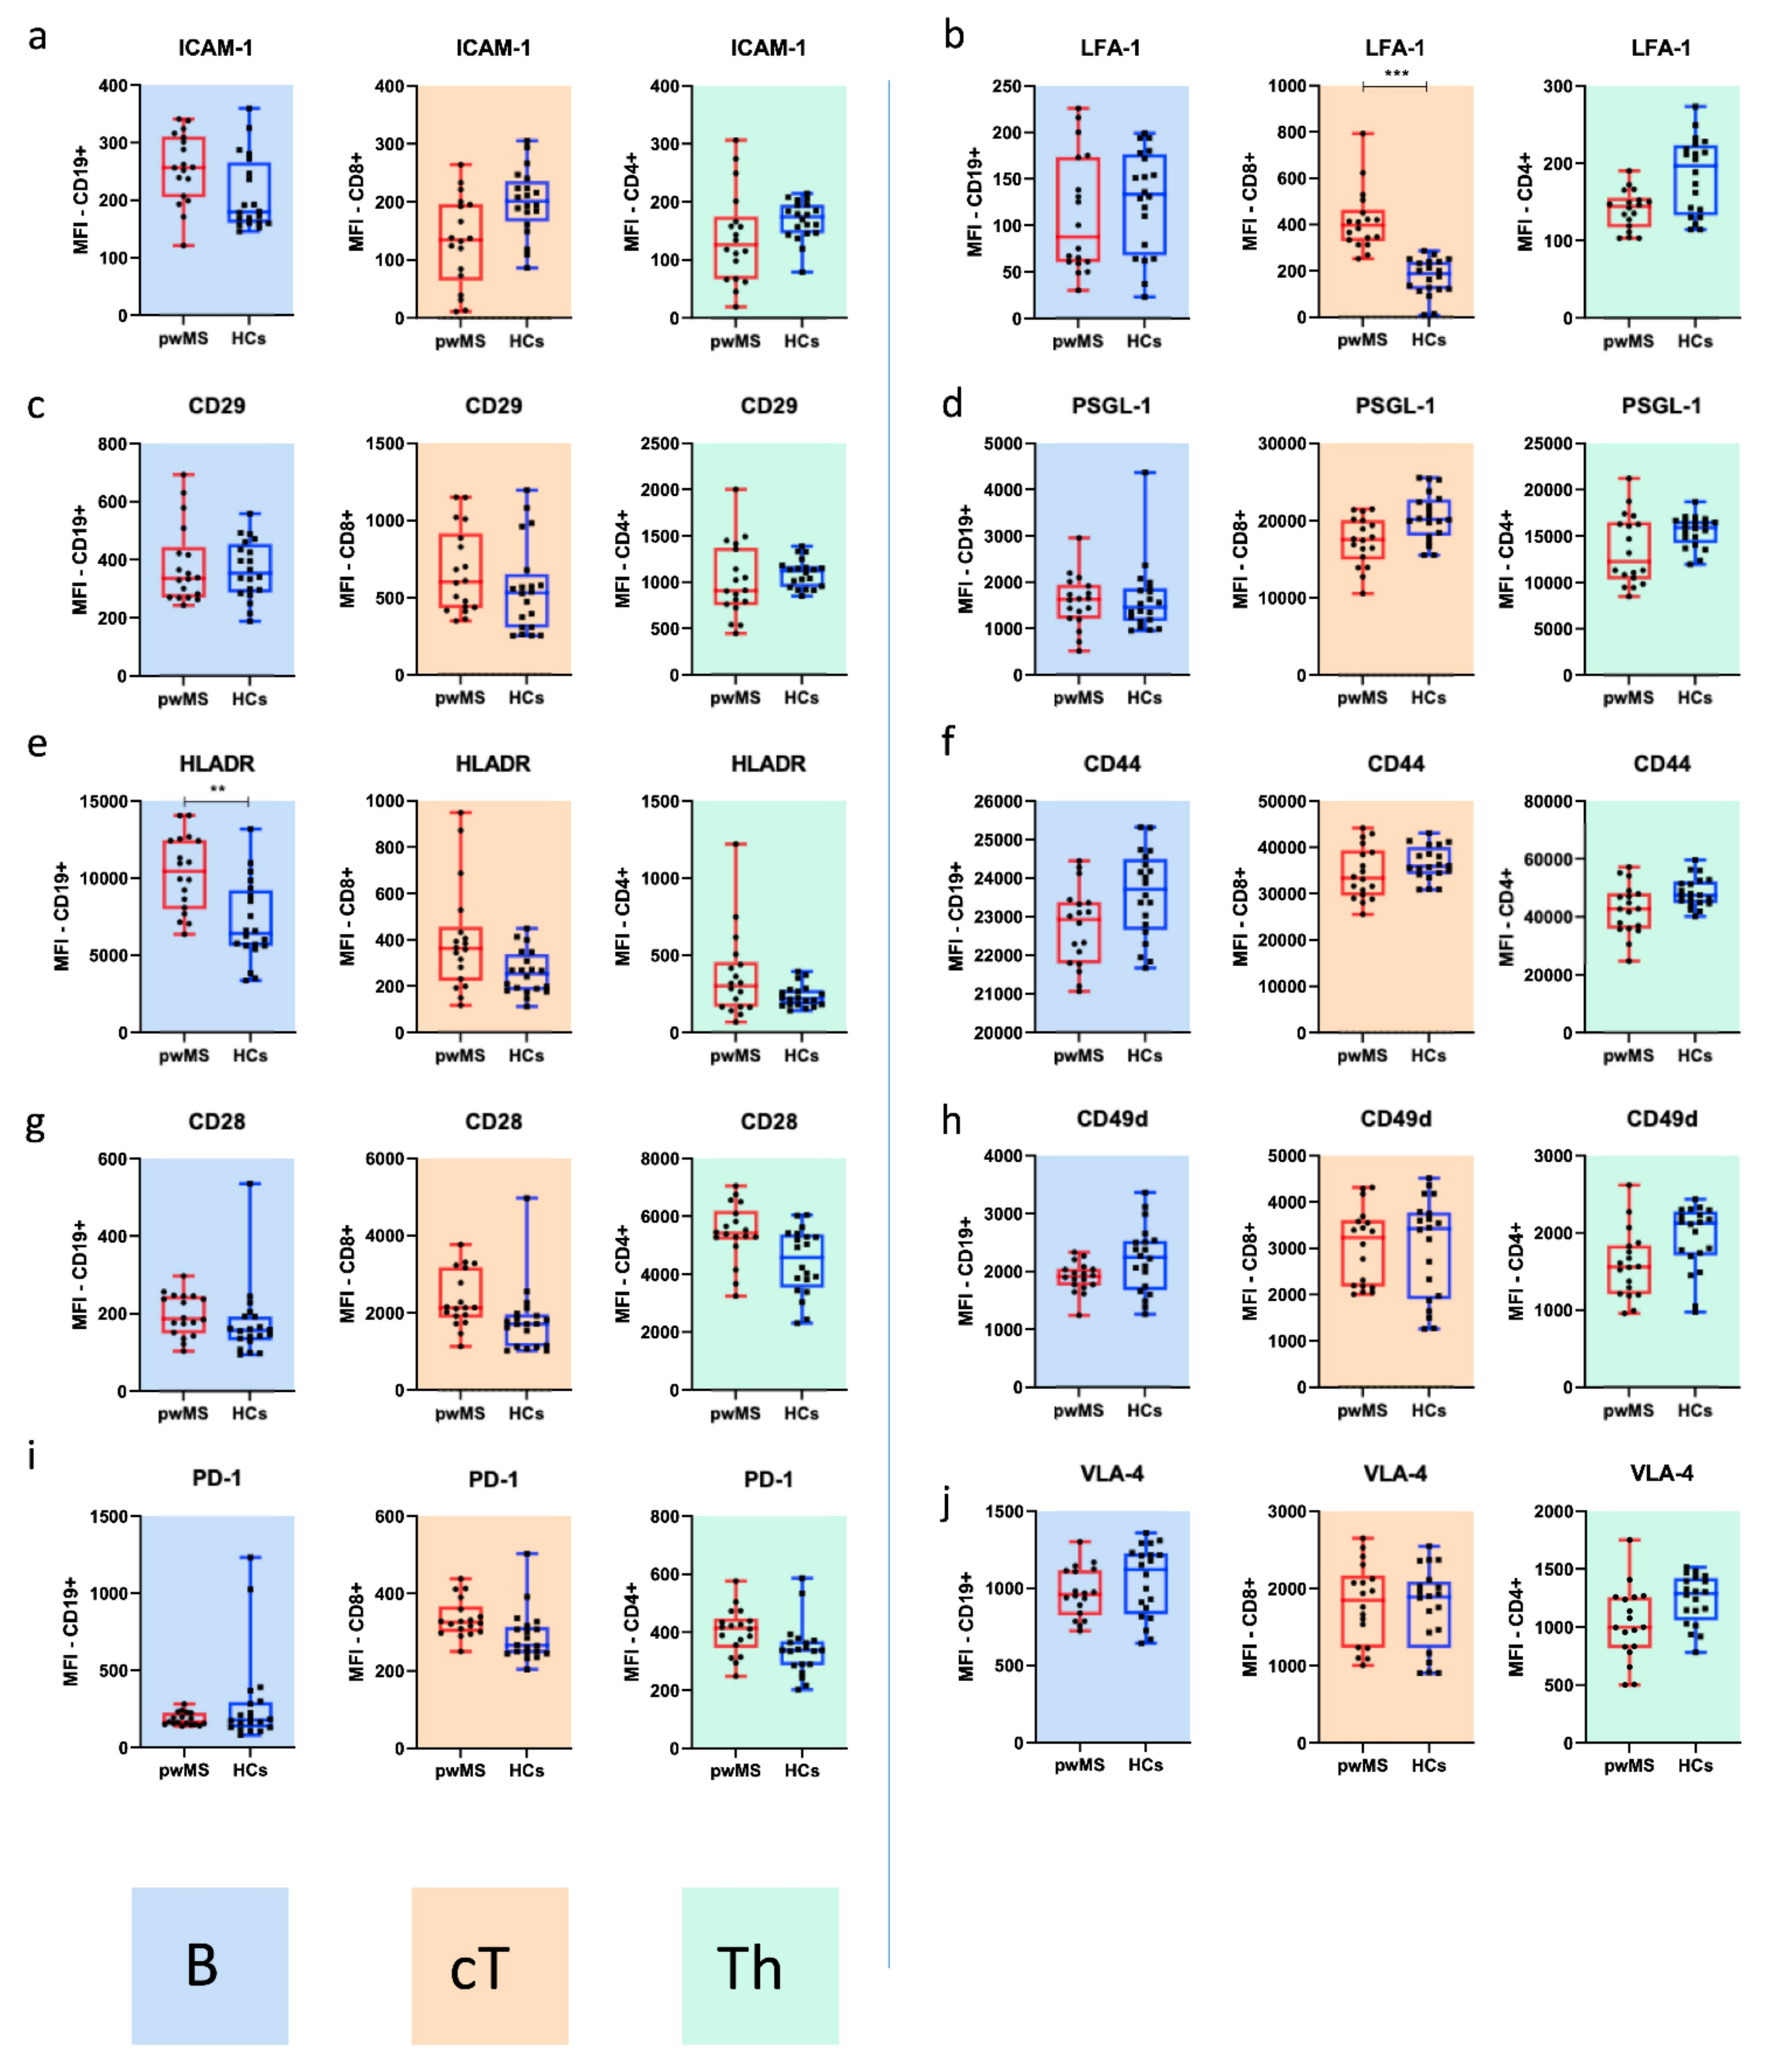
3.1. MS vs. HCs
3.1.1. Adhesion Molecules
3.1.2. Costimulatory Molecules
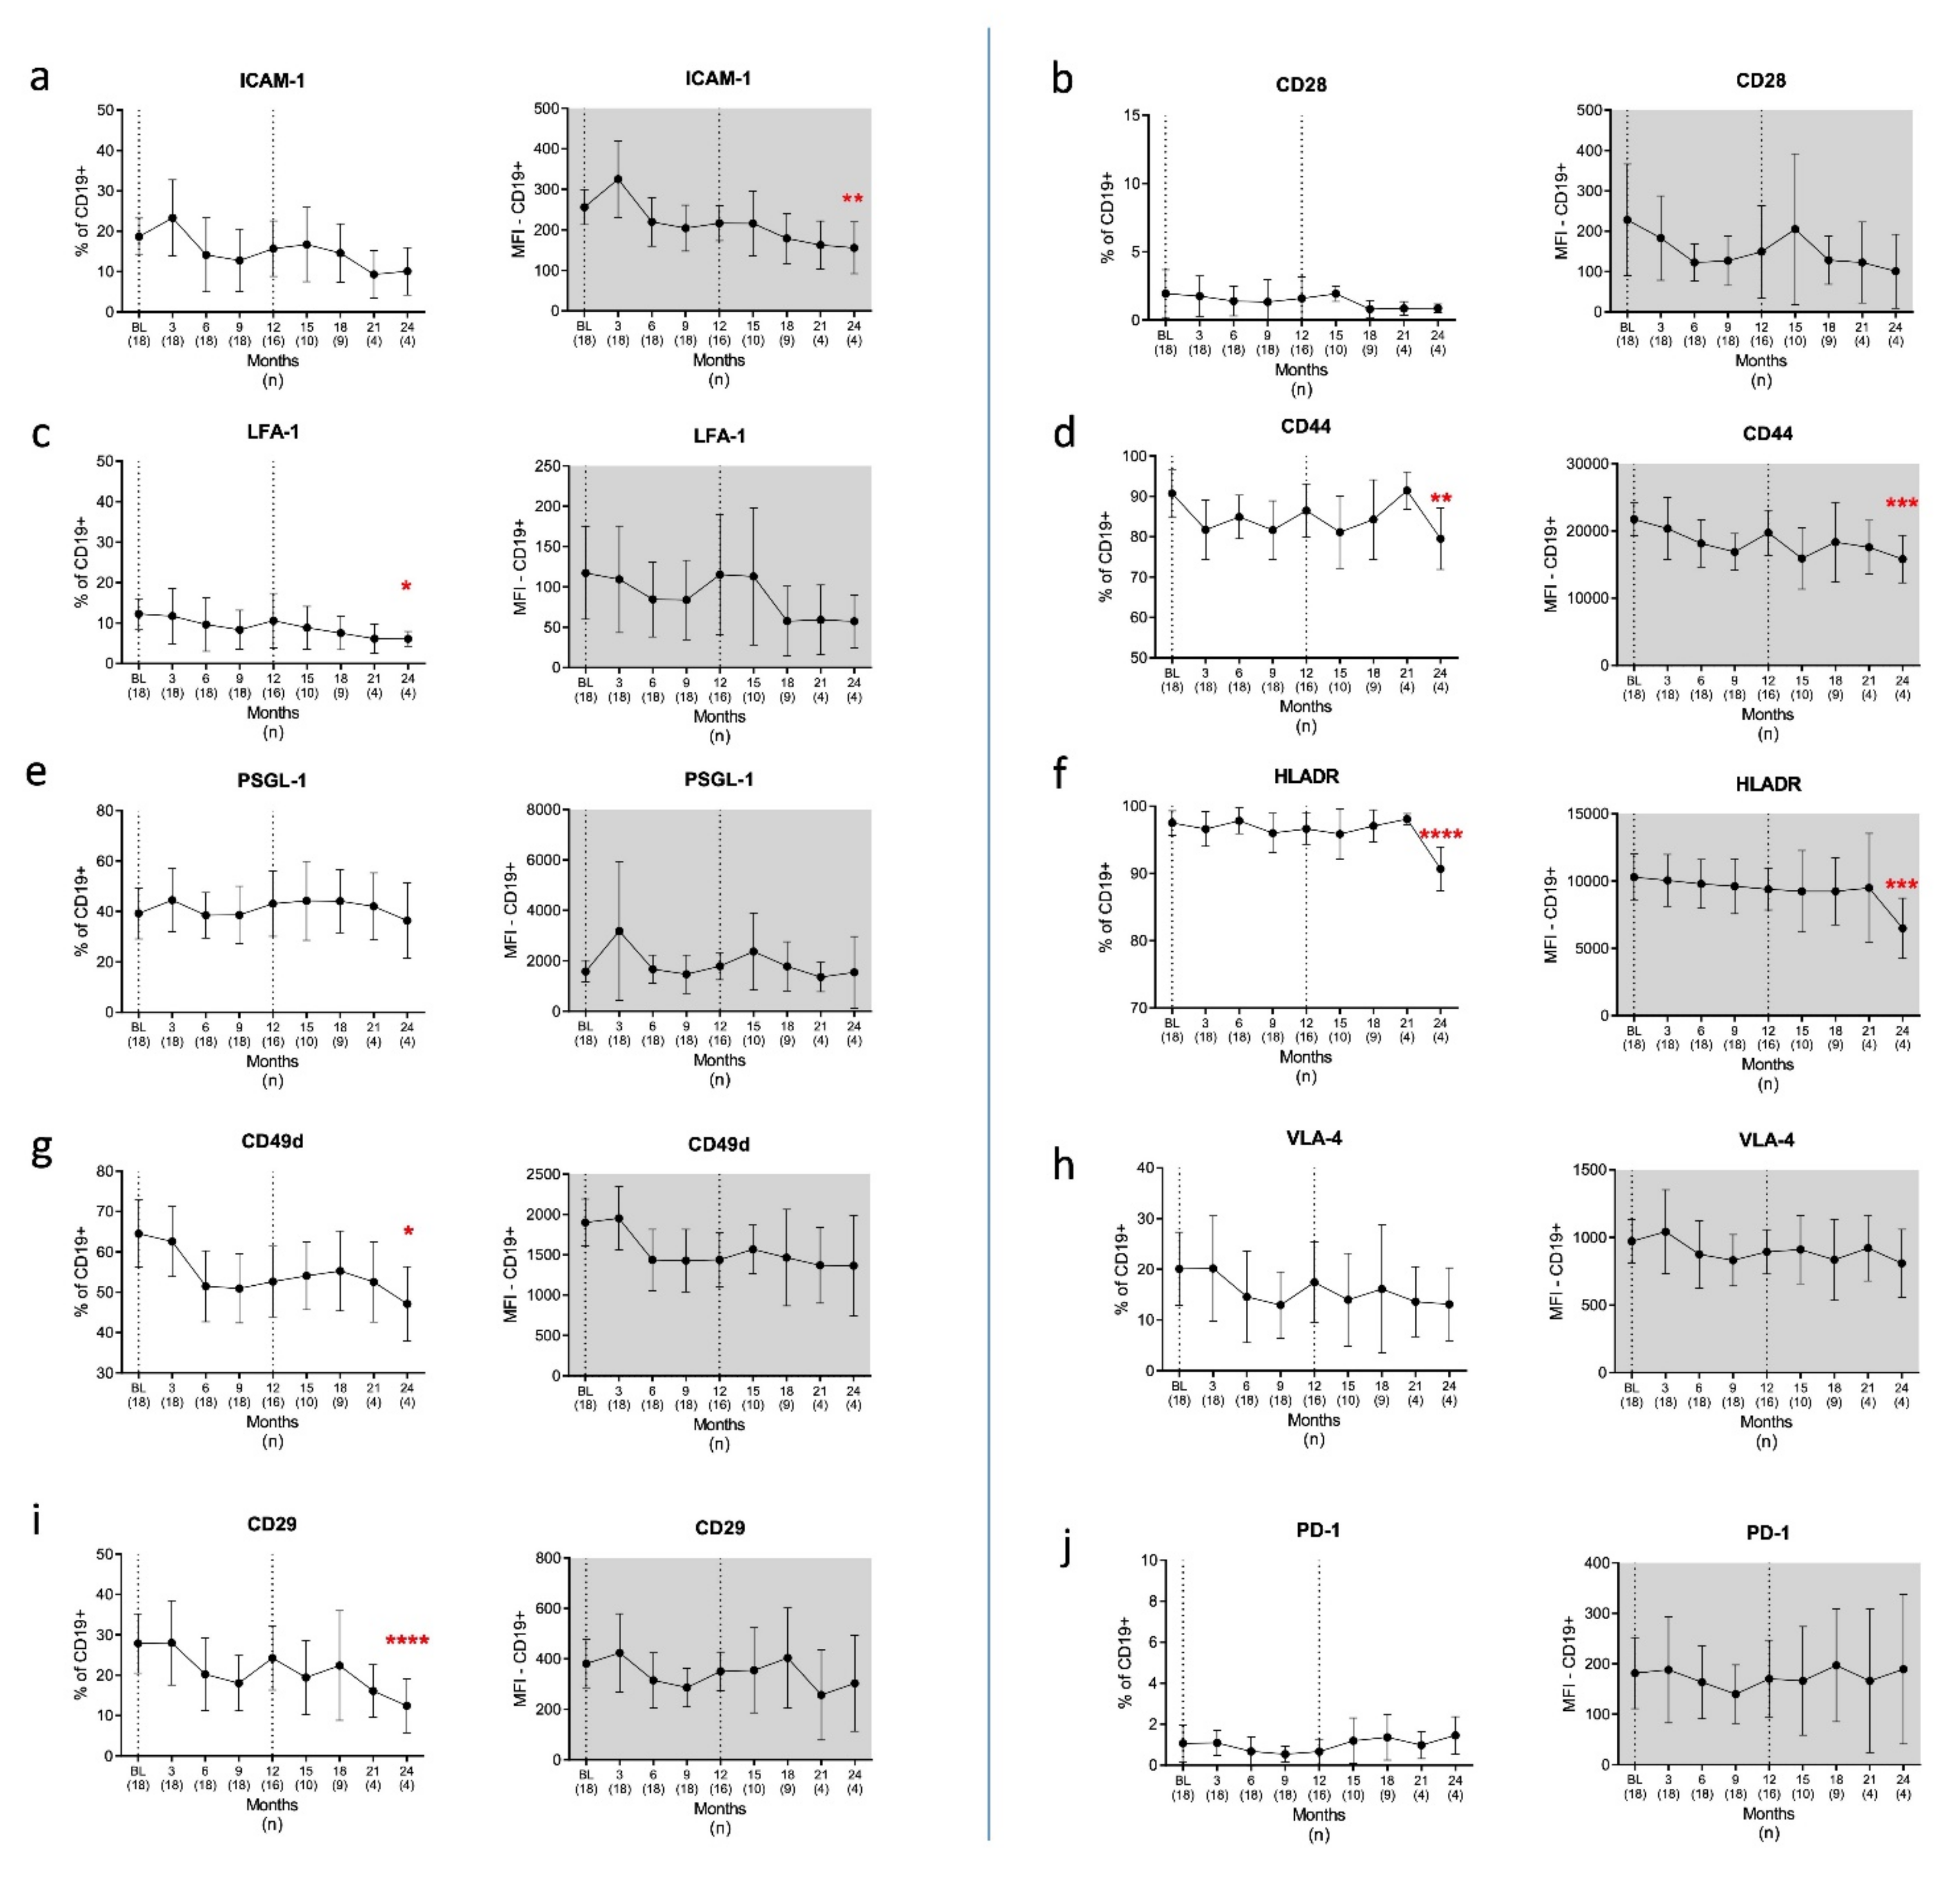
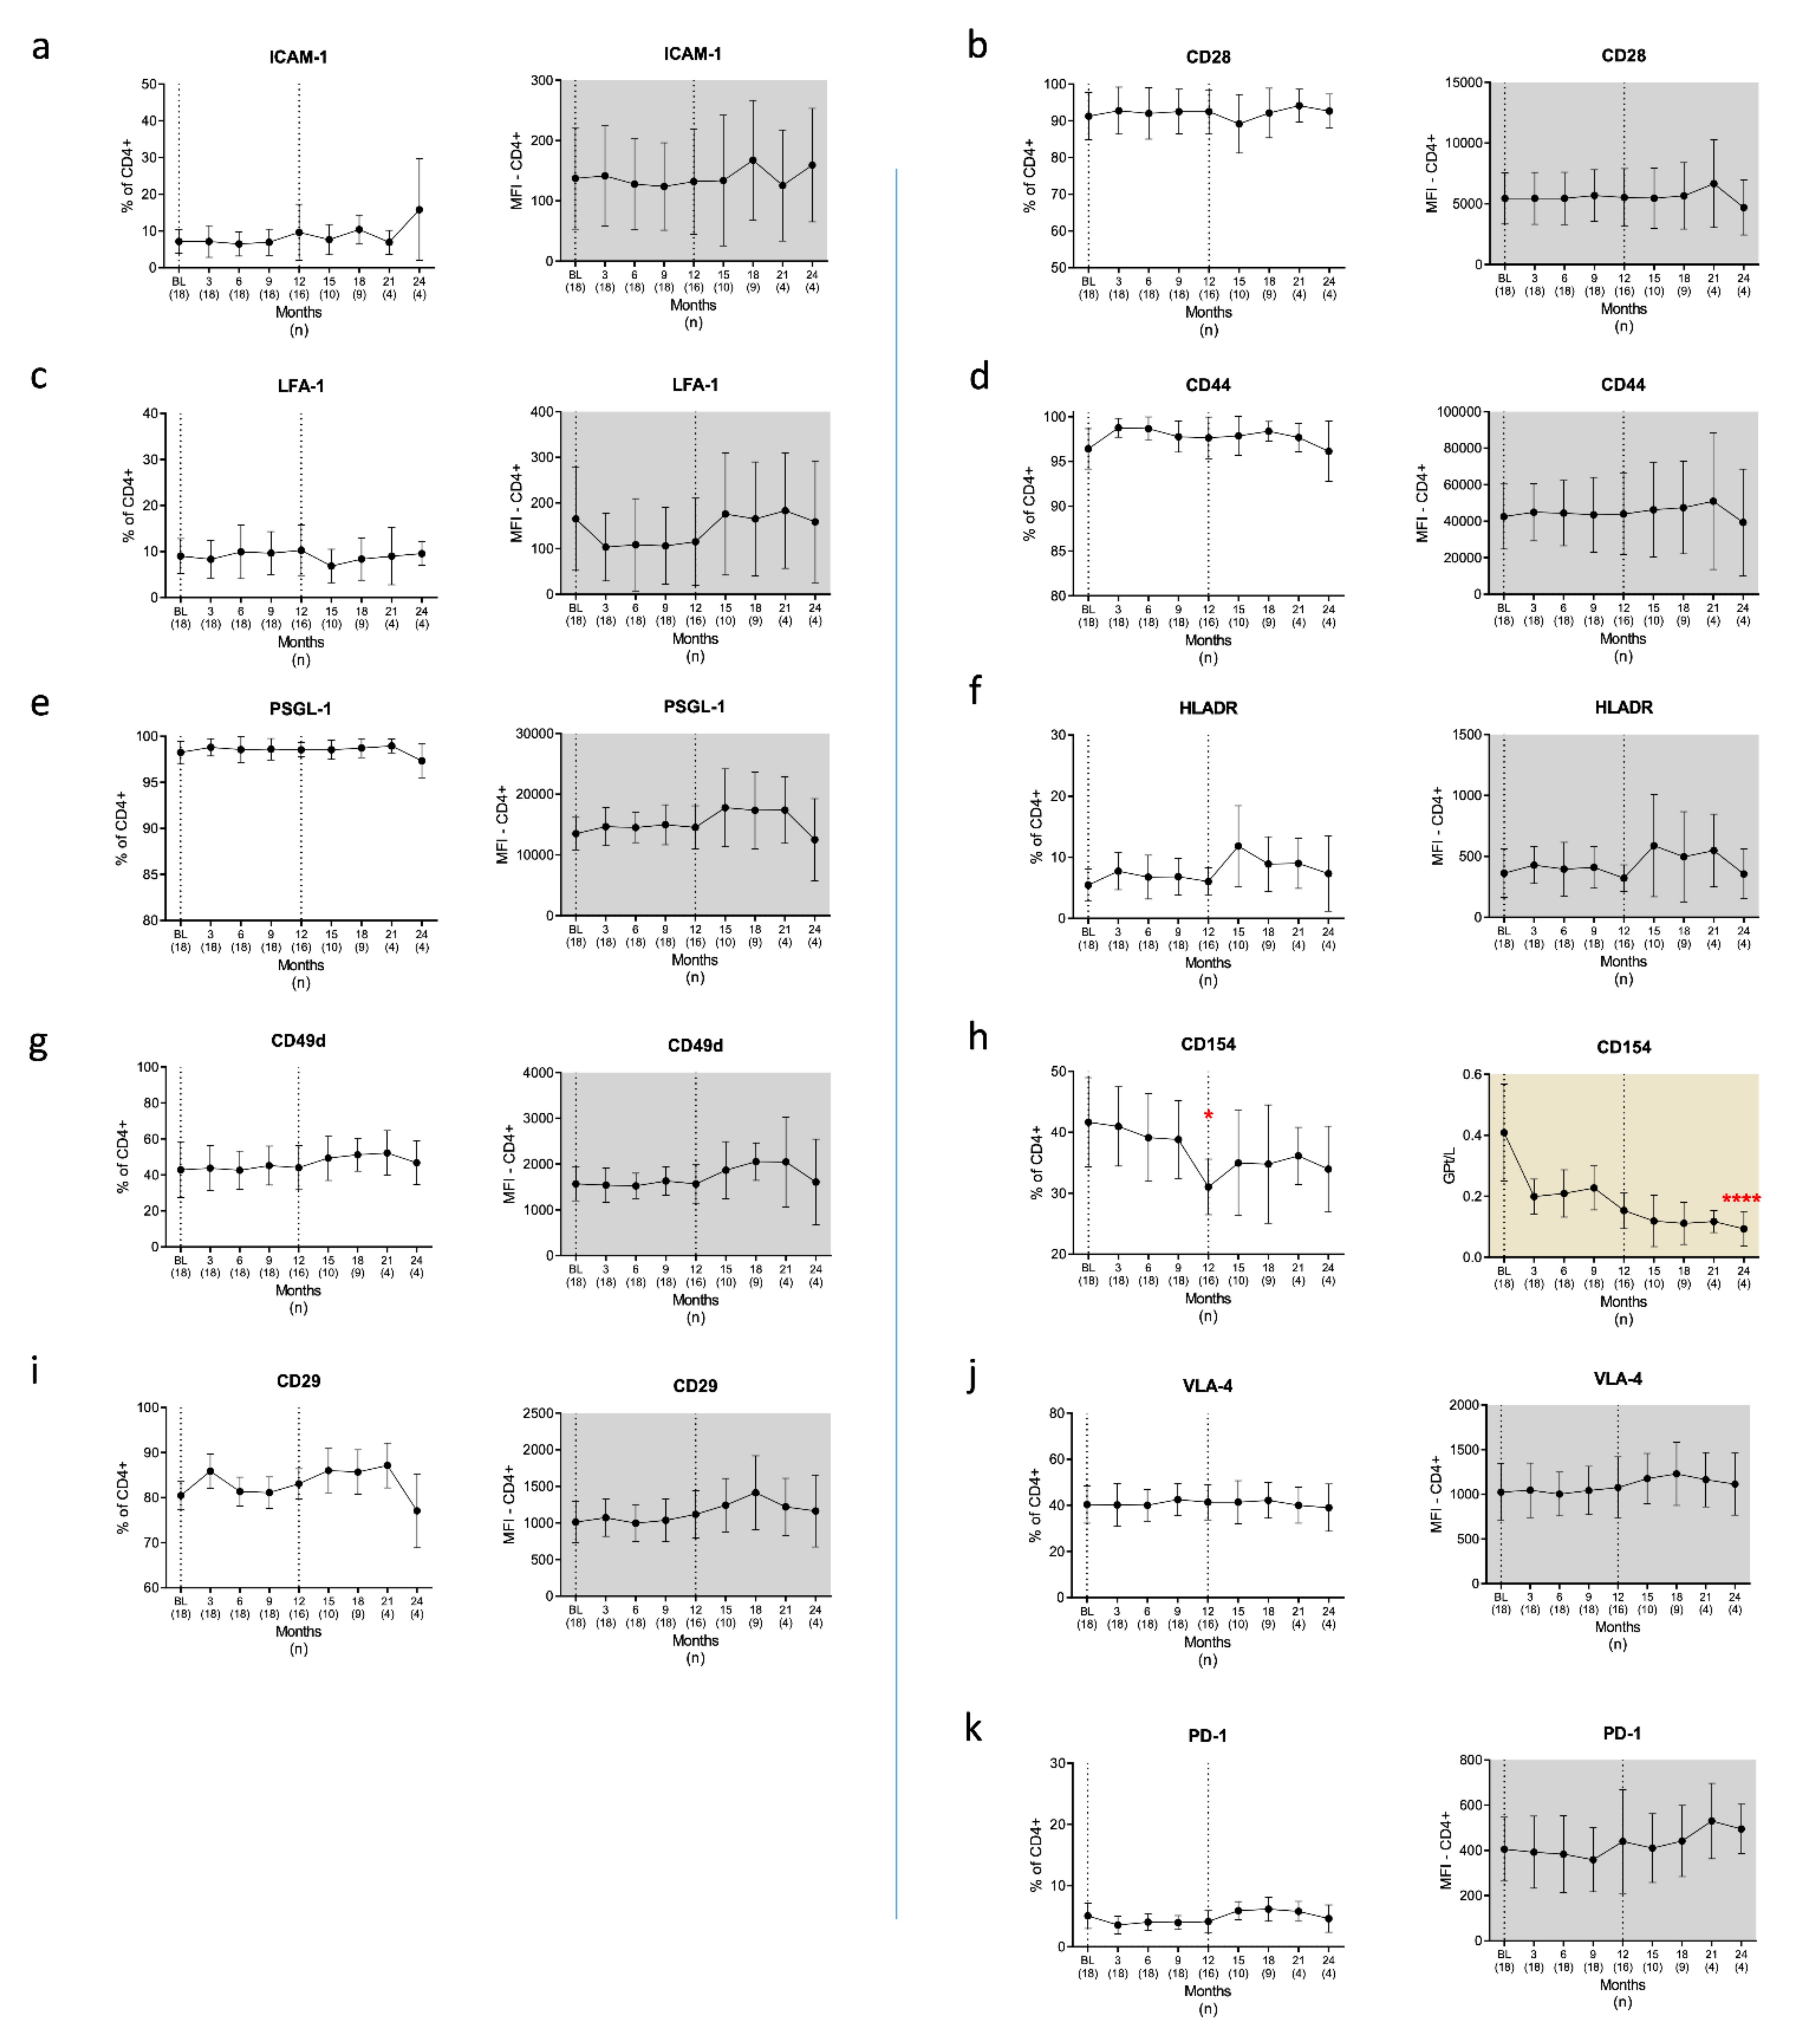
3.2. Cladribine-Associated Changes in Costimulatory and Adhesion Molecules
3.2.1. B Cells
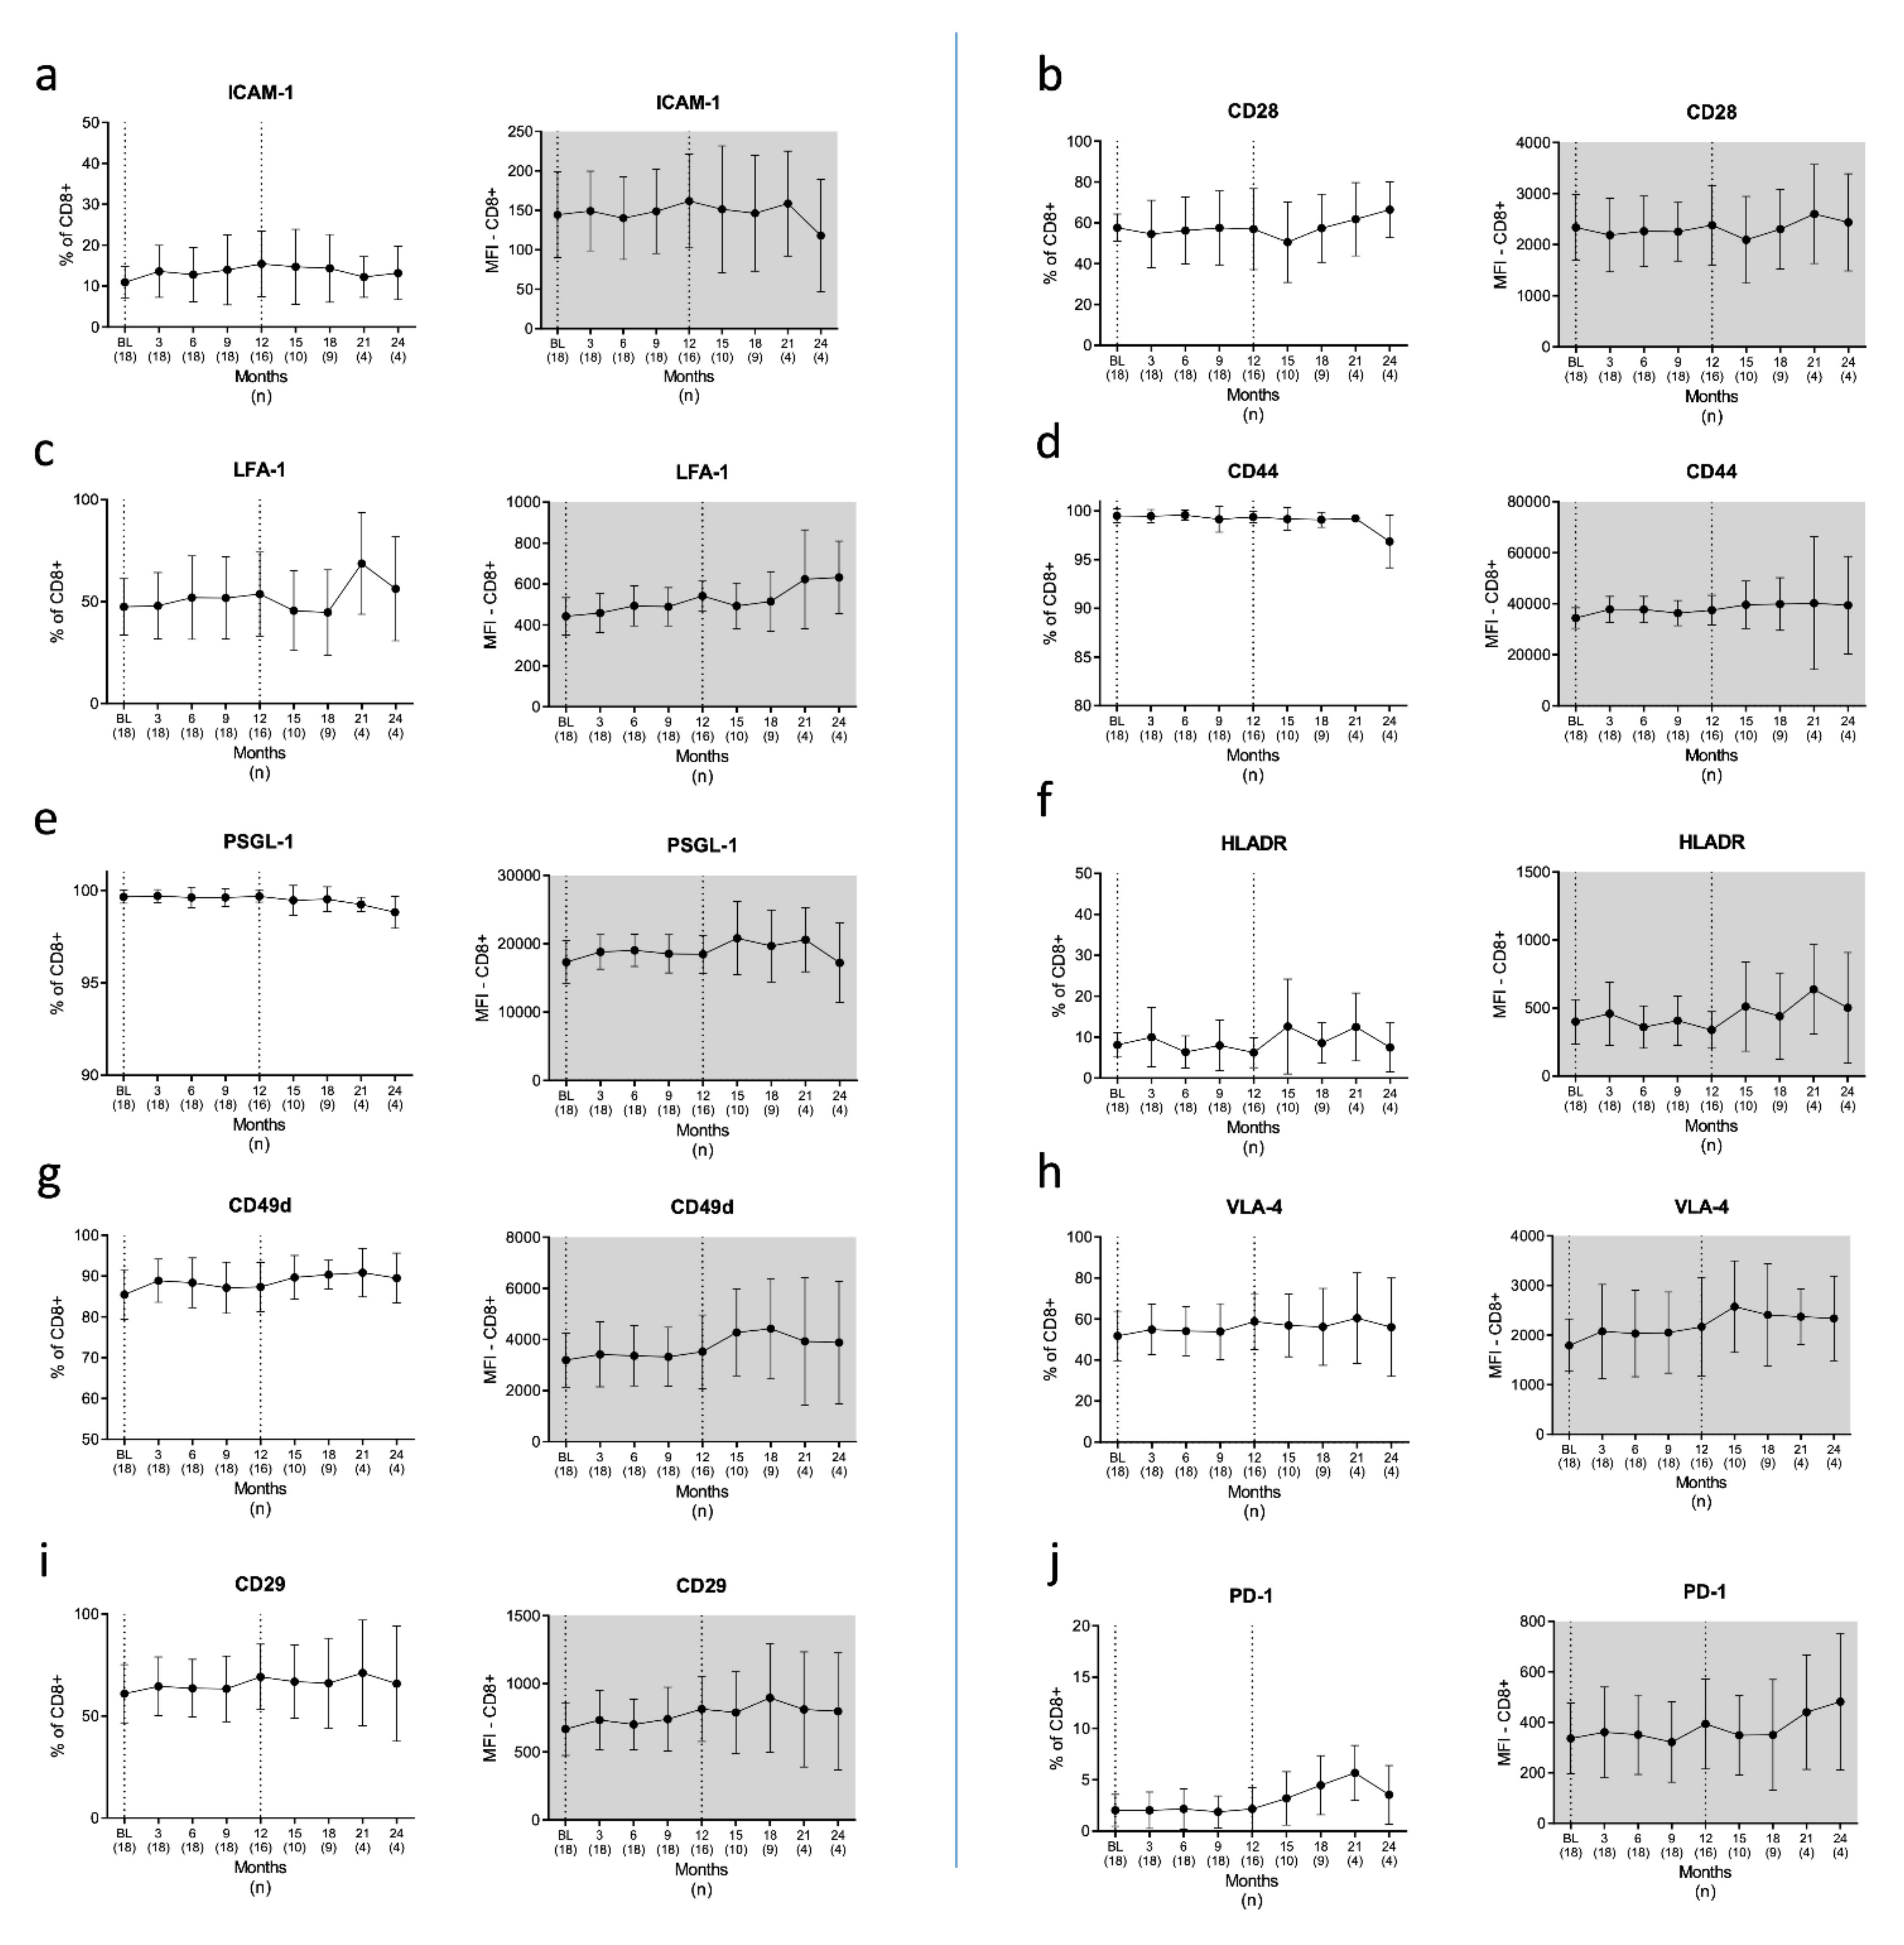
3.2.2. T Cells
4. Discussion
5. Conclusions
Author Contributions
Funding
Institutional Review Board Statement
Informed Consent Statement
Data Availability Statement
Acknowledgments
Conflicts of Interest
Appendix A

| Patient | Site | Year | Diagnosis | MS Duration (Months) | Pre-Treatment * | Relapses ** | EDSS BL | EDSS EOS |
|---|---|---|---|---|---|---|---|---|
| #1 | Austria | 2017 | RRMS | 6 | glatiramer acetate | 1 (Month 13) | 1.0 | 1.0 |
| #2 | Austria | 2018 | RRMS | 18 | - | - | 2.5 | 2.5 |
| #3 | Austria | 2018 | RRMS | 44 | daclizumab | - | 2.0 | 2.5 |
| #4 | Austria | 2018 | RRMS | 95 | interferon-beta | - | 3.5 | 3.0 |
| #5 | Austria | 2018 | RRMS | 47 | dimethyl fumarate | - | 1.5 | 0 |
| #6 | Austria | 2018 | RRMS | 301 | fingolimod | 2 (Months 3 and 6) | 3.5 | 4.0 |
| #7 | Austria | 2018 | RRMS | 98 | glatiramer acetate | - | 1.5 | 1.0 |
| #8 | Austria | 2018 | RRMS | 184 | fingolimod | - | 1.0 | 1.5 |
| #9 | Austria | 2018 | RRMS | 33 | dimethyl fumarate | 1 (Month 13) | 2.0 | 2.0 |
| #10 | Austria | 2018 | RRMS | 18 | interferon-beta | - | 2.0 | 0 |
| #11 | Austria | 2019 | RRMS | 24 | - | - | 0 | 0 |
| #12 | Austria | 2019 | RRMS | 113 | glatiramer acetate | - | 0 | 0 |
| #13 | Austria | 2019 | RRMS | 107 | teriflunomide | - | 0 | 0 |
| #14 | Austria | 2019 | RRMS | 207 | IVIG | - | 3.0 | 2.5 |
| #15 | Germany | 2018 | SPMS | 252 | daclizumab | - | 4.5 | 5.5 |
| #16 | Germany | 2018 | RRMS | 96 | fingolimod | - | 3.0 | 3.5 |
| #17 | Germany | 2018 | SPMS | 143 | - | - | 7.0 | 7.0 |
| #18 | Germany | 2018 | RRMS | 110 | - | - | 2.0 | 1.5 |


References
- Van Langelaar, J.; Rijvers, L.; Smolders, J.; van Luijn, M.M. B and T Cells Driving Multiple Sclerosis: Identity, Mechanisms and Potential Triggers. Front. Immunol. 2020, 11, 760. [Google Scholar] [CrossRef]
- Larochelle, C.; Alvarez, J.I.; Prat, A. How Do Immune Cells Overcome the Blood-Brain Barrier in Multiple Sclerosis? FEBS Lett. 2011, 585, 3770–3780. [Google Scholar] [CrossRef] [Green Version]
- Lee, S.J.; Benveniste, E.N. Adhesion Molecule Expression and Regulation on Cells of the Central Nervous System. J. Neuroimmunol. 1999, 98, 77–88. [Google Scholar] [CrossRef]
- Dustin, M.L. The Immunological Synapse. Cancer Immunol. Res. 2014, 2, 1023–1033. [Google Scholar] [CrossRef] [Green Version]
- Jelcic, I.; al Nimer, F.; Wang, J.; Lentsch, V.; Planas, R.; Jelcic, I.; Madjovski, A.; Ruhrmann, S.; Faigle, W.; Frauenknecht, K.; et al. Memory B Cells Activate Brain-Homing, Autoreactive Cd4(+) T Cells in Multiple Sclerosis. Cell 2018, 175, 85–100.e23. [Google Scholar] [CrossRef] [Green Version]
- Ireland, S.J.; Guzman, A.A.; O’Brien, D.E.; Hughes, S.; Greenberg, B.; Flores, A.; Graves, D.; Remington, G.; Frohman, E.M.; Davis, L.S.; et al. The Effect of Glatiramer Acetate Therapy on Functional Properties of B Cells from Patients with Relapsing-Remitting Multiple Sclerosis. JAMA Neurol. 2014, 71, 1421–1428. [Google Scholar] [CrossRef] [PubMed]
- Grakoui, A.; Bromley, S.K.; Sumen, C.; Davis, M.M.; Shaw, A.S.; Allen, P.M.; Dustin, M.L. The Immunological Synapse: A Molecular Machine Controlling T Cell Activation. Science 1999, 285, 221–227. [Google Scholar] [CrossRef] [PubMed] [Green Version]
- James, T.; Linden, M.; Morikawa, H.; Fernandes, S.J.; Ruhrmann, S.; Huss, M.; Brandi, M.; Piehl, F.; Jagodic, M.; Tegner, J.; et al. Impact of Genetic Risk Loci for Multiple Sclerosis on Expression of Proximal Genes in Patients. Hum. Mol. Genet. 2018, 27, 912–928. [Google Scholar] [CrossRef] [PubMed] [Green Version]
- Chitnis, T.; Khoury, S.J. Role of Costimulatory Pathways in the Pathogenesis of Multiple Sclerosis and Experimental Autoimmune Encephalomyelitis. J. Allergy Clin. Immunol. 2003, 112, 837–849, quiz 50. [Google Scholar] [CrossRef]
- Frauwirth, K.A.; Thompson, C.B. Activation and Inhibition of Lymphocytes by Costimulation. J. Clin. Investig. 2002, 109, 295–299. [Google Scholar] [CrossRef] [PubMed]
- Sharief, M.K.; Noori, M.A.; Ciardi, M.; Cirelli, A.; Thompson, E.J. Increased Levels of Circulating Icam-1 in Serum and Cerebrospinal Fluid of Patients with Active Multiple Sclerosis. Correlation with Tnf-Alpha and Blood-Brain Barrier Damage. J. Neuroimmunol. 1993, 43, 15–21. [Google Scholar] [CrossRef]
- Gerritse, K.; Laman, J.D.; Noelle, R.J.; Aruffo, A.; Ledbetter, J.A.; Boersma, W.J.; Claassen, E. Cd40-Cd40 Ligand Interactions in Experimental Allergic Encephalomyelitis and Multiple Sclerosis. Proc. Natl. Acad. Sci. USA 1996, 93, 2499–2504. [Google Scholar] [CrossRef] [Green Version]
- International Multiple Sclerosis Genetics Consortium; Beecham, A.H.; Patsopoulos, N.A.; Xifara, D.K.; Davis, M.F.; Kemppinen, A.; Cotsapas, C.; Shah, T.S.; Spencer, C.; Booth, D.; et al. Analysis of Immune-Related Loci Identifies 48 New Susceptibility Variants for Multiple Sclerosis. Nat. Genet. 2013, 45, 1353–1360. [Google Scholar]
- Elovaara, I.; Ukkonen, M.; Leppakynnas, M.; Lehtimaki, T.; Luomala, M.; Peltola, J.; Dastidar, P. Adhesion Molecules in Multiple Sclerosis: Relation to Subtypes of Disease and Methylprednisolone Therapy. Arch. Neurol. 2000, 57, 546–551. [Google Scholar] [CrossRef] [PubMed] [Green Version]
- Kraus, J.; Engelhardt, B.; Chatzimanolis, N.; Bauer, R.; Tofighi, J.; Kuehne, B.S.; Laske, C.; Stolz, E.; Frielinghaus, P.; Schaefer, C.; et al. Cell Surface Bound and Soluble Adhesion Molecules in Csf and Blood in Multiple Sclerosis: Correlation with Mri-Measures of Subclinical Disease Severity and Activity. J. Neuroimmunol. 2002, 122, 175–185. [Google Scholar] [CrossRef]
- Kraus, J.; Oschmann, P.; Engelhardt, B.; Schiel, C.; Hornig, C.; Bauer, R.; Kern, A.; Traupe, H.; Dorndorf, W. Soluble and Cell Surface Icam-1 as Markers for Disease Activity in Multiple Sclerosis. Acta Neurol. Scand. 1998, 98, 102–109. [Google Scholar] [CrossRef]
- Schwab, N.; Schneider-Hohendorf, T.; Wiendl, H. Therapeutic Uses of Anti-Alpha4-Integrin (Anti-Vla-4) Antibodies in Multiple Sclerosis. Int. Immunol. 2015, 27, 47–53. [Google Scholar] [CrossRef] [PubMed] [Green Version]
- Archelos, J.J.; Jung, S.; Maurer, M.; Schmied, M.; Lassmann, H.; Tamatani, T.; Miyasaka, M.; Toyka, K.V.; Hartung, H.P. Inhibition of Experimental Autoimmune Encephalomyelitis by an Antibody to the Intercellular Adhesion Molecule Icam-1. Ann. Neurol. 1993, 34, 145–154. [Google Scholar] [CrossRef]
- Howard, L.M.; Miga, A.J.; Vanderlugt, C.L.; Canto, M.C.D.; Laman, J.D.; Noelle, R.J.; Miller, S.D. Mechanisms of Immunotherapeutic Intervention by Anti-Cd40l (Cd154) Antibody in an Animal Model of Multiple Sclerosis. J. Clin. Investig. 1999, 103, 281–290. [Google Scholar] [CrossRef]
- Miller, S.D.; Vanderlugt, C.L.; Lenschow, D.J.; Pope, J.G.; Karandikar, N.J.; Canto, M.C.D.; Bluestone, J.A. Blockade of Cd28/B7-1 Interaction Prevents Epitope Spreading and Clinical Relapses of Murine Eae. Immunity 1995, 3, 739–745. [Google Scholar] [CrossRef] [Green Version]
- Perrin, P.J.; June, C.H.; Maldonado, J.H.; Ratts, R.B.; Racke, M.K. Blockade of Cd28 During in Vitro Activation of Encephalitogenic T Cells or after Disease Onset Ameliorates Experimental Autoimmune Encephalomyelitis. J. Immunol. 1999, 163, 1704–1710. [Google Scholar] [PubMed]
- Theien, B.E.; Vanderlugt, C.L.; Eagar, T.N.; Nickerson-Nutter, C.; Nazareno, R.; Kuchroo, V.K.; Miller, S.D. Discordant Effects of Anti-Vla-4 Treatment before and after Onset of Relapsing Experimental Autoimmune Encephalomyelitis. J. Clin. Investig. 2001, 107, 995–1006. [Google Scholar] [CrossRef] [PubMed] [Green Version]
- Oliveira-dos-Santos, A.J.; Ho, A.; Tada, Y.; Lafaille, J.J.; Tonegawa, S.; Mak, T.W.; Penninger, J.M. Cd28 Costimulation Is Crucial for the Development of Spontaneous Autoimmune Encephalomyelitis. J. Immunol. 1999, 162, 4490–4495. [Google Scholar] [PubMed]
- Yednock, T.A.; Cannon, C.; Fritz, L.C.; Sanchez-Madrid, F.; Steinman, L.; Karin, N. Prevention of Experimental Autoimmune Encephalomyelitis by Antibodies against Alpha 4 Beta 1 Integrin. Nature 1992, 356, 63–66. [Google Scholar] [CrossRef]
- Brocke, S.; Piercy, C.; Steinman, L.; Weissman, I.L.; Veromaa, T. Antibodies to Cd44 and Integrin Alpha4, but Not L-Selectin, Prevent Central Nervous System Inflammation and Experimental Encephalomyelitis by Blocking Secondary Leukocyte Recruitment. Proc. Natl. Acad. Sci. USA 1999, 96, 6896–6901. [Google Scholar] [CrossRef] [PubMed] [Green Version]
- Sellner, J.; Koczi, W.; Harrer, A.; Oppermann, K.; Obregon-Castrillo, E.; Pilz, G.; Wipfler, P.; Afazel, S.; Haschke-Becher, E.; Trinka, E.; et al. Glatiramer Acetate Attenuates the Pro-Migratory Profile of Adhesion Molecules on Various Immune Cell Subsets in Multiple Sclerosis. Clin. Exp. Immunol. 2013, 173, 381–389. [Google Scholar] [CrossRef] [PubMed]
- Diebold, M.; Sievers, C.; Bantug, G.; Sanderson, N.; Kappos, L.; Kuhle, J.; Lindberg, R.L.P.; Derfuss, T. Dimethyl Fumarate Influences Innate and Adaptive Immunity in Multiple Sclerosis. J. Autoimmun. 2018, 86, 39–50. [Google Scholar] [CrossRef]
- Montes Diaz, G.; Fraussen, J.; van Wijmeersch, B.; Hupperts, R.; Somers, V. Dimethyl Fumarate Induces a Persistent Change in the Composition of the Innate and Adaptive Immune System in Multiple Sclerosis Patients. Sci. Rep. 2018, 8, 8194. [Google Scholar] [CrossRef]
- Sellner, J.; Rommer, P.S. Immunological Consequences of Immune Reconstitution Therapy in Multiple Sclerosis: A Systematic Review. Autoimmun. Rev. 2020, 19, 102492. [Google Scholar] [CrossRef]
- Moser, T.; Schwenker, K.; Seiberl, M.; Feige, J.; Akgun, K.; Haschke-Becher, E.; Ziemssen, T.; Sellner, J. Long-Term Peripheral Immune Cell Profiling Reveals Further Targets of Oral Cladribine in Ms. Ann. Clin. Transl. Neurol. 2020, 7, 2199–2212. [Google Scholar] [CrossRef]
- Ceronie, B.; Jacobs, B.M.; Baker, D.; Dubuisson, N.; Mao, Z.; Ammoscato, F.; Lock, H.; Longhurst, H.J.; Giovannoni, G.; Schmierer, K. Cladribine Treatment of Multiple Sclerosis Is Associated with Depletion of Memory B Cells. J. Neurol. 2018, 265, 1199–1209. [Google Scholar] [CrossRef] [PubMed] [Green Version]
- Comi, G.; Cook, S.; Giovannoni, G.; Rieckmann, P.; Sorensen, P.S.; Vermersch, P.; Galazka, A.; Nolting, A.; Hicking, C.; Dangond, F. Effect of Cladribine Tablets on Lymphocyte Reduction and Repopulation Dynamics in Patients with Relapsing Multiple Sclerosis. Mult. Scler. Relat. Disord. 2019, 29, 168–174. [Google Scholar] [CrossRef] [Green Version]
- Stuve, O.; Soerensen, P.S.; Leist, T.; Giovannoni, G.; Hyvert, Y.; Damian, D.; Dangond, F.; Boschert, U. Effects of Cladribine Tablets on Lymphocyte Subsets in Patients with Multiple Sclerosis: An Extended Analysis of Surface Markers. Ther. Adv. Neurol. Disord. 2019, 12, 1756286419854986. [Google Scholar] [CrossRef] [PubMed] [Green Version]
- Kopadze, T.; Dobert, M.; Leussink, V.I.; Dehmel, T.; Kieseier, B.C. Cladribine Impedes in Vitro Migration of Mononuclear Cells: A Possible Implication for Treating Multiple Sclerosis. Eur. J. Neurol. 2009, 16, 409–412. [Google Scholar] [CrossRef]
- Mitosek-Szewczyk, K.; Stelmasiak, Z.; Bartosik-Psujek, H.; Belniak, E. Impact of Cladribine on Soluble Adhesion Molecules in Multiple Sclerosis. Acta Neurol. Scand. 2010, 122, 409–413. [Google Scholar] [CrossRef]
- European Medicines Agency. Mavenclad® European Public Assessment Report—Summary for the Public. 9 September 2017. Available online: https://www.Ema.Europa.Eu/En/Documents/Overview/Mavenclad-Epar-Summary-Public_En.Pdf (accessed on 19 March 2020).
- Akgün, K.; Blankenburg, J.; Marggraf, M.; Haase, R.; Ziemssen, T. Event-Driven Immunoprofiling Predicts Return of Disease Activity in Alemtuzumab-Treated Multiple Sclerosis. Front. Immunol. 2020, 11, 56. [Google Scholar] [CrossRef] [PubMed] [Green Version]
- Sehr, T.; Proschmann, U.; Thomas, K.; Marggraf, M.; Straube, E.; Reichmann, H.; Chan, A.; Ziemssen, T. New Insights into the Pharmacokinetics and Pharmacodynamics of Natalizumab Treatment for Patients with Multiple Sclerosis, Obtained from Clinical and in Vitro Studies. J. Neuroinflamm. 2016, 13, 164. [Google Scholar] [CrossRef] [Green Version]
- Fooksman, D.R.; Vardhana, S.; Vasiliver-Shamis, G.; Liese, J.; Blair, D.A.; Waite, J.; Sacristan, C.; Victora, G.D.; Zanin-Zhorov, A.; Dustin, M.L. Functional Anatomy of T Cell Activation and Synapse Formation. Annu. Rev. Immunol. 2010, 28, 79–105. [Google Scholar] [CrossRef] [PubMed] [Green Version]
- Walling, B.L.; Kim, M. Lfa-1 in T Cell Migration and Differentiation. Front. Immunol. 2018, 9, 952. [Google Scholar] [CrossRef] [Green Version]
- Kosmaczewska, A.; Bilinska, M.; Ciszak, L.; Noga, L.; Pawlak, E.; Szteblich, A.; Podemski, R.; Frydecka, I. Different Patterns of Activation Markers Expression and Cd4+ T-Cell Responses to Ex Vivo Stimulation in Patients with Clinically Quiescent Multiple Sclerosis (Ms). J. Neuroimmunol. 2007, 189, 137–146. [Google Scholar] [CrossRef] [PubMed]
- Teleshova, N.; Bao, W.; Kivisakk, P.; Ozenci, V.; Mustafa, M.; Link, H. Elevated Cd40 Ligand Expressing Blood T-Cell Levels in Multiple Sclerosis Are Reversed by Interferon-Beta Treatment. Scand. J. Immunol. 2000, 51, 312–320. [Google Scholar] [CrossRef]
- Foster, C.A.; Mechtcheriakova, D.; Storch, M.K.; Balatoni, B.; Howard, L.M.; Bornancin, F.; Wlachos, A.; Sobanov, J.; Kinnunen, A.; Baumruker, T. Fty720 Rescue Therapy in the Dark Agouti Rat Model of Experimental Autoimmune Encephalomyelitis: Expression of Central Nervous System Genes and Reversal of Blood-Brain-Barrier Damage. Brain Pathol. 2009, 19, 254–266. [Google Scholar] [CrossRef] [PubMed]
- Schneider-Hohendorf, T.; Rossaint, J.; Mohan, H.; Boning, D.; Breuer, J.; Kuhlmann, T.; Gross, C.C.; Flanagan, K.; Sorokin, L.; Vestweber, D.; et al. Vla-4 Blockade Promotes Differential Routes into Human Cns Involving Psgl-1 Rolling of T Cells and Mcam-Adhesion of Th17 Cells. J. Exp. Med. 2014, 211, 1833–1846. [Google Scholar] [CrossRef] [PubMed]
- Schumann, J.; Stanko, K.; Schliesser, U.; Appelt, C.; Sawitzki, B. Differences in Cd44 Surface Expression Levels and Function Discriminates Il-17 and Ifn-Gamma Producing Helper T Cells. PLoS ONE 2015, 10, e0132479. [Google Scholar]
- Back, S.A.; Tuohy, T.M.; Chen, H.; Wallingford, N.; Craig, A.; Struve, J.; Luo, N.L.; Banine, F.; Liu, Y.; Chang, A.; et al. Sherman. Hyaluronan Accumulates in Demyelinated Lesions and Inhibits Oligodendrocyte Progenitor Maturation. Nat. Med. 2005, 11, 966–972. [Google Scholar] [CrossRef] [PubMed]
- Guan, H.; Nagarkatti, P.S.; Nagarkatti, M. Cd44 Reciprocally Regulates the Differentiation of Encephalitogenic Th1/Th17 and Th2/Regulatory T Cells through Epigenetic Modulation Involving DNA Methylation of Cytokine Gene Promoters, Thereby Controlling the Development of Experimental Autoimmune Encephalomyelitis. J. Immunol. 2011, 186, 6955–6964. [Google Scholar]
- Hegde, V.L.; Singh, N.P.; Nagarkatti, P.S.; Nagarkatti, M. Cd44 Mobilization in Allogeneic Dendritic Cell-T Cell Immunological Synapse Plays a Key Role in T Cell Activation. J. Leukoc. Biol. 2008, 84, 134–142. [Google Scholar] [CrossRef] [Green Version]
- Van Langelaar, J.; van der Vuurst de Vries, R.M.; Janssen, M.; Wierenga-Wolf, A.F.; Spilt, I.M.; Siepman, T.A.; Dankers, W.; Verjans, G.; de Vries, H.E.; Lubberts, E.; et al. T Helper 17.1 Cells Associate with Multiple Sclerosis Disease Activity: Perspectives for Early Intervention. Brain 2018, 141, 1334–1349. [Google Scholar] [CrossRef]
- Moser, T.; Akgun, K.; Proschmann, U.; Sellner, J.; Ziemssen, T. The Role of Th17 Cells in Multiple Sclerosis: Therapeutic Implications. Autoimmun. Rev. 2020, 19, 102647. [Google Scholar] [CrossRef] [PubMed]
- Jack, D.; Nolting, A.; Galazka, A. Favorable Outcomes after Covid-19 Infection in Multiple Sclerosis Patients Treated with Cladribine Tablets. Mult. Scler. Relat. Disord. 2020, 46, 102469. [Google Scholar] [CrossRef]
- Cook, S.; Leist, T.; Comi, G.; Montalban, X.; Giovannoni, G.; Nolting, A.; Hicking, C.; Galazka, A.; Sylvester, E. Safety of Cladribine Tablets in the Treatment of Patients with Multiple Sclerosis: An Integrated Analysis. Mult. Scler. Relat. Disord. 2019, 29, 157–167. [Google Scholar] [CrossRef] [PubMed] [Green Version]
- Grewal, I.S.; Flavell, R.A. Cd40 and Cd154 in Cell-Mediated Immunity. Annu. Rev. Immunol. 1998, 16, 111–135. [Google Scholar] [CrossRef] [PubMed]
- Girvin, A.M.; Canto, M.C.D.; Miller, S.D. Cd40/Cd40l Interaction Is Essential for the Induction of Eae in the Absence of Cd28-Mediated Co-Stimulation. J. Autoimmun. 2002, 18, 83–94. [Google Scholar] [CrossRef]
- Vaitaitis, G.M.; Yussman, M.G.; Waid, D.M.; Wagner, D.H., Jr. Th40 Cells (Cd4+Cd40+ Tcells) Drive a More Severe Form of Experimental Autoimmune Encephalomyelitis Than Conventional Cd4 T Cells. PLoS ONE 2017, 12, e0172037. [Google Scholar] [CrossRef]
- Vaitaitis, G.M.; Yussman, M.G.; Wagner, D.H., Jr. A Cd40 Targeting Peptide Prevents Severe Symptoms in Experimental Autoimmune Encephalomyelitis. J. Neuroimmunol. 2019, 332, 8–15. [Google Scholar] [CrossRef] [PubMed]
- Hong, G.U.; Kim, N.G.; Jeoung, D.; Ro, J.Y. Anti-Cd40 Ab- or 8-Oxo-Dg-Enhanced Treg Cells Reduce Development of Experimental Autoimmune Encephalomyelitis Via Down-Regulating Migration and Activation of Mast Cells. J. Neuroimmunol. 2013, 260, 60–73. [Google Scholar] [CrossRef]
- Toubi, E.; Shoenfeld, Y. The Role of Cd40-Cd154 Interactions in Autoimmunity and the Benefit of Disrupting This Pathway. Autoimmunity 2004, 37, 457–464. [Google Scholar] [CrossRef] [PubMed]
- Waid, D.M.; Vaitaitis, G.M.; Wagner, D.H., Jr. Peripheral Cd4locd40+ Auto-Aggressive T Cell Expansion During Insulin-Dependent Diabetes Mellitus. Eur. J. Immunol. 2004, 34, 1488–1497. [Google Scholar] [CrossRef] [PubMed]


| pwMS n = 18 | HCs n = 10 | |
|---|---|---|
| Sex, F/M | 15/3 | 7/3 |
| Age, mean years ± SD (range) | 37.4 ± 11.7 (20–57) | 37.0 ± 12.9 (25–60) |
| EDSS BL, mean ± SD | 2.22 ± 1.7 | - |
| EDSS EOS, mean ± SD | 2.08 ± 2.0 | - |
| MS duration, mean years (range) | 8.8 (0–25) | - |
| Lymphocyte subsets at BL: | ||
| % of CD4+ cells among lymphocytes (±SD) | 44.2 (13.7) | 41.1 (11.2) |
| % of CD8+ cells among lymphocytes (±SD) | 24.3 (9.2) | 23.8 (7.2) |
| % of C19+ cells among lymphocytes (±SD) | 12.1 (6.8) | 14.3 (5.9) |
Publisher’s Note: MDPI stays neutral with regard to jurisdictional claims in published maps and institutional affiliations. |
© 2021 by the authors. Licensee MDPI, Basel, Switzerland. This article is an open access article distributed under the terms and conditions of the Creative Commons Attribution (CC BY) license (https://creativecommons.org/licenses/by/4.0/).
Share and Cite
Moser, T.; Hoepner, L.; Schwenker, K.; Seiberl, M.; Feige, J.; Akgün, K.; Haschke-Becher, E.; Ziemssen, T.; Sellner, J. Cladribine Alters Immune Cell Surface Molecules for Adhesion and Costimulation: Further Insights to the Mode of Action in Multiple Sclerosis. Cells 2021, 10, 3116. https://doi.org/10.3390/cells10113116
Moser T, Hoepner L, Schwenker K, Seiberl M, Feige J, Akgün K, Haschke-Becher E, Ziemssen T, Sellner J. Cladribine Alters Immune Cell Surface Molecules for Adhesion and Costimulation: Further Insights to the Mode of Action in Multiple Sclerosis. Cells. 2021; 10(11):3116. https://doi.org/10.3390/cells10113116
Chicago/Turabian StyleMoser, Tobias, Lena Hoepner, Kerstin Schwenker, Michael Seiberl, Julia Feige, Katja Akgün, Elisabeth Haschke-Becher, Tjalf Ziemssen, and Johann Sellner. 2021. "Cladribine Alters Immune Cell Surface Molecules for Adhesion and Costimulation: Further Insights to the Mode of Action in Multiple Sclerosis" Cells 10, no. 11: 3116. https://doi.org/10.3390/cells10113116