
Advances in the Noninvasive Diagnosis of Dry Eye Disease

 , , ,
, , ,
Abstract
:1. Introduction
2. Noninvasive Tear Break-Up Time
3. Light Scatter
4. Aberrometer
5. Anterior Segment Optical Coherence Tomography
6. In Vivo Confocal Microscopy
7. Meibography
8. Interferometry
9. Thermography
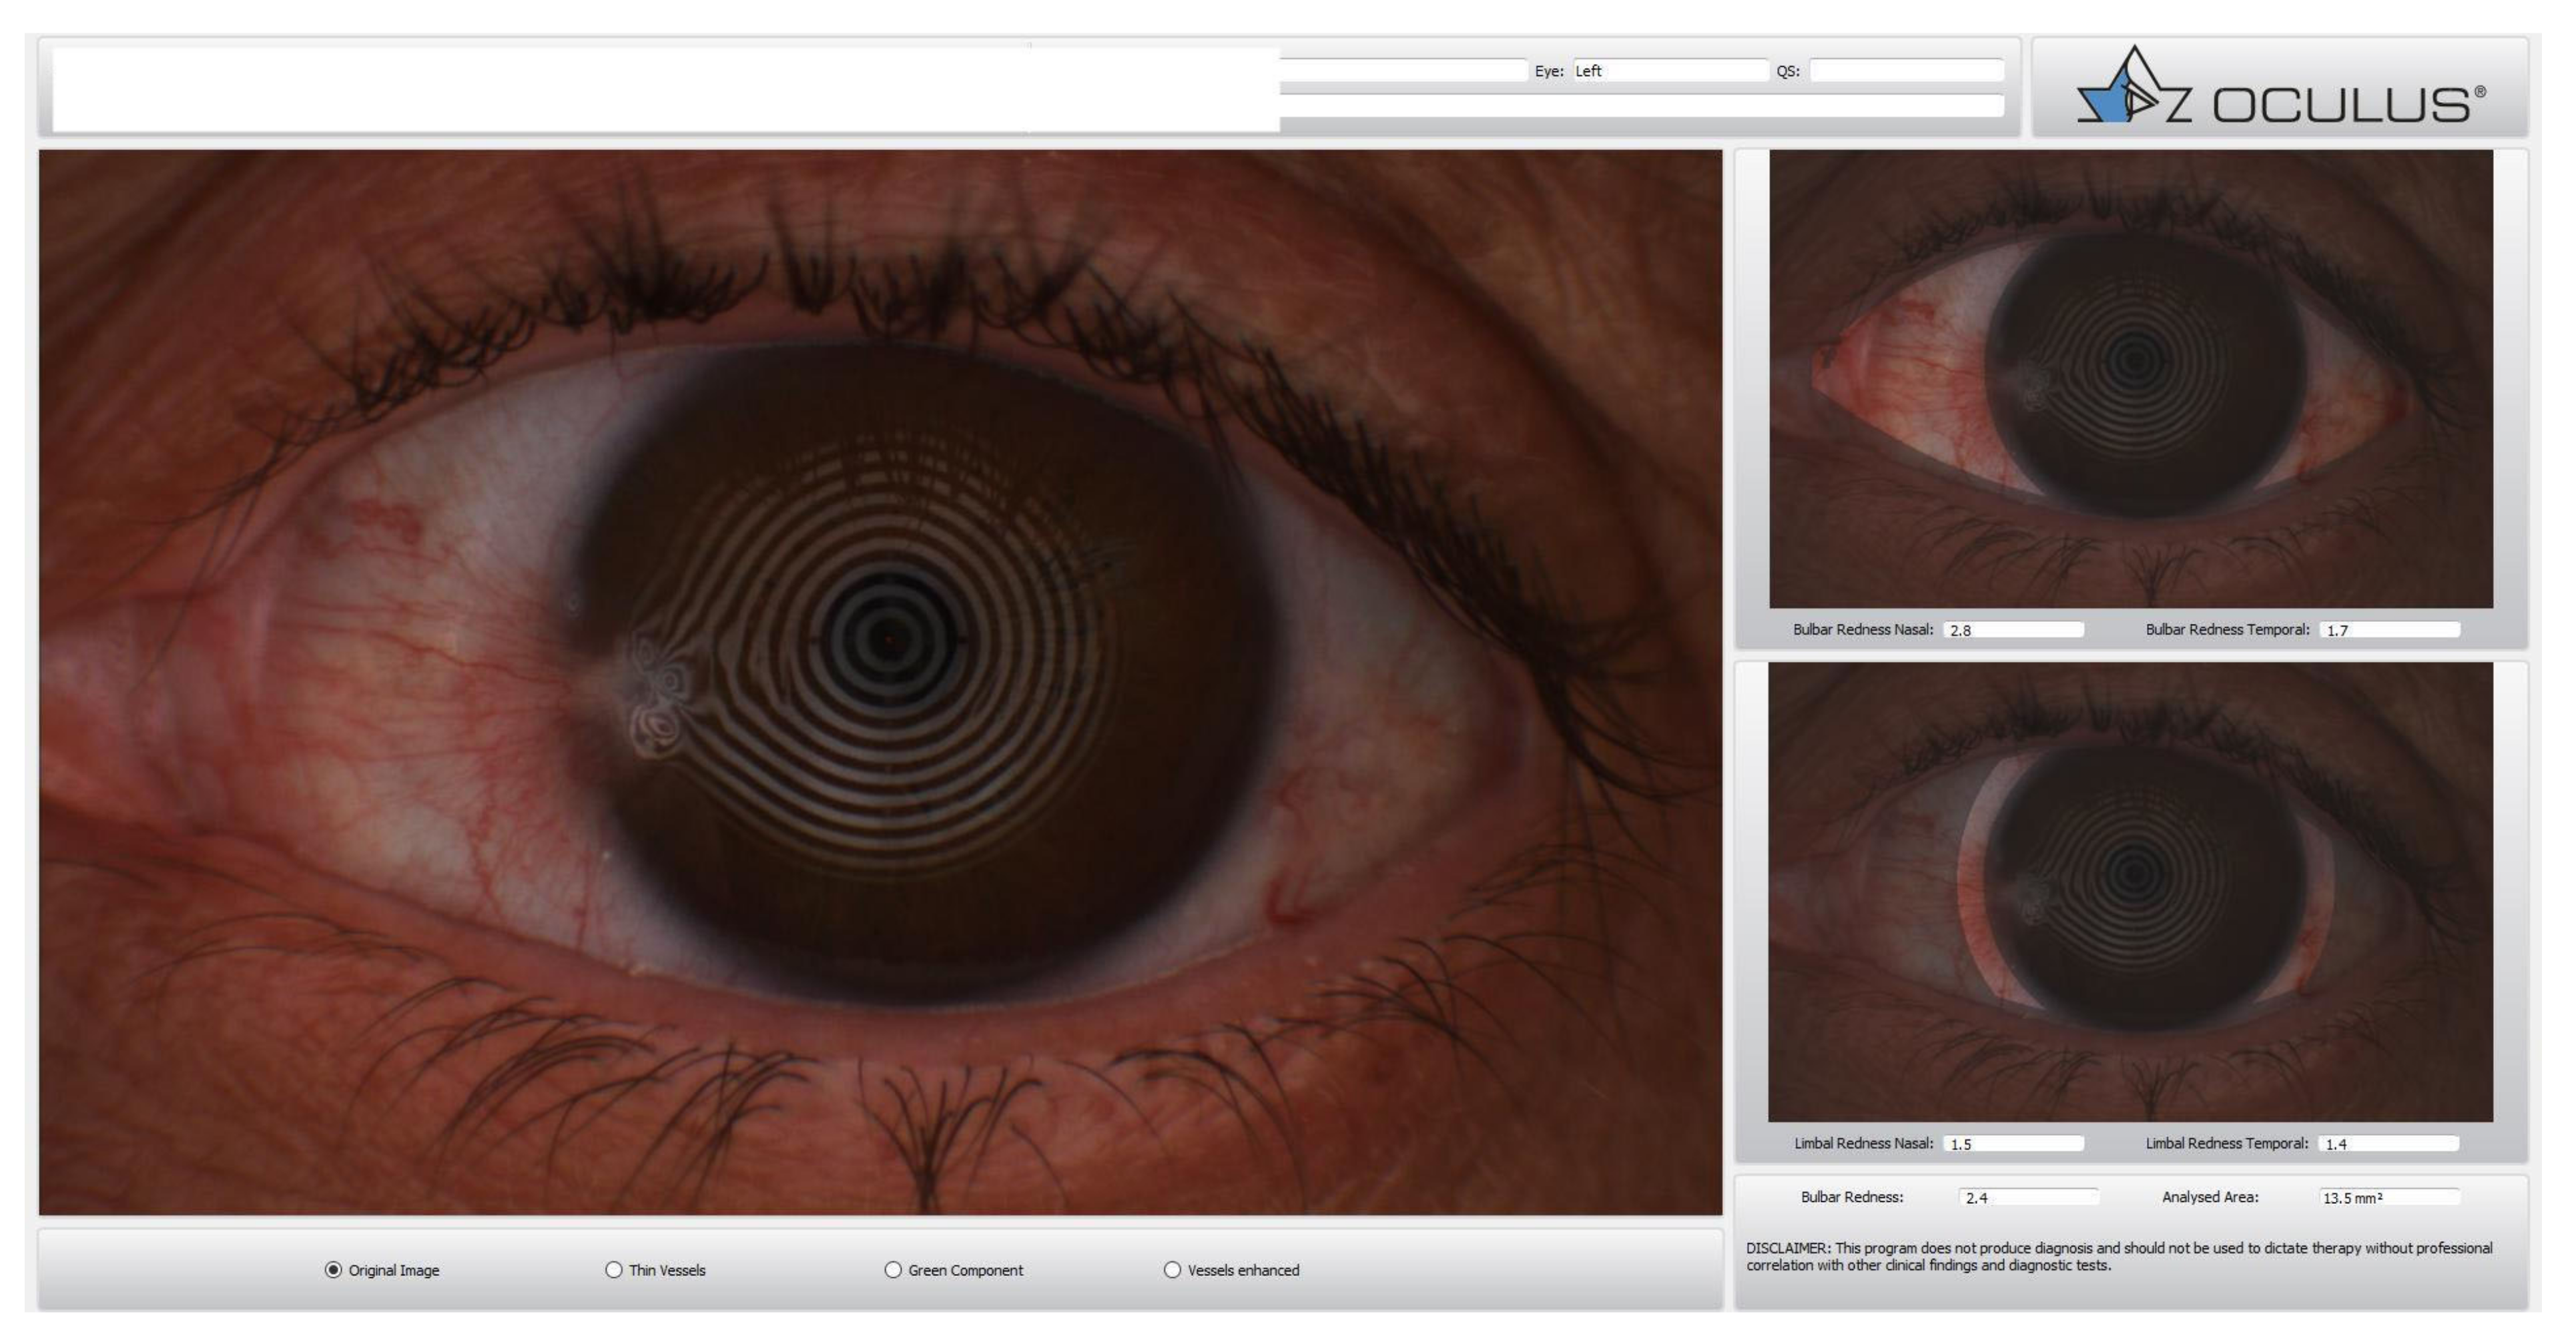
10. Bulbar Redness Assessment
11. Image Modality Based Computerized Detection Techniques
12. Pros and Cons of Noninvasive DED Imaging
13. Conclusions
Author Contributions
Funding
Institutional Review Board Statement
Informed Consent Statement
Conflicts of Interest
References
- Lemp, M.A.; Foulks, G.N. The Epidemiology of Dry Eye Disease: Report of the Epidemiology Subcommittee of the International Dry Eye WorkShop (2007). Ocul. Surf. 2007, 5, 93–107. [Google Scholar] [CrossRef]
- Stapleton, F.; Alves, M.; Bunya, V.Y.; Jalbert, I.; Lekhanont, K.; Malet, F.; Na, K.-S.; Schaumberg, D.; Uchino, M.; Vehof, F.; et al. TFOS DEWS II Epidemiology Report. Ocul. Surf. 2017, 15, 334–365. [Google Scholar] [CrossRef]
- McDonald, M.; Patel, D.A.; Keith, M.S.; Snedecor, S.J. Economic and Humanistic Burden of Dry Eye Disease in Europe, North America, and Asia: A Systematic Literature Review. Ocul. Surf. 2016, 14, 144–167. [Google Scholar] [CrossRef] [PubMed] [Green Version]
- Wolffsohn, J.S.; Arita, R.; Chalmers, R.; Djalilian, A.; Dogru, M.; Dumbleton, K.; Gupta, P.K.; Karpecki, P.; Lazreg, S.; Pult, H.; et al. TFOS DEWS II Diagnostic Methodology report. Ocul. Surf. 2017, 15, 539–574. [Google Scholar] [CrossRef] [PubMed]
- Schmidl, D.; Schlatter, A.; Chua, J.; Tan, B.; Garhöfer, G.; Schmetterer, L. Novel Approaches for Imaging-Based Diagnosis of Ocular Surface Disease. Diagnostics 2020, 10, 589. [Google Scholar] [CrossRef]
- Vigo, L.; Pellegrini, M.; Bernabei, F.; Carones, F.; Scorcia, V.; Giannaccare, G. Diagnostic Performance of a Novel Noninvasive Workup in the Setting of Dry Eye Disease. J. Ophthalmol. 2020, 2020, 5804123. [Google Scholar] [CrossRef]
- Aragona, P.; Giannaccare, G.; Mencucci, R.; Rubino, P.; Cantera, E.; Rolando, M. Modern approach to the treatment of dry eye, a complex multifactorial disease: A P.I.C.A.S.S.O. board review. Br. J. Ophthalmol. 2021, 105, 446–453. [Google Scholar] [CrossRef]
- Willcox, M.D.P.; Argüeso, P.; Georgiev, G.A.; Holopainen, J.M.; Laurie, G.W.; Millar, T.J.; Papas, E.B.; Rolland, J.P.; Schmidt, T.A.; Stahl, U.; et al. TFOS DEWS II Tear Film Report. Ocul. Surf. 2017, 15, 366–403. [Google Scholar] [CrossRef] [Green Version]
- Herbaut, A.; Liang, H.; Denoyer, A.; Baudouin, C.; Labbé, A. Tear film analysis and evaluation of optical quality: A review of the literature. J. Fr. Ophtalmol. 2019, 42, 226–243. [Google Scholar] [CrossRef]
- Giannaccare, G.; Scorcia, V. False Myths versus Medical Facts: Ten Common Misconceptions Related to Dry Eye Disease. Biomedicines 2020, 8, 172. [Google Scholar] [CrossRef]
- Bandlitz, S.; Peter, B.; Pflugi, T.; Jaeger, K.; Anwar, A.; Bikhu, P.; Nosch, D.S.; Wolffsohn, J.S. Agreement and repeatability of four different devices to measure non-invasive tear breakup time (NIBUT). Contact Lens Anterior Eye 2020, 43, 507–511. [Google Scholar] [CrossRef]
- Yeo, S.; Lee, R.; Aung, H.T.; Tong, L. Agreement of non-invasive tear break up time measurement between Tomey RT-7000 Auto Refractor-Keratometer and Oculus Keratograph 5M. Clin. Ophthalmol. 2016, 10, 1785–1790. [Google Scholar] [CrossRef] [PubMed] [Green Version]
- Fuller, D.G.; Potts, K.; Kim, J. Noninvasive Tear Breakup Times and Ocular Surface Disease. Optom. Vis. Sci. 2013, 90, 1086–1091. [Google Scholar] [CrossRef]
- Hong, J.; Sun, X.; Wei, A.; Cui, X.; Li, Y.; Qian, T.; Wang, W.; Xu, J. Assessment of Tear Film Stability in Dry Eye With a Newly Developed Keratograph. Cornea 2013, 32, 716–721. [Google Scholar] [CrossRef] [PubMed]
- Goto, E.; Yagi, Y.; Matsumoto, Y.; Tsubota, K. Impaired functional visual acuity of dry eye patients. Am. J. Ophthalmol. 2002, 133, 181–186. [Google Scholar] [CrossRef]
- Koh, S.; Maeda, N.; Ikeda, C.; Asonuma, S.; Mitamura, H.; Oie, Y.; Soma, T.; Tsujikawa, M.; Kawasaki, S.; Nishida, K. Ocular Forward Light Scattering and Corneal Backward Light Scattering in Patients with Dry Eye. Investig. Opthalmol. Vis. Sci. 2014, 55, 6601–6606. [Google Scholar] [CrossRef] [PubMed] [Green Version]
- Galliot, F.; Patel, S.R.; Cochener, B. Objective Scatter Index: Working Toward a New Quantification of Cataract? J. Refract. Surg. 2016, 32, 96–102. [Google Scholar] [CrossRef] [Green Version]
- Tan, C.; Labbé, A.; Liang, Q.; Qiao, L.; Baudouin, C.; Wan, X.; Wang, N. Dynamic Change of Optical Quality in Patients With Dry Eye Disease. Investig. Opthalmol. Vis. Sci. 2015, 56, 2848–2854. [Google Scholar] [CrossRef] [Green Version]
- Ye, F.; Jiang, F.; Lu, Y.; Xue, C.Y.; Zhu, X.M.; Wu, Y.; Huang, Z.P. Objective optical assessment of tear-film quality dynamics in patients with meibomian gland dysfunction and aqueous-deficient dry eye optical quality changes in different dry eye subtypes. Indian J. Ophthalmol. 2019, 67, 599–603. [Google Scholar] [CrossRef]
- Maeda, N. Clinical applications of wavefront aberrometry - a review. Clin. Exp. Ophthalmol. 2009, 37, 118–129. [Google Scholar] [CrossRef]
- Koh, S.; Maeda, N.; Kuroda, T.; Hori, Y.; Watanabe, H.; Fujikado, T.; Tano, Y.; Hirohara, Y.; Mihashi, T. Effect of tear film break-up on higher-order aberrations measured with wavefront sensor. Am. J. Ophthalmol. 2002, 134, 115–117. [Google Scholar] [CrossRef]
- Koh, S. Serial Measurements of Higher-Order Aberrations after Blinking in Normal Subjects. Investig. Opthalmol. Vis. Sci. 2006, 47, 3318–3324. [Google Scholar] [CrossRef] [Green Version]
- Denoyer, A.; Rabut, G.; Baudouin, C. Tear Film Aberration Dynamics and Vision-Related Quality of Life in Patients with Dry Eye Disease. Ophthalmology 2012, 119, 1811–1818. [Google Scholar] [CrossRef] [PubMed]
- Koh, S.; Maeda, N.; Hirohara, Y.; Mihashi, T.; Bessho, K.; Hori, Y.; Inoue, T.; Watanabe, H.; Fujikado, T.; Tano, Y. Serial Measurements of Higher-Order Aberrations after Blinking in Patients with Dry Eye. Investig. Opthalmol. Vis. Sci. 2008, 49, 133–138. [Google Scholar] [CrossRef] [Green Version]
- Koh, S.; Maeda, N.; Hori, Y.; Inoue, T.; Watanabe, H.; Hirohara, Y.; Mihashi, T.; Fujikado, T.; Tano, Y. Effects of Suppression of Blinking on Quality of Vision in Borderline Cases of Evaporative Dry Eye. Cornea 2008, 27, 275–278. [Google Scholar] [CrossRef] [PubMed]
- Deschamps, N.; Ricaud, X.; Rabut, G.; Labbé, A.; Baudouin, C.; Denoyer, A. The Impact of Dry Eye Disease on Visual Performance While Driving. Am. J. Ophthalmol. 2013, 156, 184–189.e3. [Google Scholar] [CrossRef] [PubMed]
- Lekhanont, K.; Chuckpaiwong, V.; Vongthongsri, A.; Sangiampornpanit, T. Effects of Sodium Hyaluronate on Wavefront Aberrations in Dry Eye Patients. Optom. Vis. Sci. 2014, 91, 39–46. [Google Scholar] [CrossRef]
- Koh, S.; Inoue, Y.; Sugmimoto, T.; Maeda, N.; Nishida, K. Effect of Rebamipide Ophthalmic Suspension on Optical Quality in the Short Break-up Time Type of Dry Eye. Cornea 2013, 32, 1219–1223. [Google Scholar] [CrossRef] [PubMed]
- Huang, D.; Swanson, E.A.; Lin, C.P.; Schuman, J.S.; Stinson, W.G.; Chang, W.; Hee, M.R.; Flotte, T.; Gregory, K.; Puliafito, C.A.; et al. Optical Coherence Tomography. Science 1991, 254, 1178–1181. [Google Scholar] [CrossRef] [Green Version]
- Pellegrini, M.; Vagge, A.; Desideri, L.F.F.; Bernabei, F.; Triolo, G.; Mastropasqua, R.; Del Del Noce, C.; Borrelli, E.; Sacconi, R.; Iovino, C.; et al. Optical Coherence Tomography Angiography in Neurodegenerative Disorders. J. Clin. Med. 2020, 9, 1706. [Google Scholar] [CrossRef]
- Ang, M.; Baskaran, M.; Werkmeister, R.M.; Chua, J.; Schmidl, D.; dos Santos, V.A.; Garhöfer, G.; Mehta, J.S.; Schmetterer, L. Anterior segment optical coherence tomography. Prog. Retin. Eye Res. 2018, 66, 132–156. [Google Scholar] [CrossRef]
- Cui, L.; Wang, J.; Perez, V.L.; Shen, M.; Yuan, Y.; Wang, M.R. Visualization of the Precorneal Tear Film Using Ultrahigh Resolution Optical Coherence Tomography in Dry Eye. Eye Contact Lens Sci. Clin. Pract. 2012, 38, 240–244. [Google Scholar] [CrossRef] [Green Version]
- Ramos, J.L.B.; Li, Y.; Huang, D. Clinical and research applications of anterior segment optical coherence tomography-a review. Clin. Exp. Ophthalmol. 2009, 37, 81–89. [Google Scholar] [CrossRef] [Green Version]
- Schmidl, D.; Witkowska, K.J.; Kaya, S.; Baar, C.; Faatz, H.; Nepp, J.; Unterhuber, A.; Werkmeister, R.M.; Garhofer, G.; Schmetterer, L. The Association between Subjective and Objective Parameters for the Assessment of Dry-Eye Syndrome. Investig. Ophthalmol. Vis. Sci. 2015, 56, 1467–1472. [Google Scholar] [CrossRef] [Green Version]
- Kallab, M.; Szegedi, S.; Hommer, N.; Stegmann, H.; Kaya, S.; Werkmeister, R.M.; Schmidl, D.; Schmetterer, L.; Garhöfer, G. Topical Low Dose Preservative-Free Hydrocortisone Reduces Signs and Symptoms in Patients with Chronic Dry Eye: A Randomized Clinical Trial. Adv. Ther. 2020, 37, 329–341. [Google Scholar] [CrossRef] [PubMed] [Green Version]
- Schmidl, D.; Bata, A.M.; Szegedi, S.; Dos Santos, V.A.; Stegmann, H.; Fondi, K.; Krösser, S.; Werkmeister, R.M.; Schmetterer, L.; Garhöfer, G. Influence of Perfluorohexyloctane Eye Drops on Tear Film Thickness in Patients with Mild to Moderate Dry Eye Disease: A Randomized Controlled Clinical Trial. J. Ocul. Pharmacol. Ther. 2020, 36, 154–161. [Google Scholar] [CrossRef]
- Binotti, W.W.; Bayraktutar, B.; Ozmen, M.C.; Cox, S.M.; Hamrah, P. A Review of Imaging Biomarkers of the Ocular Surface. Eye Contact Lens Sci. Clin. Pract. 2020, 46, S84–S105. [Google Scholar] [CrossRef] [PubMed]
- Hwang, H.S.; Shin, J.G.; Lee, B.H.; Eom, T.J.; Joo, C.-K. In Vivo 3D Meibography of the Human Eyelid Using Real Time Imaging Fourier-Domain OCT. PLoS ONE 2013, 8, e67143. [Google Scholar] [CrossRef] [PubMed] [Green Version]
- Liang, Q.; Pan, Z.; Zhou, M.; Zhang, Y.; Wang, N.; Li, B.; Baudouin, C.; Labbé, A. Evaluation of Optical Coherence Tomography Meibography in Patients With Obstructive Meibomian Gland Dysfunction. Cornea 2015, 34, 1193–1199. [Google Scholar] [CrossRef]
- Wang, Y.E.; Tepelus, T.C.; Vickers, L.A.; Baghdasaryan, E.; Gui, W.; Huang, P.; Irvine, J.A.; Sadda, S.; Hsu, H.Y.; Lee, O.L. Role of in vivo confocal microscopy in the diagnosis of infectious keratitis. Int. Ophthalmol. 2019, 39, 2865–2874. [Google Scholar] [CrossRef]
- Niederer, R.; McGhee, C. Clinical in vivo confocal microscopy of the human cornea in health and disease. Prog. Retin. Eye Res. 2010, 29, 30–58. [Google Scholar] [CrossRef]
- Giannaccare, G.; Pellegrini, M.; Sebastiani, S.; Moscardelli, F.; Versura, P.; Campos, E.C. In vivo confocal microscopy morphometric analysis of corneal subbasal nerve plexus in dry eye disease using newly developed fully automated system. Graefe’s Arch. Clin. Exp. Ophthalmol. 2019, 257, 583–589. [Google Scholar] [CrossRef]
- Villani, E.; Galimberti, D.; Viola, F.; Mapelli, C.; Ratiglia, R. The Cornea in Sjögren’s Syndrome: An In Vivo Confocal Study. Investig. Opthalmol. Vis. Sci. 2007, 48, 2017–2022. [Google Scholar] [CrossRef] [PubMed]
- Tuominen, I.S.J.; Konttinen, Y.T.; Vesaluoma, M.H.; Moilanen, J.A.O.; Helinto, M.; Tervo, T.M.T. Corneal Innervation and Morphology in Primary Sjögren’s Syndrome. Investig. Opthalmol. Vis. Sci. 2003, 44, 2545–2549. [Google Scholar] [CrossRef] [Green Version]
- Del Castillo, J.M.B.; Wasfy, M.A.S.; Fernandez, C.; Garcia-Sanchez, J. An In Vivo Confocal Masked Study on Corneal Epithelium and Subbasal Nerves in Patients with Dry Eye. Investig. Opthalmol. Vis. Sci. 2004, 45, 3030–3035. [Google Scholar] [CrossRef] [Green Version]
- Lin, H.; Li, W.; Dong, N.; Chen, W.; Liu, J.; Chen, L.; Yuan, H.; Geng, Z.; Liu, Z. Changes in Corneal Epithelial Layer Inflammatory Cells in Aqueous Tear–Deficient Dry Eye. Investig. Opthalmol. Vis. Sci. 2010, 51, 122–128. [Google Scholar] [CrossRef]
- Villani, E.; Ceresara, G.; Beretta, S.; Magnani, F.; Viola, F.; Ratiglia, R. In Vivo Confocal Microscopy of Meibomian Glands in Contact Lens Wearers. Investig. Opthalmol. Vis. Sci. 2011, 52, 5215–5219. [Google Scholar] [CrossRef] [Green Version]
- Matsumoto, Y.; Sato, E.A.; Ibrahim, O.M.; Dogru, M.; Tsubota, K. The application of in vivo laser confocal microscopy to the diagnosis and evaluation of meibomian gland dysfunction. Mol. Vis. 2008, 14, 1263–1271. [Google Scholar]
- Ibrahim, O.M.; Matsumoto, Y.; Dogru, M.; Adan, E.S.; Wakamatsu, T.H.; Goto, T.; Negishi, K.; Tsubota, K. The Efficacy, Sensitivity, and Specificity of In Vivo Laser Confocal Microscopy in the Diagnosis of Meibomian Gland Dysfunction. Ophthalmology 2010, 117, 665–672. [Google Scholar] [CrossRef] [PubMed]
- Randon, M.; Aragno, V.; Abbas, R.; Liang, H.; Labbé, A.; Baudouin, C.; Hong, L. In vivo confocal microscopy classification in the diagnosis of meibomian gland dysfunction. Eye 2018, 33, 754–760. [Google Scholar] [CrossRef] [PubMed]
- Zhao, H.; Chen, J.-Y.; Wang, Y.-Q.; Lin, Z.-R.; Wang, S. In vivo Confocal Microscopy Evaluation of Meibomian Gland Dysfunction in Dry Eye Patients with Different Symptoms. Chin. Med. J. (Engl.) 2016, 129, 2617–2622. [Google Scholar] [CrossRef]
- Arita, R. Meibography: A Japanese Perspective. Investig. Opthalmol. Vis. Sci. 2018, 59, DES48–DES55. [Google Scholar] [CrossRef] [Green Version]
- Robin, J.B.; Jester, J.V.; Nobe, J.; Nicolaides, N.; Smith, R.E. In Vivo Transillumination Biomicroscopy and Photography of Meibomian Gland Dysfunction. Ophthalmology 1985, 92, 1423–1426. [Google Scholar] [CrossRef]
- Giannaccare, G.; Bonifazi, F.; Sebastiani, S.; Sessa, M.; Pellegrini, M.; Arpinati, M.; Moscardelli, F.; Versura, P.; Campos, E. Meibomian Gland Dropout in Hematological Patients Before Hematopoietic Stem Cell Transplantation. Cornea 2018, 37, 1264–1269. [Google Scholar] [CrossRef]
- Arita, R.; Itoh, K.; Maeda, S.; Maeda, K.; Amano, S. A Newly Developed Noninvasive and Mobile Pen-Shaped Meibography System. Cornea 2013, 32, 242–247. [Google Scholar] [CrossRef]
- Pult, H.; Riede-Pult, B. Non-contact meibography: Keep it simple but effective. Contact Lens Anterior Eye 2012, 35, 77–80. [Google Scholar] [CrossRef] [PubMed]
- Bernabei, F.; Versura, P.; Pellegrini, M.; Moscardelli, F.; Bonifazi, F.; Sessa, M.; Arpinati, M.; Scorcia, V.; Giannaccare, G. Longitudinal Analysis of Infrared Meibography in Patients Undergoing Hematopoietic Stem Cell Transplantation. Cornea 2020, 39, 812–817. [Google Scholar] [CrossRef] [PubMed]
- Wise, R.J.; Sobel, R.K.; Allen, R.C. Meibography: A review of techniques and technologies. Saudi J. Ophthalmol. 2012, 26, 349–356. [Google Scholar] [CrossRef] [Green Version]
- Sevim, D.G.; Gumus, K.; Unlu, M. Reliable, Noncontact Imaging Tool for the Evaluation of Meibomian Gland Function: Sirius Meibography. Eye Contact Lens Sci. Clin. Pract. 2020, 46, S135–S140. [Google Scholar] [CrossRef]
- Kim, H.M.; Eom, Y.; Song, J.S. The Relationship between Morphology and Function of the Meibomian Glands. Eye Contact Lens Sci. Clin. Pract. 2018, 44, 1–5. [Google Scholar] [CrossRef]
- Abusharha, A.A.; Pearce, E.I. The Effect of Low Humidity on the Human Tear Film. Cornea 2013, 32, 429–434. [Google Scholar] [CrossRef] [PubMed]
- Doane, M.G. An Instrument for In Vivo Tear Film Interferometry. Optom. Vis. Sci. 1989, 66, 383–388. [Google Scholar] [CrossRef]
- Yokoi, N.; Yamada, H.; Mizukusa, Y.; Bron, A.J.; Tiffany, J.M.; Kato, T.; Kinoshita, S. Rheology of Tear Film Lipid Layer Spread in Normal and Aqueous Tear–Deficient Dry Eyes. Investig. Opthalmol. Vis. Sci. 2008, 49, 5319–5324. [Google Scholar] [CrossRef] [PubMed]
- McDonald, J.E. Surface phenomena of tear films. Trans. Am. Ophthalmol. Soc. 1968, 66, 905–939. [Google Scholar] [CrossRef]
- Hamano, H.; Hori, M.; Kawabe, H.; Umeno, M.; Mitsunaga, S.; Ohnishi, Y.; Koma, I. Clinical Applications Of Bio Differential Interference Microscope. Contact Intraocular Lens Med. J. 1980, 6, 229–235. [Google Scholar]
- Guillon, J.-P. Tear film photography and contact lens wear. J. Br. Contact Lens Assoc. 1982, 5, 84–87. [Google Scholar] [CrossRef]
- Doane, M.G.; Lee, M.E. Tear Film Interferometry as a Diagnostic Tool for Evaluating Normal and Dry-Eye Tear Film. Adv. Exp. Med. Biol. 1998, 438, 297–303. [Google Scholar]
- Khamene, A.; Negahdaripour, S.; Tseng, S. A spectral-discrimination method for tear-film lipid-layer thickness estimation from fringe pattern images. IEEE Trans. Biomed. Eng. 2000, 47, 249–258. [Google Scholar] [CrossRef]
- Hwang, H.S.; Kim, E.C.; Kim, M.S. Novel Tear Interferometer Made of Paper for Lipid Layer Evaluation. Cornea 2014, 33, 826–831. [Google Scholar] [CrossRef]
- Goto, E.; Tseng, S.C.G. Kinetic analysis of tear interference images in aqueous tear deficiency dry eye before and after punctal occlusion. Investig. Opthalmol. Vis. Sci. 2003, 44, 1897–1905. [Google Scholar] [CrossRef] [Green Version]
- Eom, Y.; Lee, J.-S.; Kang, S.-Y.; Kim, H.M.; Song, J.-S. Correlation Between Quantitative Measurements of Tear Film Lipid Layer Thickness and Meibomian Gland Loss in Patients With Obstructive Meibomian Gland Dysfunction and Normal Controls. Am. J. Ophthalmol. 2013, 155, 1104–1110.e2. [Google Scholar] [CrossRef] [PubMed]
- Cho, B.-J.; Jee, D.H.; Kim, W.J.; Shin, M.C.; Kim, E.C.; Kim, M.S.; Hwang, H.S. Direct Visualization of Continuous Meibum Secretion From the Orifices of Meibomian Glands to the Tear Film. Cornea 2019, 38, 1245–1252. [Google Scholar] [CrossRef]
- Molina-Solana, P.; Domínguez-Serrano, F.D.B.; Garrido-Hermosilla, A.M.; Montero-Iruzubieta, J.; Fernández-Palacín, A.; Rodríguez-De-La-Rúa-Franch, E.; Caro-Magdaleno, M. Improved Tear Film Stability in Patients with Dry Eye After Hyaluronic Acid and Galactoxyloglucan Use. Clin. Ophthalmol. 2020, 14, 1153–1159. [Google Scholar] [CrossRef] [PubMed]
- Lee, J.M.; Jeon, Y.J.; Kim, K.Y.; Hwang, K.-Y.; Kwon, Y.-A.; Koh, K. Ocular surface analysis: A comparison between the LipiView® II and IDRA®. Eur. J. Ophthalmol. 2020. [Google Scholar] [CrossRef] [PubMed]
- Giannaccare, G.; Vigo, L.; Pellegrini, M.; Sebastiani, S.; Carones, F. Ocular Surface Workup With Automated Noninvasive Measurements for the Diagnosis of Meibomian Gland Dysfunction. Cornea 2018, 37, 740–745. [Google Scholar] [CrossRef]
- Yokoi, N.; Mossa, F.; Tiffany, J.M.; Bron, A.J. Assessment of meibomian gland function in dry eye using meibometry. Arch. Ophthalmol. 1999, 117, 723–729. [Google Scholar] [CrossRef] [PubMed] [Green Version]
- Goto, E.; Dogru, M.; Kojima, T.; Tsubota, K. Computer-synthesis of an interference color chart of human tear lipid layer, by a colorimetric approach. Investig. Opthalmol. Vis. Sci. 2003, 44, 4693–4697. [Google Scholar] [CrossRef] [Green Version]
- Goto, E. Differentiation of Lipid Tear Deficiency Dry Eye by Kinetic Analysis of Tear Interference Images. Arch. Ophthalmol. 2003, 121, 173–180. [Google Scholar] [CrossRef]
- Arita, R.; Yabusaki, K.; Hirono, T.; Yamauchi, T.; Ichihashi, T.; Fukuoka, S.; Morishige, N. Automated Measurement of Tear Meniscus Height with the Kowa DR-1α Tear Interferometer in Both Healthy Subjects and Dry Eye Patients. Investig. Opthalmol. Vis. Sci. 2019, 60, 2092–2101. [Google Scholar] [CrossRef]
- Arita, R.; Morishige, N.; Fujii, T.; Fukuoka, S.; Chung, J.L.; Seo, K.Y.; Itoh, K. Tear Interferometric Patterns Reflect Clinical Tear Dynamics in Dry Eye Patients. Investig. Opthalmol. Vis. Sci. 2016, 57, 3928. [Google Scholar] [CrossRef] [Green Version]
- Lee, Y.; Hyon, J.Y.; Jeon, H.S. Characteristics of dry eye patients with thick tear film lipid layers evaluated by a LipiView II interferometer. Graefe’s Arch. Clin. Exp. Ophthalmol. 2021, 259, 1235–1241. [Google Scholar] [CrossRef]
- Weng, H.-Y.; Ho, W.-T.; Chiu, C.-Y.; Tsai, T.-Y.; Chang, S.-W. Characteristics of tear film lipid layer in young dry eye patients. J. Formos. Med. Assoc. 2021, 120, 1478–1484. [Google Scholar] [CrossRef] [PubMed]
- Purslow, C.; Wolffsohn, J. The Relation between Physical Properties of the Anterior Eye and Ocular Surface Temperature. Optom. Vis. Sci. 2007, 84, 197–201. [Google Scholar] [CrossRef]
- Craig, J.P.; Singh, I.P.; Tomlinson, A.; Morgan, P.; Efron, N. The role of tear physiology in ocular surface temperature. Eye 2000, 14, 635–641. [Google Scholar] [CrossRef] [PubMed] [Green Version]
- Versura, P.; Giannaccare, G.; Fresina, M.; Campos, E.C. Subjective Discomfort Symptoms Are Related to Low Corneal Temperature in Patients with Evaporative Dry Eye. Cornea 2015, 34, 1079–1085. [Google Scholar] [CrossRef]
- Morgan, P.; Tullo, A.B.; Efron, N. Infrared thermography of the tear film in dry eye. Eye 1995, 9, 615–618. [Google Scholar] [CrossRef] [Green Version]
- Kamao, T.; Yamaguchi, M.; Kawasaki, S.; Mizoue, S.; Shiraishi, A.; Ohashi, Y. Screening for Dry Eye With Newly Developed Ocular Surface Thermographer. Am. J. Ophthalmol. 2011, 151, 782–791.e1. [Google Scholar] [CrossRef] [PubMed]
- Su, T.-Y.; Chang, S.-W.; Yang, C.-J.; Chiang, H.K. Direct observation and validation of fluorescein tear film break-up patterns by using a dual thermal-fluorescent imaging system. Biomed. Opt. Express 2014, 5, 2614–2619. [Google Scholar] [CrossRef] [Green Version]
- Baudouin, C.; Barton, K.; Cucherat, M.; Traverso, C. The Measurement of Bulbar Hyperemia: Challenges and Pitfalls. Eur. J. Ophthalmol. 2015, 25, 273–279. [Google Scholar] [CrossRef]
- Leibowitz, H.M. The Red Eye. N. Engl. J. Med. 2000, 343, 345–351. [Google Scholar] [CrossRef]
- Schuman, J.S. Short- and long-term safety of glaucoma drugs. Expert Opin. Drug Saf. 2002, 1, 181–194. [Google Scholar] [CrossRef]
- Giannaccare, G.; Pellegrini, M.; Bernabei, F.; Senni, C.; Aloi, M.; Scalzo, G.C.; Ceravolo, D.; Iovino, C.; Scorcia, V. Comparative analysis of ocular redness score evaluated automatically in glaucoma patients under different topical medications. Eur. J. Ophthalmol. 2020. [Google Scholar] [CrossRef]
- Giannaccare, G.; Blalock, W.; Fresina, M.; Vagge, A.; Versura, P. Intolerant contact lens wearers exhibit ocular surface impairment despite 3 months wear discontinuation. Graefes Arch. Clin. Exp. Ophthalmol. 2016, 254, 1825–1831. [Google Scholar] [CrossRef]
- Vagge, A.; Senni, C.; Bernabei, F.; Pellegrini, M.; Scorcia, V.; E Traverso, C.; Giannaccare, G. Therapeutic Effects of Lactoferrin in Ocular Diseases: From Dry Eye Disease to Infections. Int. J. Mol. Sci. 2020, 21, 6668. [Google Scholar] [CrossRef] [PubMed]
- Roda, M.; Corazza, I.; Reggiani, M.L.B.; Pellegrini, M.; Taroni, L.; Giannaccare, G.; Versura, P. Dry Eye Disease and Tear Cytokine Levels—A Meta-Analysis. Int. J. Mol. Sci. 2020, 21, 3111. [Google Scholar] [CrossRef]
- Schulze, M.; Jones, D.; Simpson, T.L. The Development of Validated Bulbar Redness Grading Scales. Optom. Vis. Sci. 2007, 84, 976–983. [Google Scholar] [CrossRef]
- Park, I.K.; Chun, Y.S.; Kim, K.G.; Yang, H.K.; Hwang, J.-M. New Clinical Grading Scales and Objective Measurement for Conjunctival Injection. Investig. Opthalmol. Vis. Sci. 2013, 54, 5249–5257. [Google Scholar] [CrossRef] [PubMed] [Green Version]
- Singh, R.B.; Liu, L.; Anchouche, S.; Yung, A.; Mittal, S.K.; Blanco, T.; Dohlman, T.H.; Yin, J.; Dana, R. Ocular redness—I: Etiology, pathogenesis, and assessment of conjunctival hyperemia. Ocul. Surf. 2021, 21, 134–144. [Google Scholar] [CrossRef] [PubMed]
- Villumsen, J.; Ringquist, J.; Alm, A. Image analysis of conjunctival hyperemia. Acta Ophthalmol. 2009, 69, 536–539. [Google Scholar] [CrossRef]
- Willingham, F.F.; Cohen, K.L.; Coggins, J.M.; Tripoli, N.K.; Ogle, J.W.; Goldstein, G.M. Automatic quantitative measurement of ocular hyperemia. Curr. Eye Res. 1995, 14, 1101–1108. [Google Scholar] [CrossRef]
- Rodriguez, J.D.; Johnston, P.R.; Iii, G.W.O.; Abelson, M.B.; Smith, L.M. Automated grading system for evaluation of ocular redness associated with dry eye. Clin. Ophthalmol. 2013, 7, 1197–1204. [Google Scholar] [CrossRef] [Green Version]
- Efron, N.; Morgan, P.B.; Katsara, S.S. Validation of grading scales for contact lens complications. Ophthalmic Physiol. Opt. 2001, 21, 17–29. [Google Scholar]
- Wu, S.; Hong, J.; Tian, L.; Cui, X.; Sun, X.; Xu, J. Assessment of Bulbar Redness with a Newly Developed Keratograph. Optom. Vis. Sci. 2015, 92, 892–899. [Google Scholar] [CrossRef]
- Roy, N.S.; Wei, Y.; Kuklinski, E.; Asbell, P.A. The Growing Need for Validated Biomarkers and Endpoints for Dry Eye Clinical Research. Investig. Opthalmol. Vis. Sci. 2017, 58, BIO1–BIO19. [Google Scholar] [CrossRef] [Green Version]
- Rajalakshmi, R.; Dutt, S.; Sivaraman, A.; Savoy, F. Insights into the growing popularity of artificial intelligence in ophthalmology. Indian J. Ophthalmol. 2020, 68, 1339–1346. [Google Scholar] [CrossRef]
- Yedidya, T.; Hartley, R.; Guillon, J.-P.; Kanagasingam, Y. Automatic Dry Eye Detection. In Medical Image Computing and Computer-Assisted Intervention–MICCAI 2007; Springer: Brisbane, Australia, 2007; pp. 792–799. [Google Scholar]
- Ramos, L.; Barreira, N.; Mosquera, A.; Currás, M.; Pena-Verdeal, H.; Giráldez, M.J.; Penedo, M.G. Computational Approach for Measuring the Tear Film Break-Up Time in an Unsupervised Manner. Commun. Netw. 2013, 254–267. [Google Scholar]
- Krizhevsky, A.; Sutskever, I.; Hinton, G.E. ImageNet classification with deep convolutional neural networks. Adv. Neural Inf. Process. Syst. 2012, 25, 1097–1105. Available online: https://proceedings.neurips.cc/paper/2012/file/c399862d3b9d6b76c8436e924a68c45b-Paper.pdf (accessed on 14 July 2021).
- Litjens, G.; Kooi, T.; Bejnordi, B.E.; Setio, A.A.A.; Ciompi, F.; Ghafoorian, M.; van der Laak, J.A.; van Ginneken, B.; Sánchez, C.I. A survey on deep learning in medical image analysis. Med. Image Anal. 2017, 42, 60–88. [Google Scholar] [CrossRef] [PubMed] [Green Version]
- Su, T.-Y.; Liu, Z.-Y.; Chen, D.-Y. Tear Film Break-Up Time Measurement Using Deep Convolutional Neural Networks for Screening Dry Eye Disease. IEEE Sens. J. 2018, 18, 6857–6862. [Google Scholar] [CrossRef]
- Remeseiro, B.; Mosquera, A.; Penedo, M.G.; García-Resúa, C. Tear Film Maps based on the Lipid Interference Patterns. In Proceedings of the International Conference on Agents and Artificial Intelligence, Angers, France, 6–8 March 2014; SCITEPRESS: Setúbal, Portugal, 2014; Volume 1, pp. 732–739. [Google Scholar]
- Guillon, J.-P. Non-invasive tearscope plus routine for contact lens fitting. Contact Lens Anterior Eye 1998, 21, S31–S40. [Google Scholar] [CrossRef]
- Remeseiro, B.; Barreira, N.; García-Resúa, C.; Lira, M.; Giráldez, M.J.; Yebra-Pimentel, E.; Penedo, M.G. iDEAS: A web-based system for dry eye assessment. Comput. Methods Programs Biomed. 2016, 130, 186–197. [Google Scholar] [CrossRef] [PubMed]
- Acharya, U.R.; Tan, J.H.; Koh, J.E.; Sudarshan, V.K.; Yeo, S.; Too, C.L.; Chua, C.K.; Ng, E.; Tong, L. Automated diagnosis of dry eye using infrared thermography images. Infrared Phys. Technol. 2015, 71, 263–271. [Google Scholar] [CrossRef]
- Giannaccare, G.; Vaccaro, S.; Mancini, A.; Scorcia, V. Dry eye in the COVID-19 era: How the measures for controlling pandemic might harm ocular surface. Graefe’s Arch. Clin. Exp. Ophthalmol. 2020, 258, 2567–2568. [Google Scholar] [CrossRef] [PubMed]


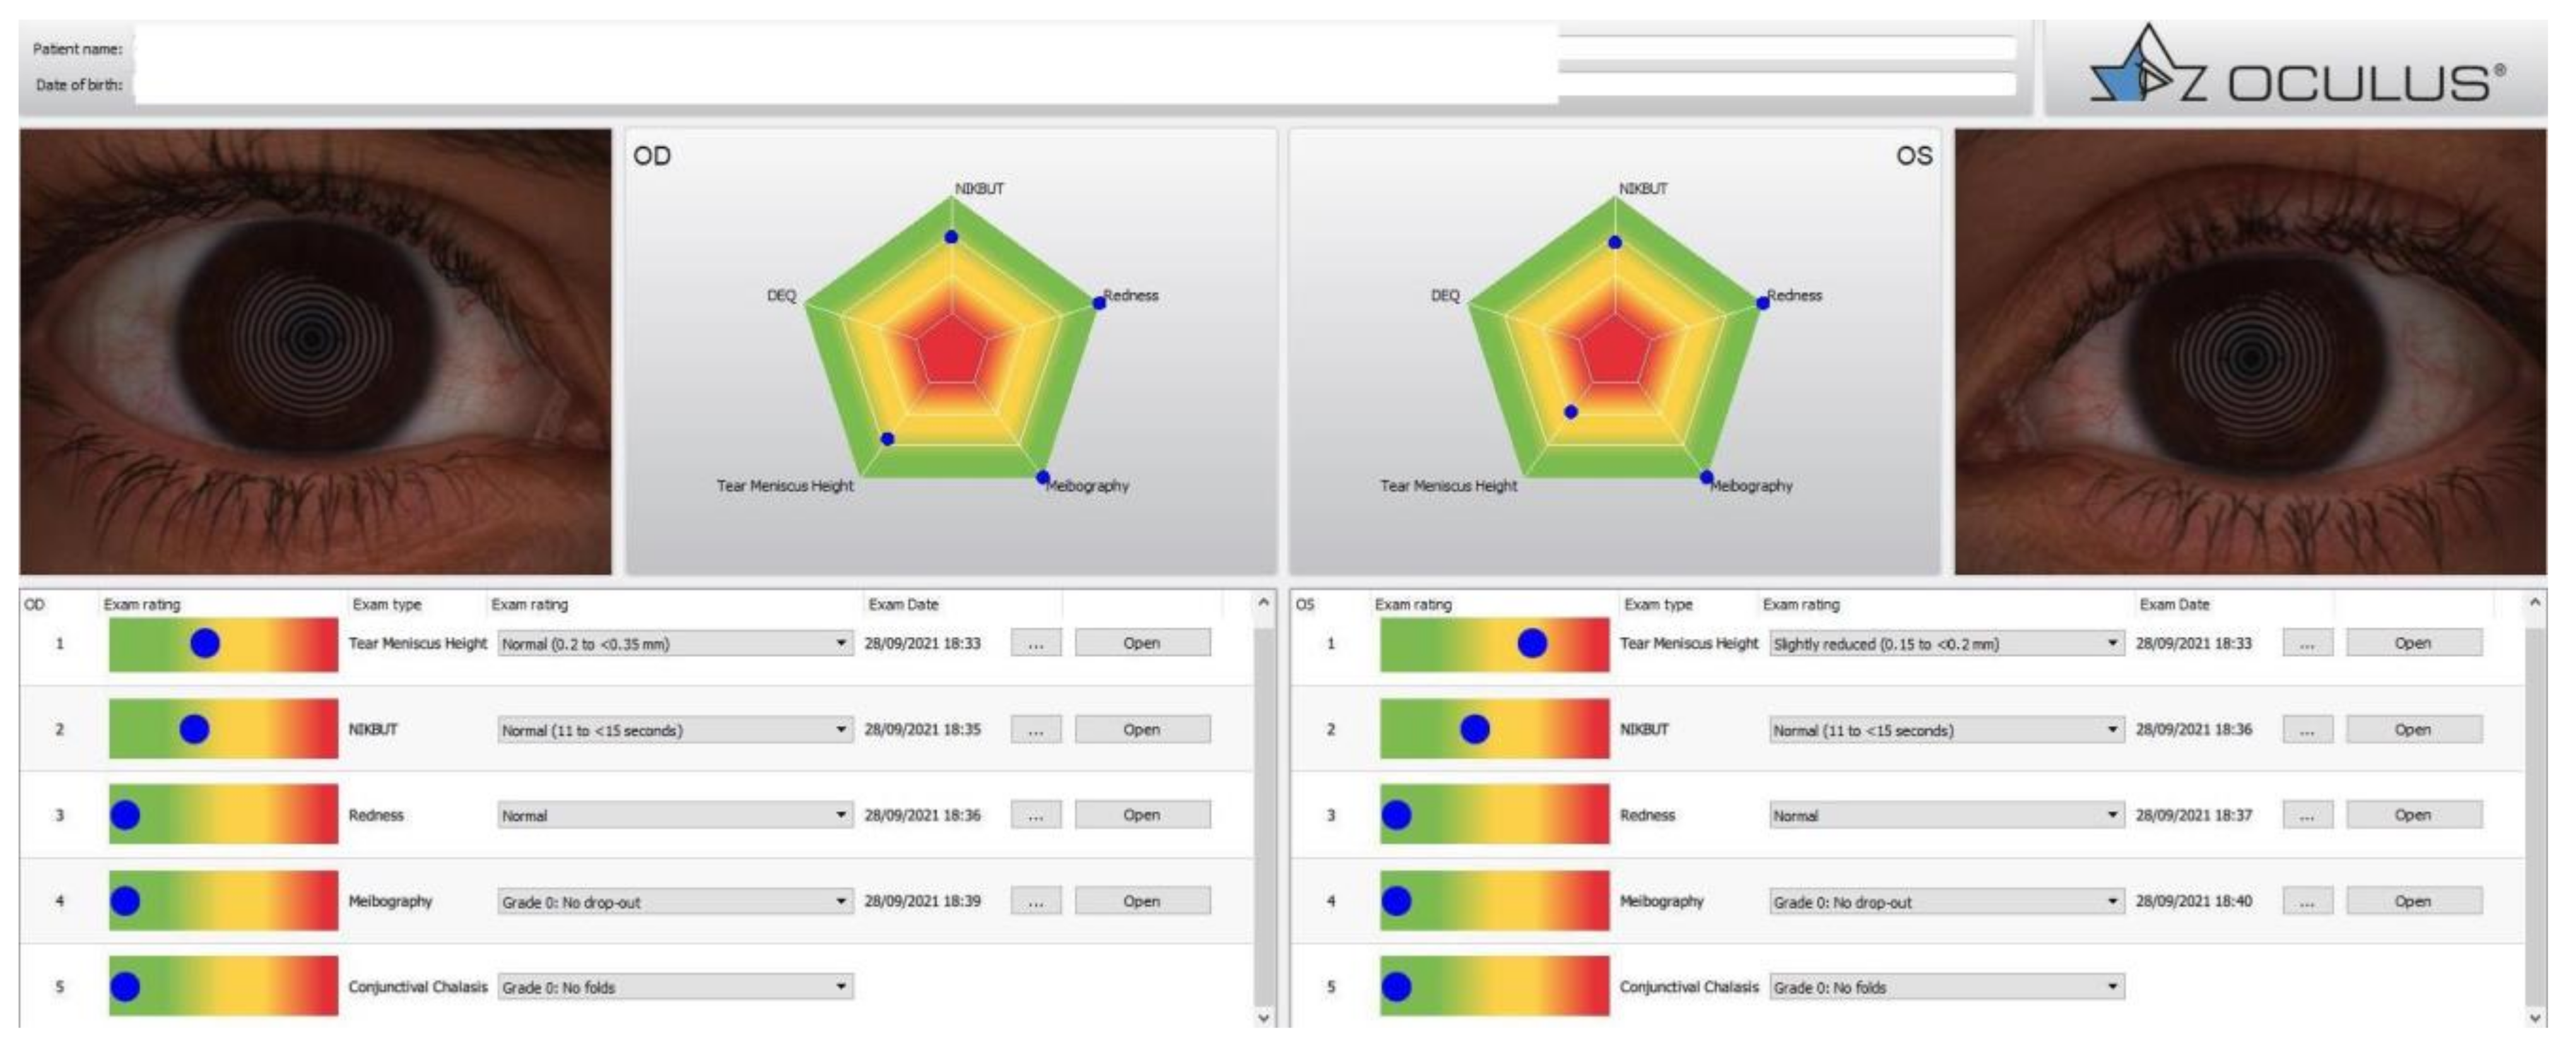
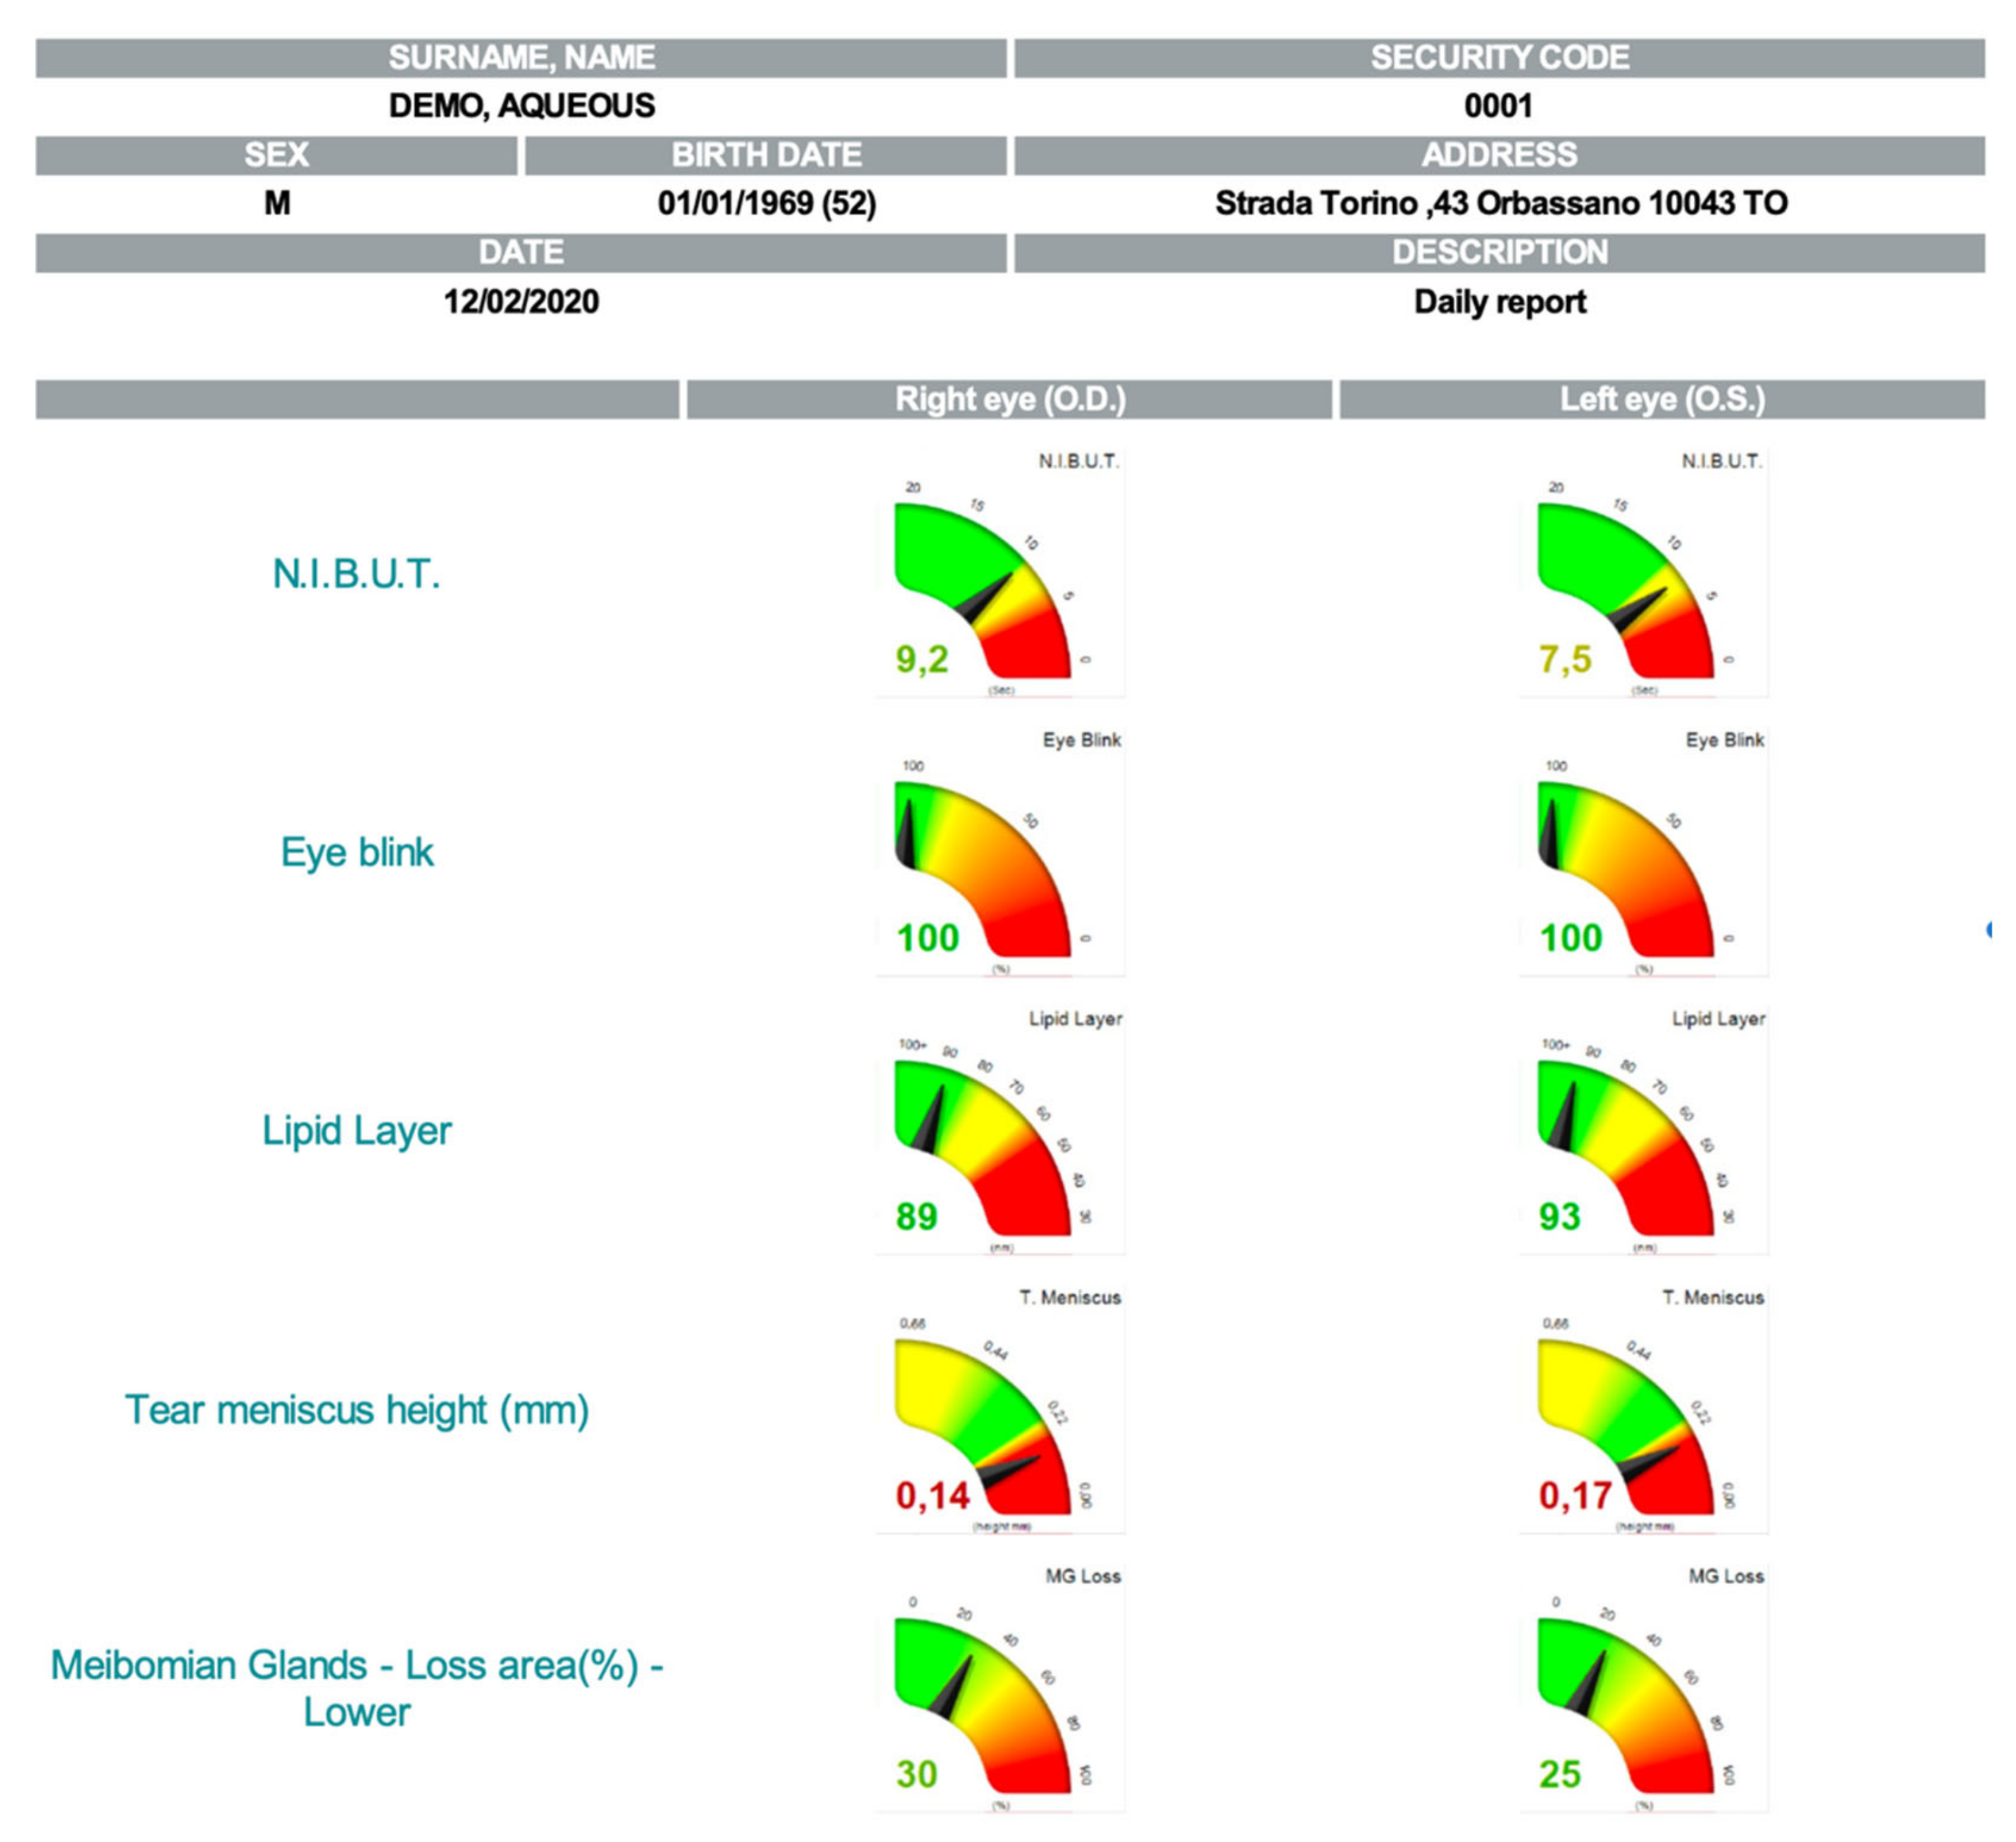
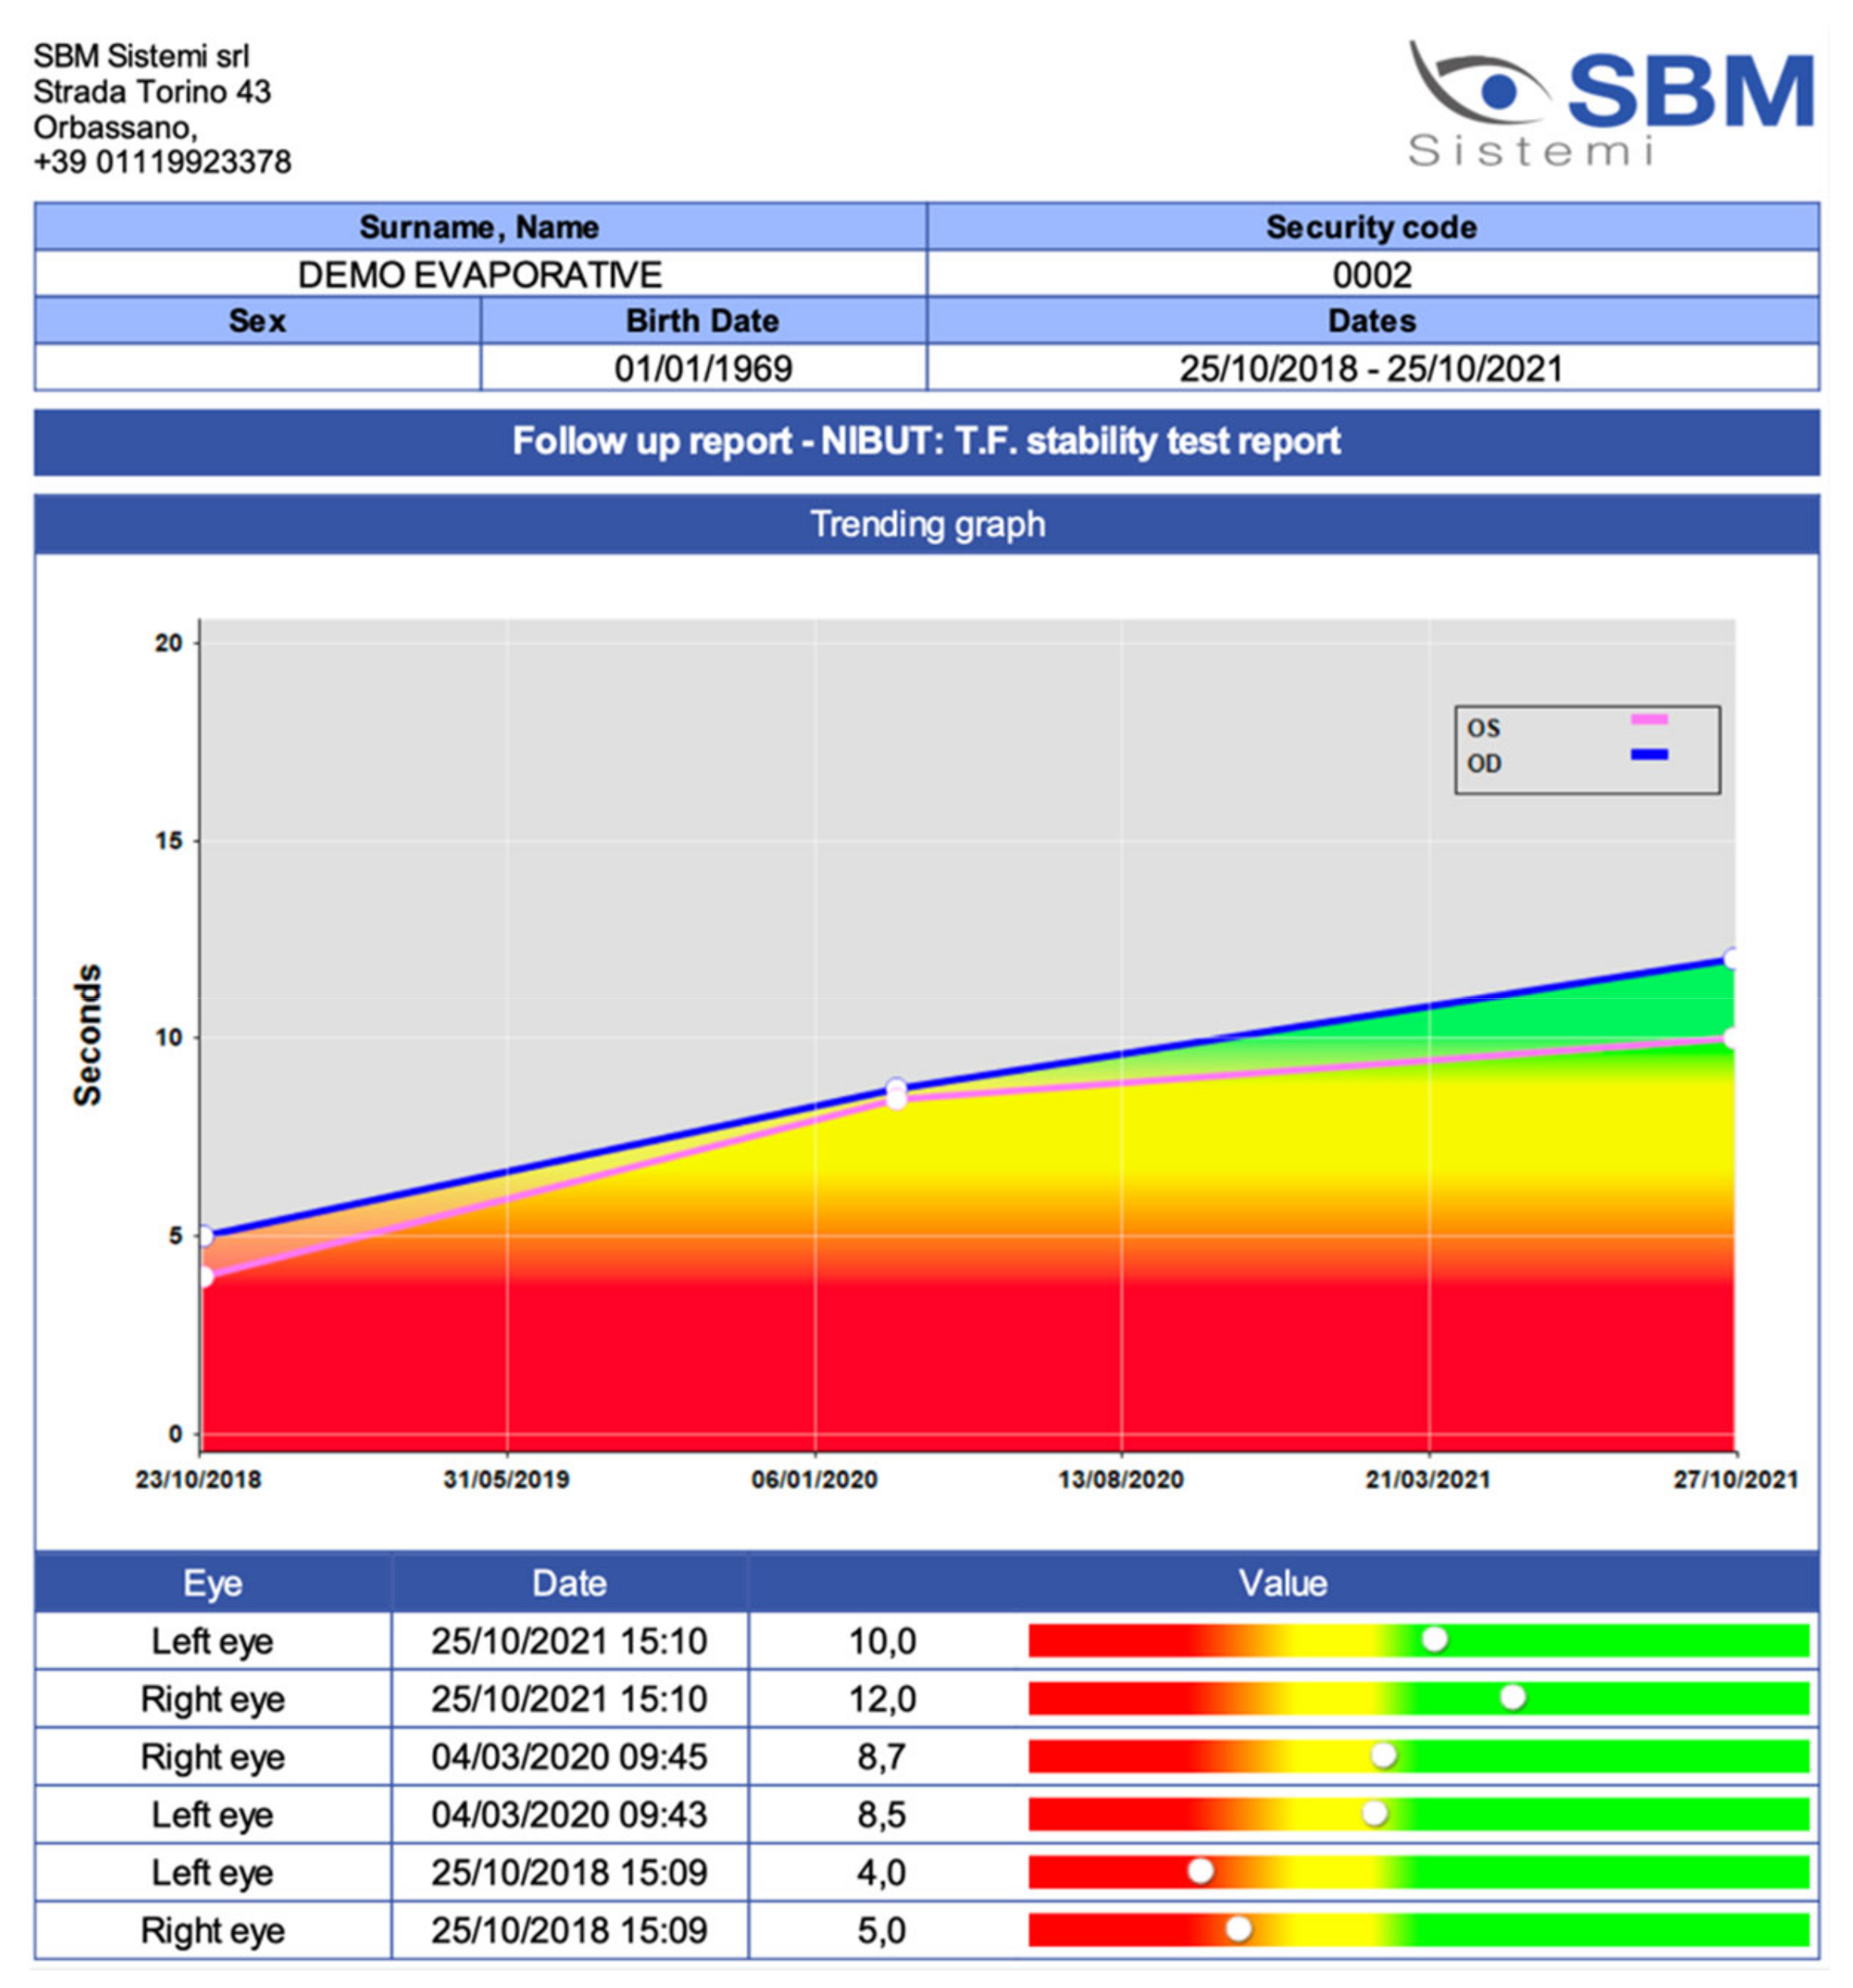
| IDRA | KERATOGRAPH | O.S.A. | LACRYDIAG | TEARCHECK | |
|---|---|---|---|---|---|
| N.I.B.U.T | Automatic evaluation of tear film break-up time | Automatic evaluation of tear film break-up time with infrared illumination | Automatic evaluation of tear film break-up time | Automatic evaluation of tear film break-up time | Automatic evaluation of tear film break-up time |
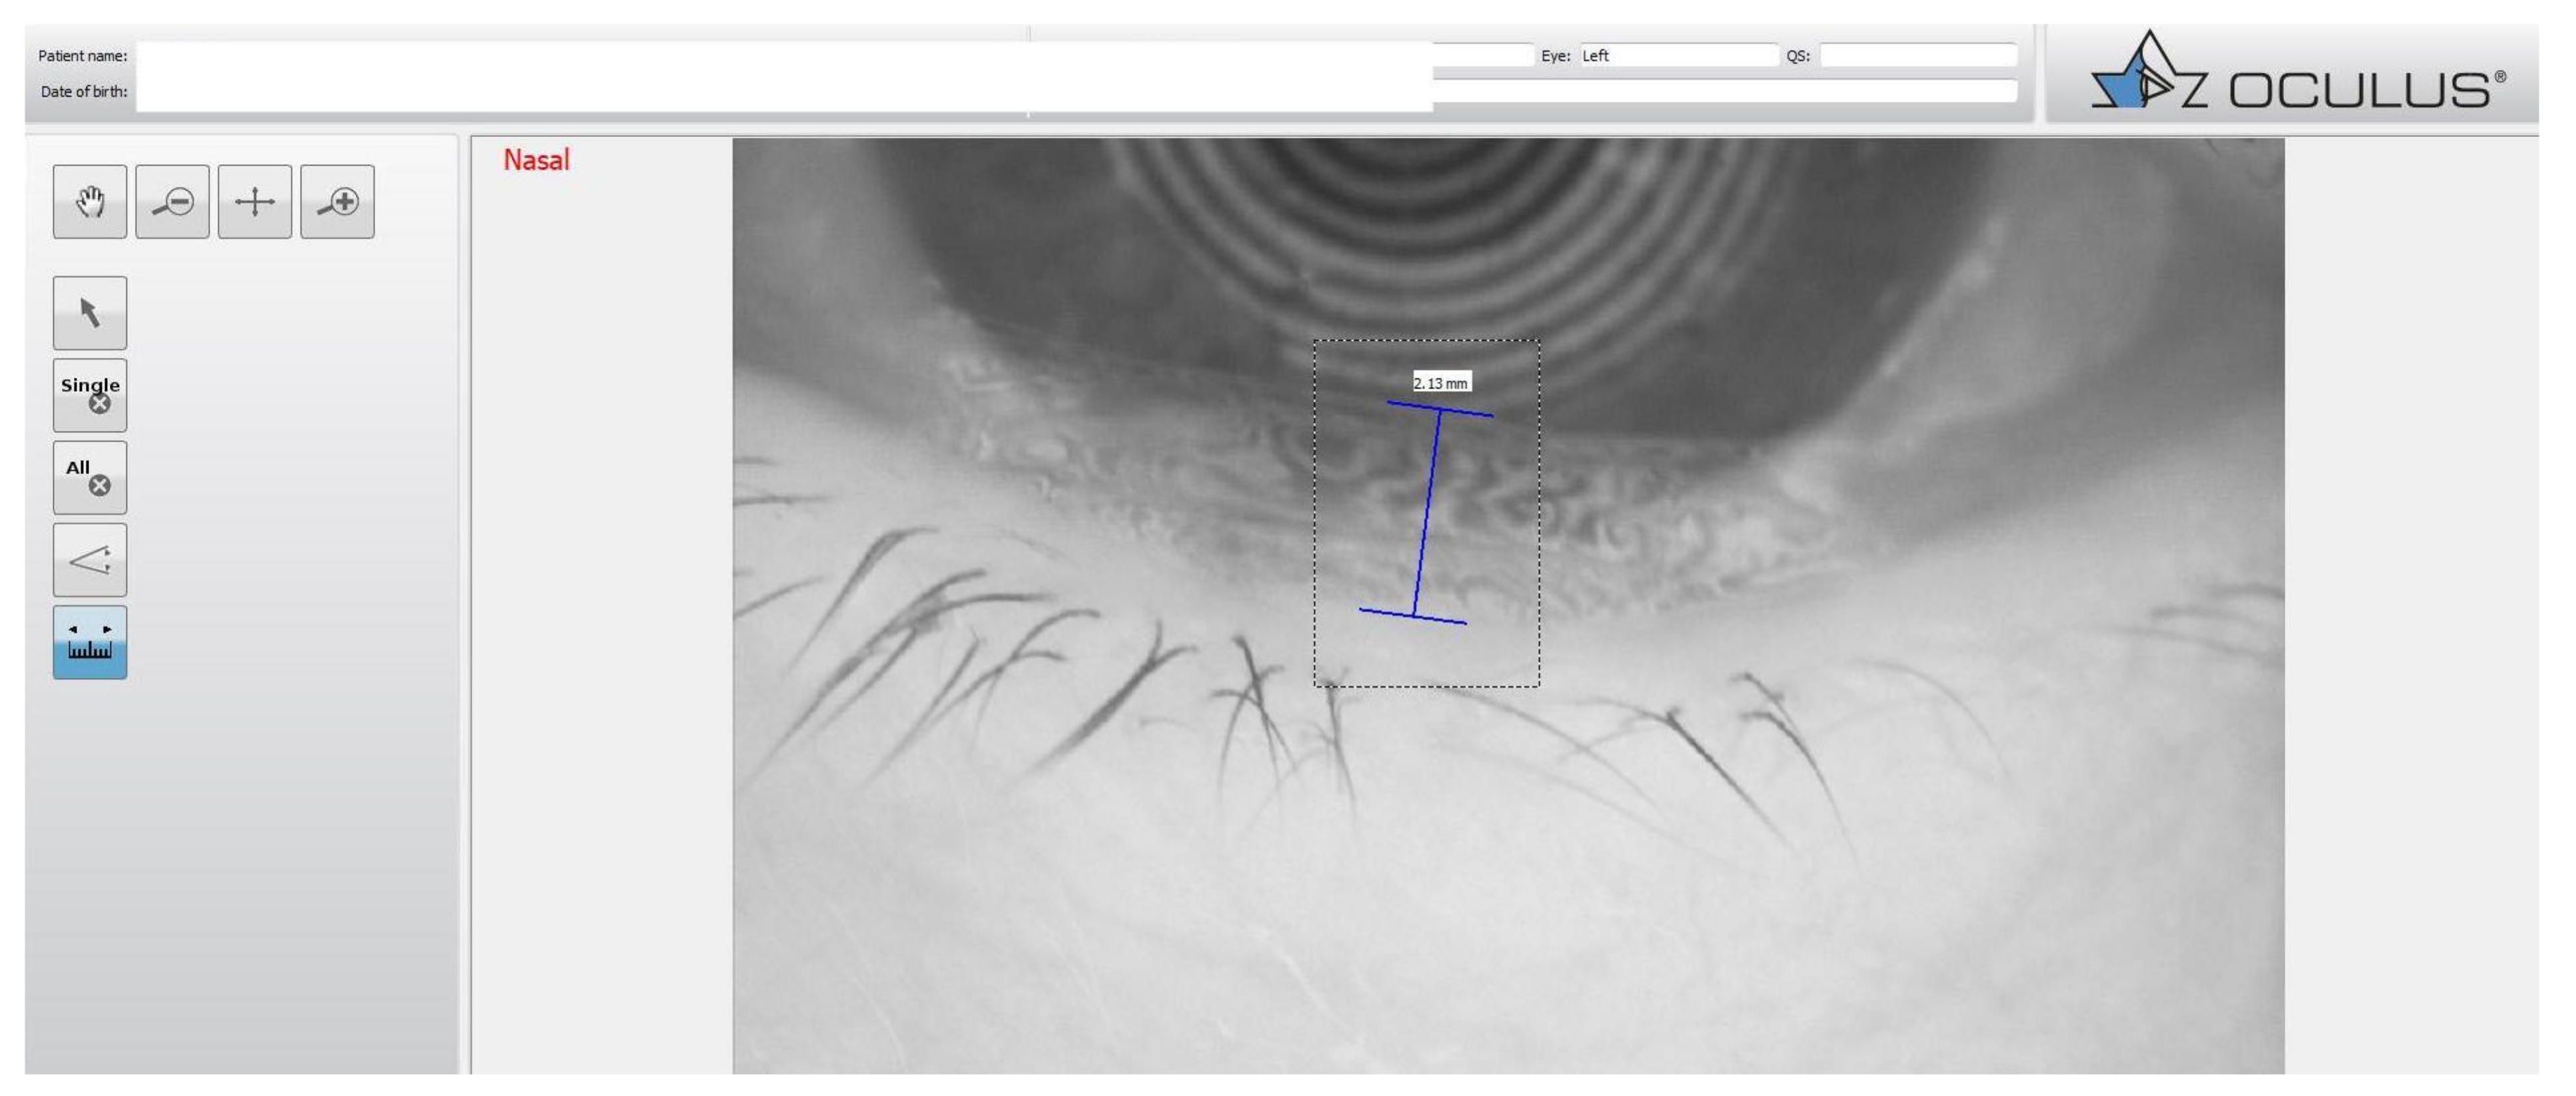
| Meibography | View of the presence of abnormal gland structures in a high-resolution 3D image | Morphological changes in the gland tissue are made visible using the Meibo-Scan and can be classified with the JENVIS Meibo Grading Scales | View of the presence of abnormal gland structures in a high-resolution 3D image | Automatic detection of meibomian glands and automatic calculation of the percentage of loss | Viewof the rate of gland loss in % |
| Interferometry | Automatic evaluation of the lipid layer | The thickness of the lipid layer is automatically assessed based on the structure and color | Manual evaluation of the lipid layer | Qualitative and quantitative analysis of the lipid layer Evaluation of lipid layer thickness based on a grading scale | Not available |
| Tear Meniscus | Estimation of the tear film quantity up to 5 values | The height of the tear meniscus can be precisely measured with an integrated ruler | Estimation of the tear film quantity up to five values | Measurement of tear meniscus height (mm) | Calculate manually the height of the tear meniscus |
| Bulbar Redness | Comparison with all international grading scales (efron, cclru, jenvis) | The R-Scan automatically detects the blood vessels in the conjunctiva and evaluates the degree of redness | Comparison with all international grading scales (efron, cclru, jenvis) | Not available | Available |
Publisher’s Note: MDPI stays neutral with regard to jurisdictional claims in published maps and institutional affiliations. |
© 2021 by the authors. Licensee MDPI, Basel, Switzerland. This article is an open access article distributed under the terms and conditions of the Creative Commons Attribution (CC BY) license (https://creativecommons.org/licenses/by/4.0/).
Share and Cite
Di Cello, L.; Pellegrini, M.; Vagge, A.; Borselli, M.; Ferro Desideri, L.; Scorcia, V.; Traverso, C.E.; Giannaccare, G. Advances in the Noninvasive Diagnosis of Dry Eye Disease. Appl. Sci. 2021, 11, 10384. https://doi.org/10.3390/app112110384
Di Cello L, Pellegrini M, Vagge A, Borselli M, Ferro Desideri L, Scorcia V, Traverso CE, Giannaccare G. Advances in the Noninvasive Diagnosis of Dry Eye Disease. Applied Sciences. 2021; 11(21):10384. https://doi.org/10.3390/app112110384
Chicago/Turabian StyleDi Cello, Luca, Marco Pellegrini, Aldo Vagge, Massimiliano Borselli, Lorenzo Ferro Desideri, Vincenzo Scorcia, Carlo E. Traverso, and Giuseppe Giannaccare. 2021. "Advances in the Noninvasive Diagnosis of Dry Eye Disease" Applied Sciences 11, no. 21: 10384. https://doi.org/10.3390/app112110384