PCR Array Technology in Biopsy Samples Identifies Up-Regulated mTOR Pathway Genes as Potential Rejection Biomarkers After Kidney Transplantation
 Isabel Legaz1†
  María Victoria Bernardo2† Rafael Alfaro2 Helios Martínez-Banaclocha2 Jose Antonio Galián2
  Victor Jimenez-Coll2 Francisco Boix2 Anna Mrowiec2 Diego Salmeron3,4,5
  Carmen Botella2
  Antonio Parrado2 María Rosa Moya-Quiles2
  Alfredo Minguela2
  Santiago Llorente6 Jesús de la Peña-Moral7 Manuel Muro2*
- 1Department of Legal and Forensic Medicine, Faculty of Medicine, Biomedical Research Institute (IMIB), University of Murcia, Murcia, Spain
- 2Department of Immunology, University Clinical Hospital Virgen de la Arrixaca-Biomedical Research Institute of Murcia (IMIB), Murcia, Spain
- 3Departamento de Ciencias Sociosanitarias, Universidad de Murcia, Murcia, Spain
- 4Centro de Investigación Biomédica en Red (CIBER) Epidemiología y Salud Pública (CIBERESP), Murcia, Spain
- 5Instituto Murciano de Investigacion Biomédica-Arrixaca, Murcia, Spain
- 6Department of Nephrology, University Clinical Hospital Virgen de la Arrixaca-Biomedical Research Institute of Murcia (IMIB), Murcia, Spain
- 7Department of Pathology Services, University Clinical Hospital Virgen de la Arrixaca-Biomedical Research Institute of Murcia (IMIB), Murcia, Spain
Background: Antibody-mediated rejection (AMR) is the major cause of kidney transplant rejection. The donor-specific human leukocyte antigen (HLA) antibody (DSA) response to a renal allograft is not fully understood yet. mTOR complex has been described in the accommodation or rejection of transplants and integrates responses from a wide variety of signals. The aim of this study was to analyze the expression of the mTOR pathway genes in a large cohort of kidney transplant patients to determine its possible influence on the transplant outcome.
Methods: A total of 269 kidney transplant patients monitored for DSA were studied. The patients were divided into two groups, one with recipients that had transplant rejection (+DSA/+AMR) and a second group of recipients without rejection (+DSA/–AMR and –DSA/–AMR, controls). Total RNA was extracted from kidney biopsies and reverse transcribed to cDNA. Human mTOR-PCR array technology was used to determine the expression of 84 mTOR pathway genes. STRING and REVIGO software were used to simulate gene to gene interaction and to assign a molecular function.
Results: The studied groups showed a different expression of the mTOR pathway related genes. Recipients that had transplant rejection showed an over-expressed transcript (≥5-fold) of AKT1S1, DDIT4, EIF4E, HRAS, IGF1, INS, IRS1, PIK3CD, PIK3CG, PRKAG3, PRKCB (>12-fold), PRKCG, RPS6KA2, TELO2, ULK1, and VEGFC, compared with patients that did not have rejection. AKT1S1 transcripts were more expressed in +DSA/–AMR biopsies compared with +DSA/+AMR. The main molecular functions of up-regulated gene products were phosphotransferase activity, insulin-like grown factor receptor and ribonucleoside phosphate binding. The group of patients with transplant rejection also showed an under-expressed transcript (≥5-fold) of VEGFA (>15-fold), RPS6, and RHOA compared with the group without rejection. The molecular function of down-regulated gene products such as protein kinase activity and carbohydrate derivative binding proteins was also analyzed.
Conclusions: We have found a higher number of over-expressed mTOR pathway genes than under-expressed ones in biopsies from rejected kidney transplants (+DSA/+AMR) with respect to controls. In addition to this, the molecular function of both types of transcripts (over/under expressed) is different. Therefore, further studies are needed to determine if variations in gene expression profiles can act as predictors of graft loss, and a better understanding of the mechanisms of action of the involved proteins would be necessary.
Introduction
Humoral rejection in renal transplantation is usually caused by the presence of preformed antibodies in the recipient against human leukocyte antigens (HLA) of the donor (1, 2), referred to as donor-specific antibodies (DSAs). Antibody-mediated rejection (AMR) is the major cause of kidney transplant rejection (3–5). The donor-specific human leukocyte antigen (HLA) antibody (DSA) response to a renal allograft is not fully understood (6). Some patients with DSAs develop chronic or acute AMR and eventually reject their allografts, while others do not with biopsies showing normal histopathology (7–10). Therefore, the influence of HLA matching and preformed DSAs in kidney transplantation remains unclear (11–14).
The mammalian target of rapamycin (mTOR) is a conserved large serine/threonine protein kinase and a member of the phosphoinositide-3-kinase (PI3K) related kinase family (15, 16). The mTOR forms two structurally and functionally distinct complexes, called rapamycin-sensitive complex 1 mammalian target 1 (mTORC1) and rapamycin-insensitive complex 2 mammalian target 2 (mTORC2). mTORC1 consists of mTOR, raptor, GβL, and DEPTOR, while mTORC2 consists of mTOR, RICTOR, GβL, PRR5, and SIN1. mTORC1 combines signals from various growth factors, nutrients and energy supply to promote cell growth and regulates multiple biosynthetic cellular processes (protein synthesis, cell cycle progression, cell growth, and proliferation) (17–22). mTORC1 mainly regulates cell growth and metabolism, while mTORC2 controls cell proliferation and survival in particular (17, 20, 22). Nowadays, some mTORC2 regulators have been identified, and although more of them are yet to be discovered, new mechanisms of selectively inhibiting mTORC2 are emerging (23).
Studies involving selective gene regulation of mTOR complexes (mTORC1 and mTORC2) in renal cell populations and/or inhibition of pharmacological mTOR revealed important roles of mTOR in homeostasis of podocytes and tubular transport (24, 25). There have also been important advances in understanding the function of mTOR in kidney injury, polycystic kidney disease and glomerular diseases, including diabetic nephropathy (26–29).
Since mTOR plays a role in the regulation of immune cells metabolism, function, and reactivity (30–32) it has an influence on kidney transplant rejection, glomerulonephritis, and their treatment (19, 33). Both innate and adaptive immune cells (T and B lymphocytes) reside in the kidney and can promote acute and chronic renal disease (34–36), but their dependence on mTOR activity remains unexplored.
An area of interest is the potentially beneficial impact of mTOR inhibition in patients who have performed DSA at the time of transplant (23), because mTOR complex has been described in accommodation or rejection phenomena (37, 38) with non-definite conclusions about these important points (23). The analysis of gene expression of mTOR pathway in kidney biopsies of human transplant could be a biomarker to prevent or anticipate an eventual kidney rejection (39). A study in transplant recipients identified a complex signaling network triggered by HLA II antibody in vascular endothelial cells and indicated that combined ERK and mTORC2 inhibitors may be required to achieve optimal efficacy in controlling HLA II antibody-mediated AMR (40). In addition, several clinical studies of mTORi in heart transplant recipients demonstrated a significant reduction in the progression of cardiac allograft vasculopathy (CAV) and cytomegalovirus (CMV) infection with any mTOR inhibitor regimen, at the expense of higher rates of drug toxicity. Combining an mTOR inhibitor with mycophenolate mofetil (MMF) may also prevent calcineurin inhibitor-induced nephrotoxicity, but this benefit is offset by an increased risk of acute cellular rejection (ACR). Overall mortality rates were not affected by the use of an mTOR inhibitor. These findings in heart transplant may help to design more effective maintenance immunosuppression regimens (41–45).
Therefore, our aim was to explore the relationship between mTOR pathway gene expression and histological and immunological changes in a large cohort of kidney transplant patients to determine if there are differences in the mTOR pathway genes between patients that had kidney rejection (+DSA/+AMR) and patients without rejection (+DSA/–AMR and –DSA) to determine its possible influence on the transplant outcome.
Methods
Patient Enrollment and Data Acquisition
A total of 269 adult sequential kidney transplant (KT) patients were recruited at the University Clinic Hospital Virgen de la Arrixaca (Spain) during the period 2015–2019. The clinical, sociodemographic, biochemical data of kidney biopsy of transplant patients were studied. Mean age of total cohort of KT recipients was 46.0 ± 13.2 years (mean ± SD) of which 63% (n = 170) were men and 37% (n = 99) were women (Table 1). According to data from the Spanish National Transplant Organization (ONT), 59% of kidney recipients are men and 41% are women (46). Transplants were performed using unrelated cadaveric donors.
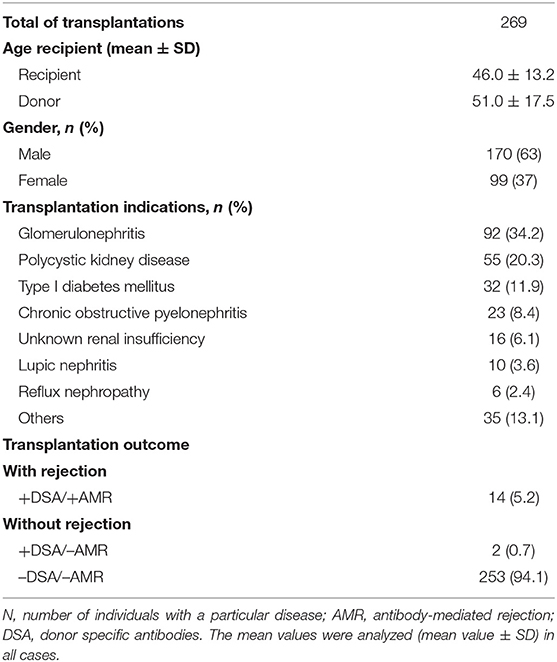
Table 1. Demographic data and main kidney transplantation indications.
Estimated glomerular filtration rate (eGFR) and creatinine were analyzed in all transplant patients considering normal values in accordance with the National Kidney Foundation: creatinine 0.7–1.2 mg/dl and eGFR >90 ml/min/1.73m2 (47). Our cohort of patients showed the following values before the transplant: creatinine (mg/dl; 2.9 ± 2.1; mean ± SD) and an eGFR <60 ml/min/1.73m2 for more than 3 months, which suggests a chronic kidney disease.
Only patients whose kidney graft functioned for at least 1-month post-transplantation and had DSA Luminex determinations for detection of anti-HLA antibodies (T and B cells) screening before transplantation were included in this study. Allograft loss was presumed if patients required dialysis.
Before participating in our study, all patients gave their informed consent to be included as a subject in the investigation. The research was carried out in compliance with the Helsinki Agreement, and the protocol was approved by the HCUVA Ethics Committee (PI15/01370).
Indications for Kidney Transplant
All of the patients in this study had end-stage kidney disease and were transplanted. As shown in Table 1, the main indication for KTs in our cohort (n = 269) was glomerulonephritis (n = 92; 34.2%), followed by polycystic kidney disease (n = 55; 20.3%), type I diabetes (n = 32; 11.9%), chronic obstructive pyelonephritis (n = 23; 8.4%), unknown renal insufficiency (n = 16; 6.1), lupic nephritis (n = 10; 3.6%), reflux nephropathy (n = 6; 2.4%). The rest of pathologies were included as others indications (n = 35; 13.1%).
Immunosuppressive Treatment
All enrolled recipients had similar triple immunosuppressive therapy, consisting of oral tacrolimus (Program, Astellas, Ireland), mycophenolate mofetil (MMF; CellCept, Roche, Switzerland), and prednisolone (Dacortin, Merck, Spain) as previously published (48–50).
The starting dose for the Tacrolimus (FK) based protocol was 0.10–0.15 mg/kg/day and the dose was adjusted to maintain an FK level in whole blood between 8 and 12 ng/ml during the first month post-transplant, between 7 and 10 ng/ml during months 2 and 3 post-transplant and between 5 and 8 ng/ml, thereafter. The starting dose for MMF was 2,000 mg/day, and reduced to 1,000–1,500 mg/day during the first month post-transplant, based on white blood cells count.
Methylprednisolone was administered intravenously at doses of 500, 250, and 125 mg/day on the day of transplantation, days 1–2 and days 3–4 after the operation, respectively. Oral prednisolone treatment started on day 5 after the operation with a dose of 20 mg/day, and then tapered to 5–10 mg/day within 2–3 months after transplant. No rapamycin was administered in this group of patients.
Kidney Rejection Diagnosis
Allograft acute cellular rejection (ACR) was defined as an increase in serum creatinine of at least 20% above baseline serum creatinine and confirmed by biopsy. Protocol biopsies were classically not performed in our clinical hospital. The indication for biopsy was increased creatinine values and/or presence of DSA antibodies in routine evaluation. In the case of patients with DSA+/AMR+ (n = 14), the mean age was 45.3 ± 19.2, gender was distributed in 9 males and 5 females, and indications pre-transplant were 6 patients with glomerulonephritis, 3 patients with polycystic kidney disease, 2 patients with diabetes type I, 1 patient with chronic obstructive pyelonephritis, 1 patient with lupic nephritis and one more with reflux nephropathy. The two patients with DSA+/AMR– (n = 2) had a mean age of 41.7 ± 21.4, gender was distributed in 1 male and 1 female, and indications pre-transplant were 1 patient with glomerulonephritis and the other one with polycystic kidney disease.
Specimens were evaluated by light microscopy and immunofluorescence staining with a marker of classical complement activation (C4d) and classified according to Banff classification as updated in 2017 (51). The diagnosis of acute antibody-mediated rejection (AMR) requires the presence of distinguishable histopathological findings, a positive C4d staining in peritubular capillaries, and the simultaneous presence of DSA (52). For the renal transplant, a consensus agreement was reached, indicating that a diagnosis of AMR requires the simultaneous presence of DSA, distinguishable histopathological findings and deposition of C4d in peritubular capillaries. Six patients were diagnosed in the first 3-month after kidney transplant, three patients were diagnosed between months 3 and 6, three patients between months 6 and 12, and two patients were diagnosed after the 12th month. Mean serum creatinine at the time of renal biopsy was 3.9 ± 3.7 mg/dL. Proteinuria was 2.97 ± 4.21 g/day. Of the 14 AMR biopsied specimens, 4 presented intimal arteritis. Interstitial inflammation was present in 12 biopsies, tubulitis in 10, glomerulitis in 9, and peritubular capillarity is in 11.
Mild acute cellular rejection (Banff grade I) was treated with pulse steroids (500 mg methylprednisolone boluses) and increased maintenance immunosuppression. All other ACR were treated with anti-thymocyte globulin (ATG).
Acute rejection episodes were further classified as steroid-sensitive rejections (ACR Banff grade I) or steroid-insensitive rejections, ACR Banff grade II and III, and antibody-mediated rejection (AMR). AMR was also treated with pulse steroids and intravenous immunoglobulin (0.25 g/kg) and the last session 1 g/kg (maximum 140 g) divided in two doses associated with plasmapheresis (3 sessions a day, every 5 days). Afterwards, we administered 500 mg anti-CD20 (Rituximab, Roche pharmaceuticals) intravenously. Anti-AMR treatment was also administered in two patients receiving anti-proteasome inhibitor Bortezomic (Velcade®, formerly PS-341). No correlation was observed between acute T-cell mediated rejection (TCMR) and pre- and post-transplant DSA (data not shown).
Determination of the Causes of Kidney Graft Loss
In the cases of sudden death, the major causes of kidney graft failure have been examined in total patients and obtained from medical death certificates and/or medico-legal autopsy to determine the cause and circumstances of death.
DSAs Luminex anti-HLA Antibody Screening
DSAs Luminex anti-HLA antibody test was performed in serum collected every 3 months from all the patients in this study while on the waiting list. The time points for dynamic testing post-transplantation were established and serum samples were obtained at week 2, at months 1, 3, 6, and 12 and then annually for 3 years, and when clinically indicated. All serum samples were analyzed and tested for anti-DSA using microbeads solid phase luminex-based SAB (OneLambda, CA).
Antibody screening by multiplex Luminex was performed in all samples (LABScreen® Mix and SAB kits, OL, CA). Color-coded microspheres, coated with the major HLA class I and II antigens, were incubated with the serum for 30 min at room temperature in the dark. After three washes the samples were incubated with 100 μL of 1:100 phycoerythrin-conjugated goat anti-human IgG (One Lambda). Finally, after two washes, the fluorescent signal intensity for each microsphere was measured using LABScan® 100 Flow analyzer (Luminex, Austin, TX). The cut-off for positive samples was the Normalized Background (NBG) ratio as recommended by the manufacturer and it was obtained with HLA Fusion® software 4.0 (One Lambda).
The reporter fluorescence intensity of each bead was expressed as median fluorescence intensity (MFI) levels which is directly proportional to the amount of antibody bound to the microspheres. MFI levels higher than 1,000–1,500 are usually considered positive, as commonly accepted (53, 54). De novo DSA (dnDSA) was considered positive if new IgG antibodies not present at the time of transplantation were detected and the normalized intensity via single antigen bead was 1,500 MFI. We also tested to what extent prozone might have masked the presence of allo-antibodies prior to transplant and post-transplant for DTT or EDTA treatment and also tested neat and 1:8 and 1:16 titer in parallel and all results were similar.
Isolation of RNA and cDNA Synthesis
Total RNA was extracted and isolated from kidney biopsies after tissue homogenization (Trizol; Invitrogen, Carlsbad, CA) and then purified by RNeasy®MinElute™ Purification Kit (Qiagen, Dusseldorf, Germany). Genomic DNA (gDNA) was removed by treatment with DNase I (Sigma Aldrich), according to the manufacturer's instructions and reverse transcribed to cDNA using a RT2 First Strand Kit (SABiosciences, Qiagen) and stored at −20°C.
The absence of contaminating gDNA was demonstrated by the absence of a product in wells using “no RT” control samples, which included all components of the cDNA synthesis reaction, except for reverse transcripts. The quality and concentration of RNA was assessed by spectrophotometry (NanoDrop 2000/2000c Thermofisher Scientific). RNA integrity was assessed by electrophoresis of the denaturing agarose gel. For each RNA sample thick bright bands of 28s and 18s ribosomal RNA were observed, indicating that the RNA integrity was appropriate. The concentration of extracted RNA ranged from 369 to 612 ng/μL, with OD260/280 ratios ranging from 1.8 to 2.1, in accordance with experimental requirements.
Gene Expression of mTOR Pathway
The expression of a total of 84 key genes involved in the human mTOR pathway (RT2 Profiler™ PCR Array Human mTOR Signaling, Qiagen, Germany, Cod. PAHS098Z) was analyzed in kidney biopsies according to the manufacturer's protocol. Gene expression assays analyzed are listed in Table 2, which shows the access code to the GenBank (47) and UniGene (48) data bases and were used according to the manufacturer's instructions in triplicates.
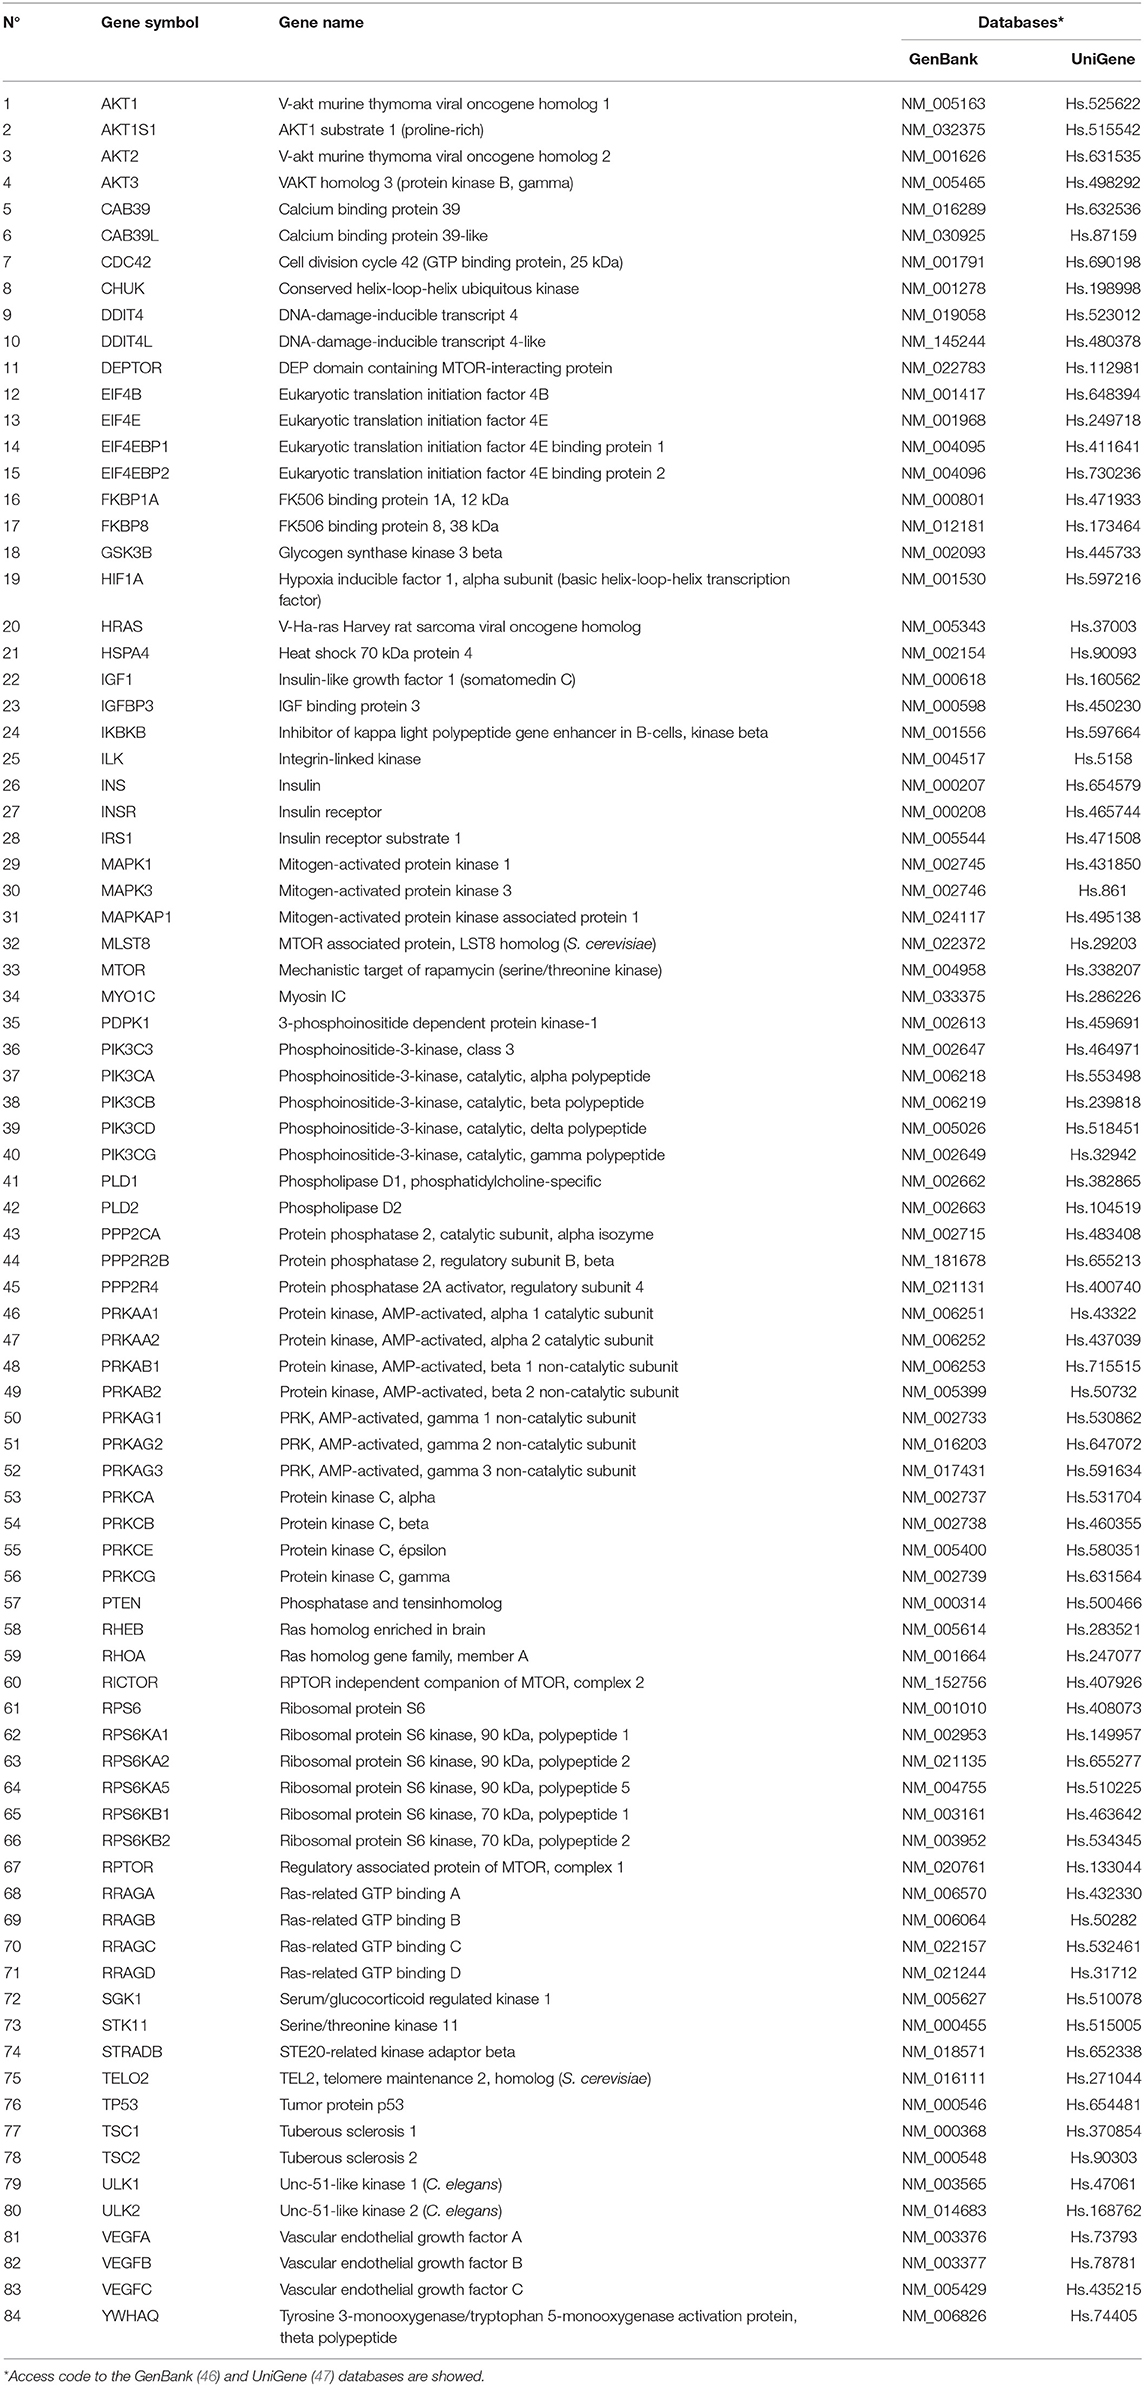
Table 2. Summary of 84 human mTOR pathway related genes analyzed by qPCR array in the kidney biopsies.
The cDNA template was applied to the quantitative reaction mixture in real time after sufficient dilution, and equal quantities of reaction liquid were applied to each well of the PCR array, containing gene-specific primers. PCR amplification was performed using real-time PCR detection (ABI StepOneplus™, Applied Biosystems, USA) under the following conditions; denaturing at 95°C for 10 min, 40 amplification cycles of denaturation at 95°C for 10 s, and annealing and extension at 60°C for 1 min, followed by acquisition of fluorescence signal. The mean Ct values were calculated from technical triplicates.
Data was analyzed using the comparative ΔΔCt method and expressed as fold-changes (40) in the target gene normalized to the mean of endogenous control genes (ACTB, B2M, GAPDH, HPRT, and RPLP0) in kidney biopsies with and without rejection. In addition to this, human genomic DNA contamination (HGDC), three RTC (Reverse Transcription Control) and three positive PCR Control (PPC) were also used according to the manufacturer's protocol. A gene was considered over or under expressed when there was fivefold (≥5-fold) difference between +DSA/+AMR patients and patients with kidney transplant showing +DSA/–AMR and –DSA samples (40).
Gene expression was analyzed in recipients who presented DSAs (+DSA) and showed anomalous biopsy histopathology and developed AMR (+AMR; n = 14) or presented de novo DSA (+DSA) without AMR development (+DSA/–AMR; n = 2). Biopsies from other recipients that did not have rejection were also analyzed as controls (–AMR; n = 253) (Table 1).
Genetic Relations and Molecular Functions
STRING software (version 10.5) (55) was used to study the different gene to gene relationships in the two groups of compared biopsies (rejection vs. without rejection; Figures 1, 2). The thickness of the edges of the network represents the strength of the interaction. The required interaction score was set at “the highest confidence” (0.900). Known interactions were obtained from curated or experimentally determined databases and shown with different color lines (blue and purple, respectively). Green circles represented up-regulated genes and red circles represented down-regulated genes (red circles). The most intense colored represents up- or down- expressed transcript (≥5-fold).
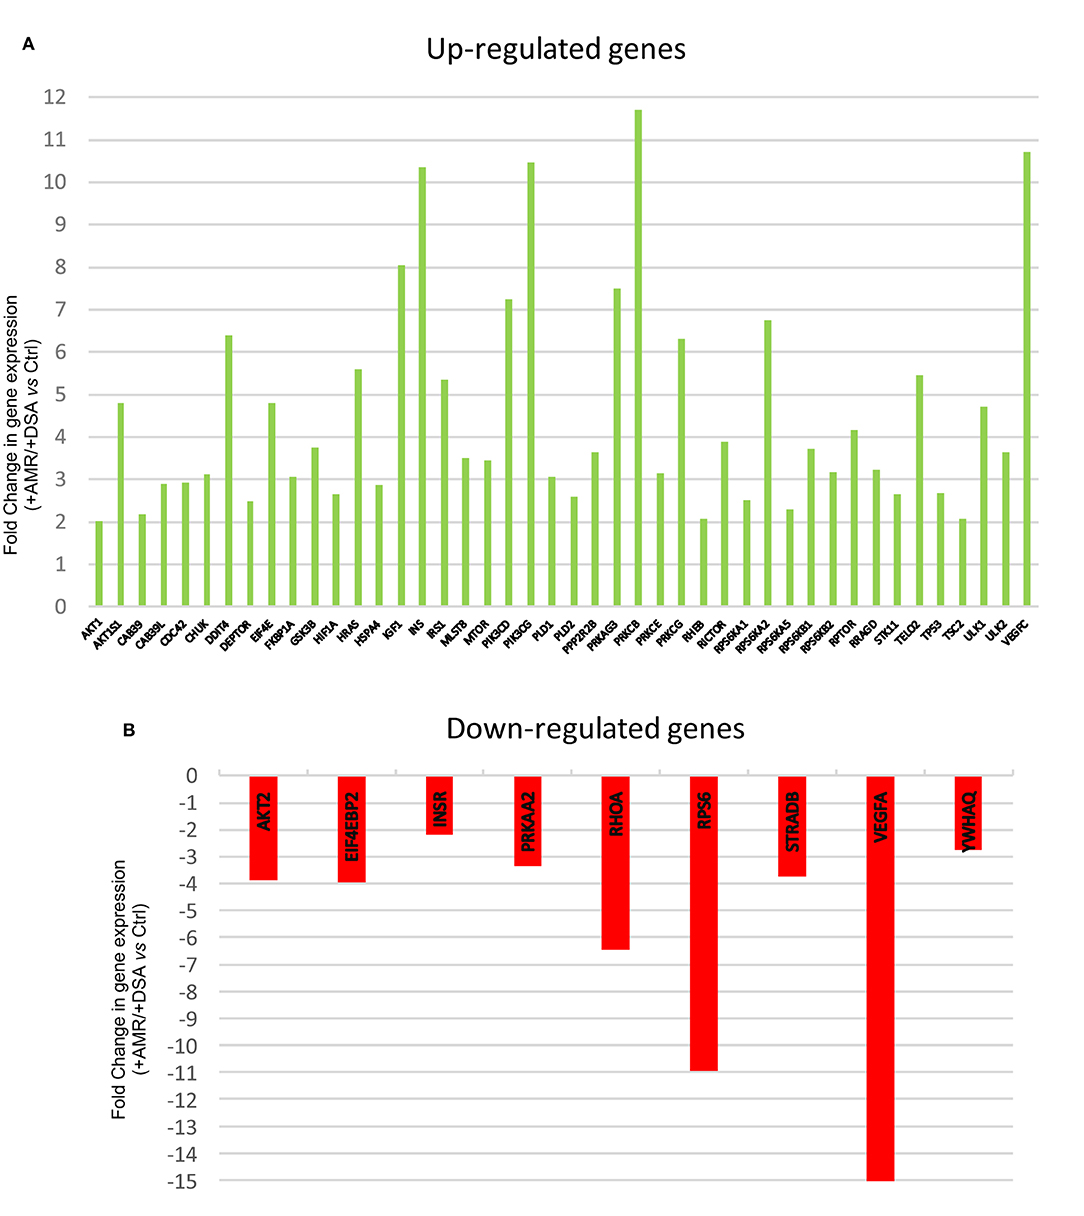
Figure 1. Differentially regulated mTOR pathway genes. (A) Up-regulated mTOR pathway genes (B) Down-regulated mTOR pathway genes.
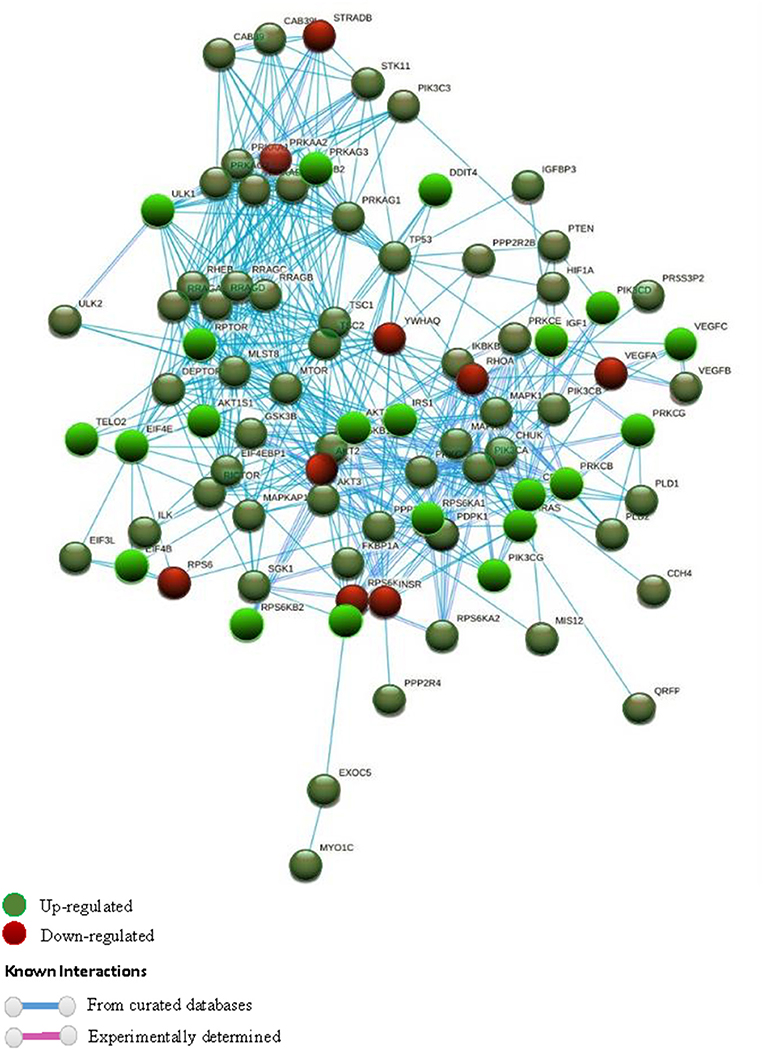
Figure 2. STRING interaction pathway of differentially expressed mTOR pathway genes. Green nodes indicate up-regulated genes and red nodes down-regulated genes comparing +AMR/+DSA and +DSA vs. –AMR/–DSA KT patients. The intensity of the color indicates the degree of regulation of the gene. The blue line shows that the interaction is checked against curated databases and the purple line shows that the interaction is experimentally determined.
REVIGO software (56) was used to assign a molecular function of up- or down-expressed transcript (≥5-fold). The parameters were as follows: allowed similarity = Small (0.5); Homo sapiens database; and Simrel as semantic similarity measure (Figure 3). KEGG mTOR pathway genes were used to locate genes expressed differently (Figure 4).
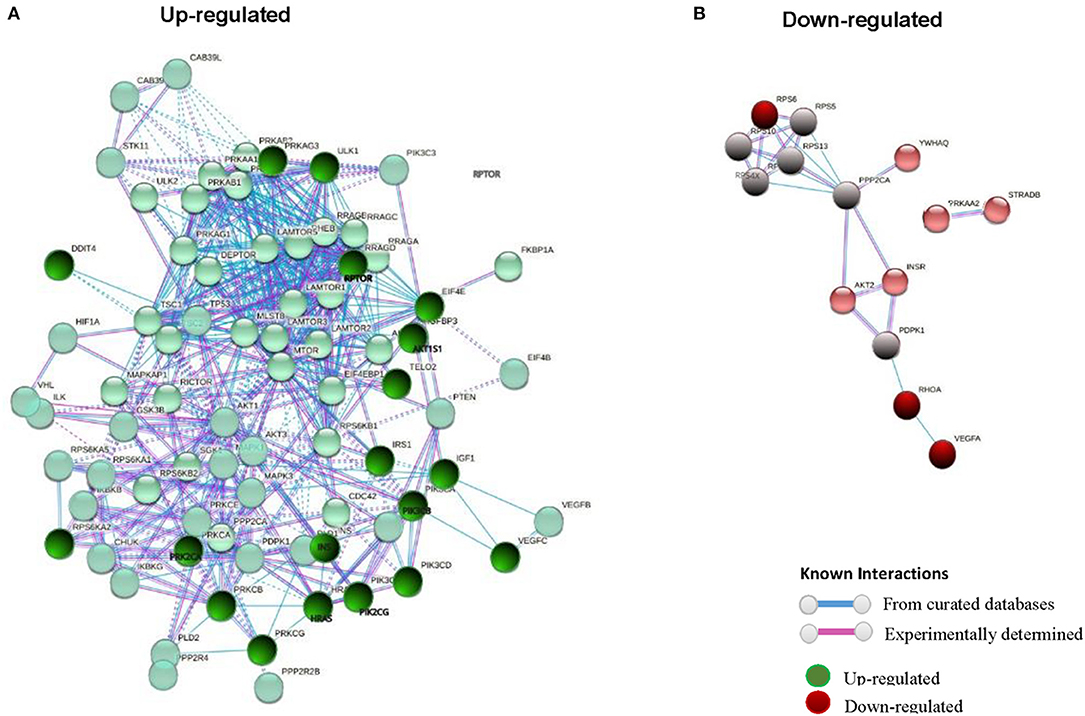
Figure 3. STRING interaction pathway of differentially expressed mTOR pathway genes comparing +AMR/+DSA and +DSA vs. –AMR/–DSA KT patients. (A) Green nodes indicate up-regulated genes. (B) Red nodes indicate down-regulated genes. The intensity of the color indicates the degree of regulation of the gene. The blue line shows that the interaction is checked against from curated databases and the purple line shows that the interaction is experimentally determined.
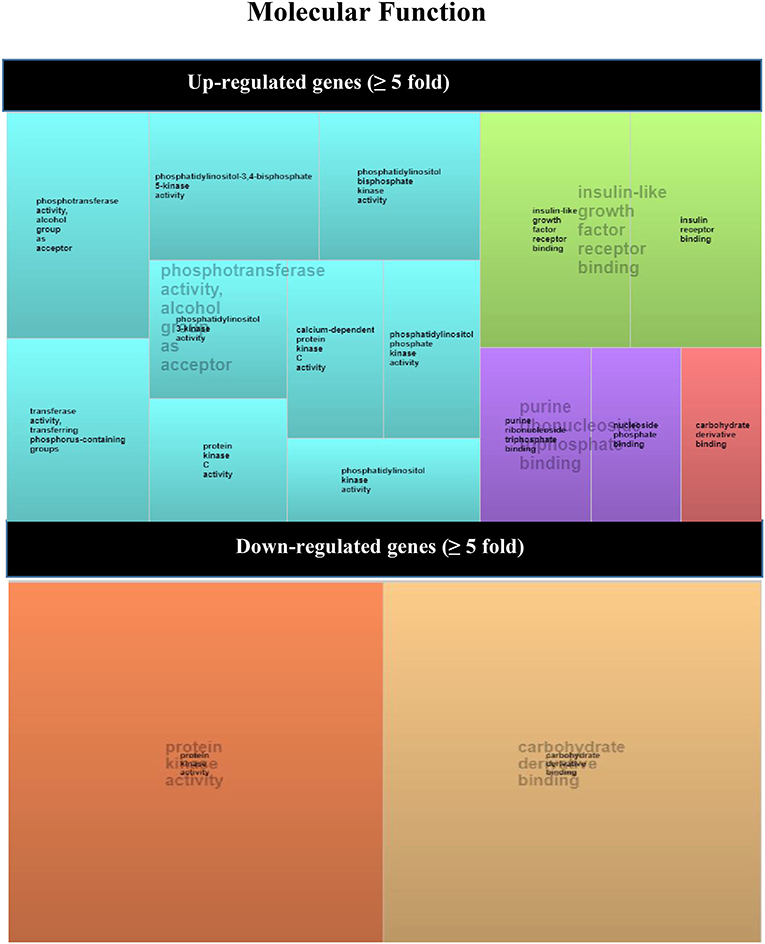
Figure 4. REVIGO TreeMap view of GO terms enriched between up- (upper TreeMaps) or down-regulated (lower TreeMaps) genes in biopsies from +DSA/+AMR patients vs. control recipients (–DSA/–AMR, +DSA/–AMR, and –DSA). Each rectangle is a single cluster representative. The representatives are joined into “superclusters” of loosely related terms that are visualized with distinct colors (indicated by centralized black text). The size of the rectangles reflects the enrichment of the GO term.
Statistical Analysis
Demographic data and results were collected in a database (Microsoft Access 2.0; Microsoft Corporation, Seattle, WA) and the analysis was performed using SPSS 23.0 (SPSS software Inc., Chicago, IL). All results were expressed as the mean ± SD or as a percentage. Demographic, clinical, immunological features, and post-transplant anti-HLA antibodies status were compared using Pearson χ2-test or Fisher's exact test for categorical data and Student t-test or Mann Whitney U-test for continuous data, as appropriate. A two-sided P-value <0.05 was considered as statistically significant. The statistical power to detect differential expression of each of the analyzed genes was performed, obtaining a total statistical power of 0.8 (80%) (57).
Results
Up-Regulated mTOR Genes in Rejection Kidney Biopsies
The genetic expression of the mTOR pathway in renal biopsies of +DSA/+AMR, +DSA/–AMR, and –DSA/–AMR kidney biopsies were analyzed (Table 3, Figures 1, 2, 3A).
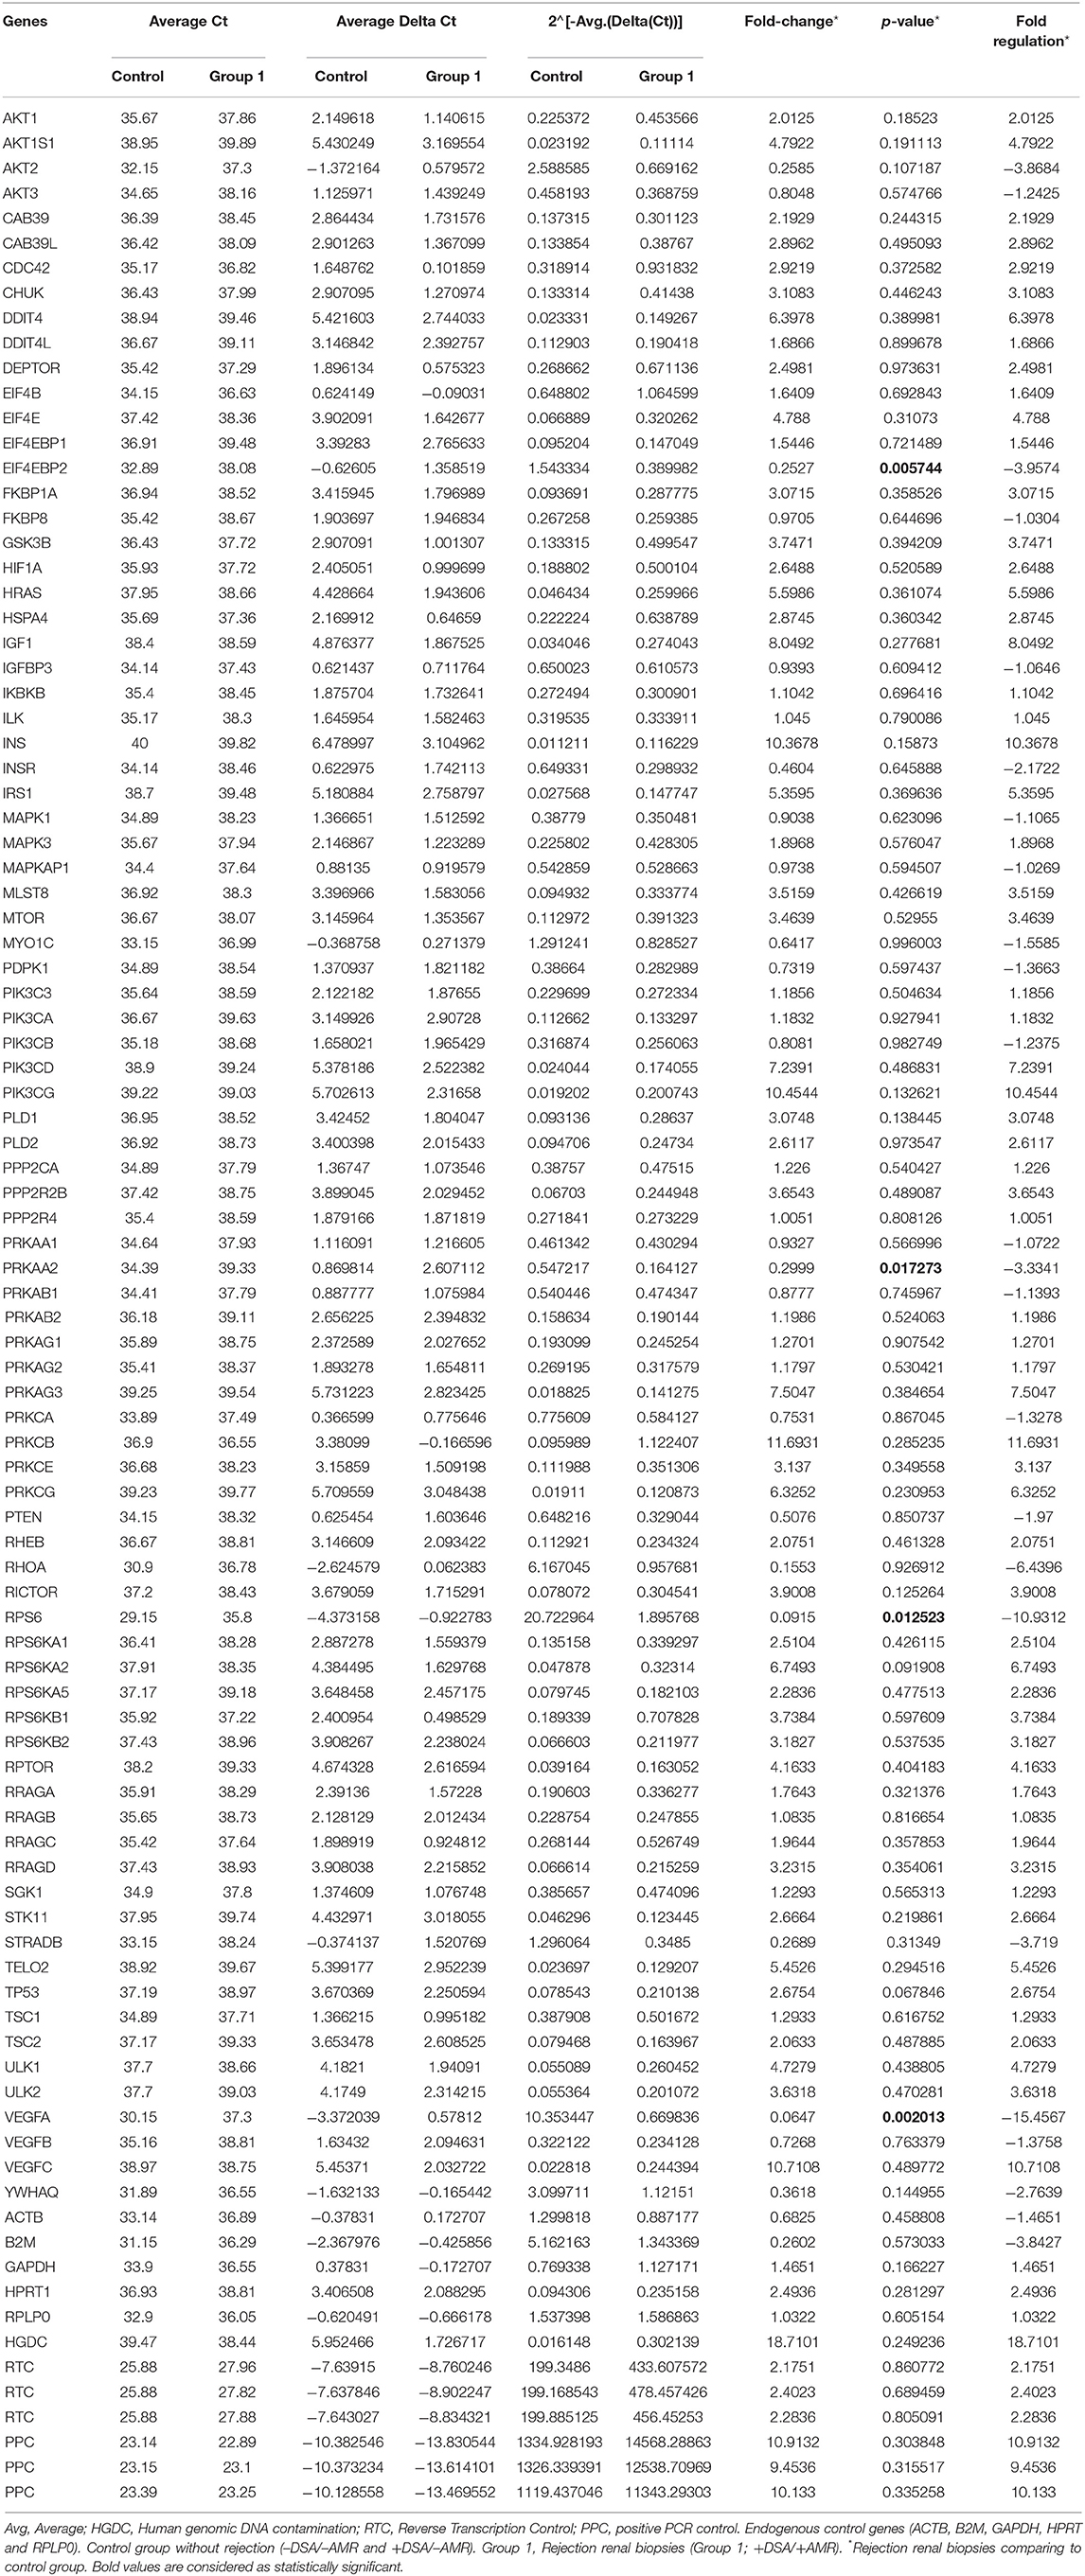
Table 3. Genetic expression of the mTOR pathway in renal biopsies of recipients without rejection used as controls and biopsies from rejected transplants.
No statistically significant differences were observed in mTOR pathway gene expression in recipients with no rejection with or without DSA (–DSA/–AMR and +DSA/–AMR; data not shown). Therefore, these biopsies were used as controls and were compared with biopsies from rejected transplants (+DSA/+AMR). A confounder analysis on gene expression levels of mTOR genes and months post-transplantation also resulted in a p-value of 0.46, demonstrating post-transplantation time was not a factor driving gene expression values.
A higher number of over-expressed genes of mTOR pathway were found in biopsies from rejected kidney transplants from +DSA/+AMR patients. In the analyzed biopsies, differential expression of the mTOR pathway related genes was detected. As shown in Figure 1, the AKT1S1, DDIT4, EIF4E, HRAS, IGF1, INS, IRS1, PIK3CD, PIK3CG, PRKAG3, PRKCB, PRKCG, RPS6KA2, RPTOR, TELO2, ULK1, VEGFC were over-expressed (≥5-fold) in +DSA/+AMR patients compared with patients with kidney transplant showing +DSA/–AMR and –DSA samples.
However, the following genes did not show significant differences with respect to the controls INS, PIK3CG, PIK3CD, PRKCG, PRKCB, VEGFC despite being over-expressed. Up-regulated mTOR pathway genes are showed in Figure 4.
Interaction Pathway Up-Regulated mTOR Genes in Rejection Kidney Biopsies
In order to find out the relationships between up-regulated genes an interaction study of all the genes analyzed was carried out. KMEANS clustering algorithm was applied to cluster proteins in the network (k = 2). Two main clusters were obtained, a major cluster (green circles) with up-regulated genes and a second minor cluster of down-regulated genes (red circles) (Figures 1, 4). The relationships between the over-expressed genes are shown in Figure 2. The main molecular functions of up-regulated genes (dark green circles) were mainly phosphotransferase activity, insulin-like grown factor receptor and ribonucleoside phosphate binding (Figure 3).
The gene encoding the PRKCB protein is a calcium-activated, phospholipid- and diacylglycerol (DAG)-dependent serine/threonine-protein kinase that is involved in various cellular processes such as B-cell receptor (BCR) signalosome control, oxidative stress-induced apoptosis, androgen-dependent transcription control, insulin signaling, and endothelial cell proliferation.
The PIK3CG gene encodes aphosphoinositide-3-kinase (PI3K) which finally generates PIP3 which plays a key role activating signaling cascades involved in cell growth, survival, proliferation, motility, and morphology. It links G-protein coupled receptor activation to PIP3 production, involved in immune, inflammatory, and allergic responses. The VEGFC gene encodes a vascular endothelial growth factor C involved in angiogenesis, and endothelial cell growth, stimulating cells proliferation, and migration and also has effects on the permeability of blood vessels. It participates in the maintenance of the differentiated lymphatic endothelial in adults and binds to and activates the KDR/VEGFR2 and FLT4/VEGFR3 receptors. Finally, INS gene encodes a protein that reduces blood glucose concentration. It enhances the permeability of cells toward monosaccharides, amino acids and fatty acids. It accelerates glycolysis, the process of pentose phosphates and the synthesis of glycogen in the kidney. Up-regulated mTOR pathway genes are showed in Figure 5.
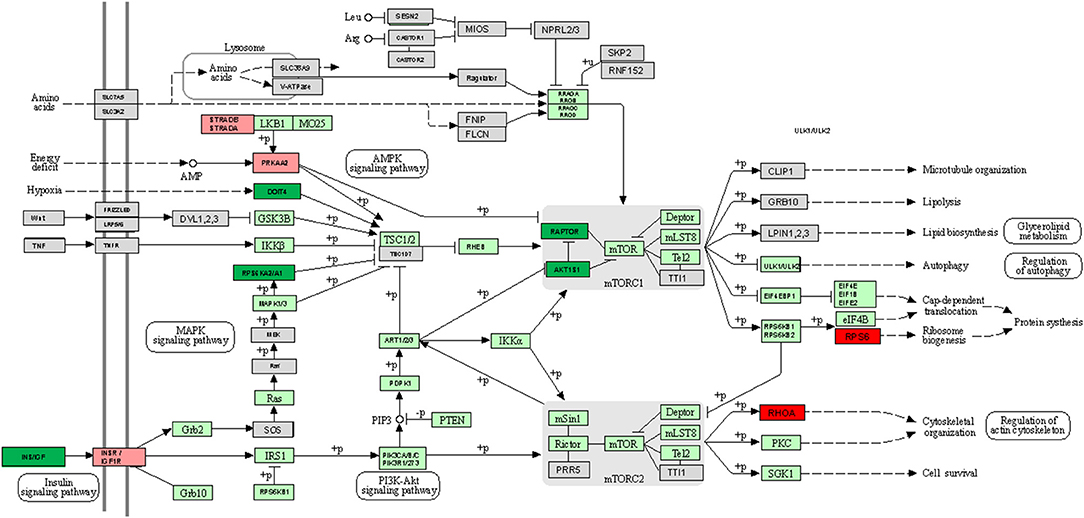
Figure 5. KEGG mTOR signaling pathway map comparing +AMR/+DSA and +DSA vs. –AMR/–DSA KT patients. Green color indicates up-regulated genes. Red color indicates down-regulated genes. The intensity of the color indicates the degree of gene regulation.
Down-Regulated mTOR Genes in Rejection Kidney Biopsies
The following mTOR pathway genes were down-regulated (≥5-fold) in +DSA/+AMR relative to kidney transplants without rejection (Table 3, Figures 1, 2, 3B). As shown in Figure 2, a total of 9 genes were under-expressed; AKT2, EIF4EBP2, INSR, PRKAA2, RHOA, RPS6, STRADB, VEGFA, and YWHAQ. Of all these genes, the VEGFA was most down-regulated one (>15-fold) and the RPS6 (>10-fold) and RHOA (≥6.5-fold).
With respect to the statistical significance compared to controls after correction, the EIF4EBP2; P < 0.005, VEGFA; P = 0.002, PRKAA2, P = 0.017, RPS6; P = 0.012 were significantly down regulated in +AMR biopsies compared with control group. This fact could indicate that the major event is the combination of DSA presence and AMR development. DSA that did not produce AMR development could not influence mTOR gene expression. Down-regulated mTOR genes pathway are shown in Figure 4.
Interaction Pathway Down-Regulated mTOR Genes in Rejection Kidney Biopsies
In the red cluster, a total of nine down-regulated genes were found. The relationships between the down-regulated genes are shown in Figure 3B. The biological activities that mainly decrease are those related to the proteins encoded by the VEGFA and RPS6 genes (dark red circles). The molecular function of down-regulated gene products (≥5-fold) was also analyzed, and they were mainly protein kinases and carbohydrate derivative binding proteins (Figure 4). The gene that encodes the VEGFA protein is a growth factor active in angiogenesis, vasculogenesis and endothelial cell growth. It induces endothelial cell proliferation, promotes cell migration, inhibits apoptosis, and induces permeabilization of blood vessels. The RPS6 encodes a serine/threonine-protein kinase that is necessary for the mitogenic or stress-induced phosphorylation of the transcription factors CREB1 and ATF1 and for the regulation of the RELA, STAT3, and ETV1/ER81 transcription factors, and that contributes to the activation of the gene by histone phosphorylation and to the regulation of inflammatory genes. A classification of mTOR complex as a function of differential expression between patients with rejection (+DSA/+AMR) and without rejection (+DSA/–AMR and –DSA/–AMR, controls) is shown in Table 4. Finally, cellular processes regulated by mTOR signaling and differential expression genes between patients with rejection (+DSA/+AMR) and without rejection (+ DSA/–AMR and –DSA, controls) are shown in Table 5.
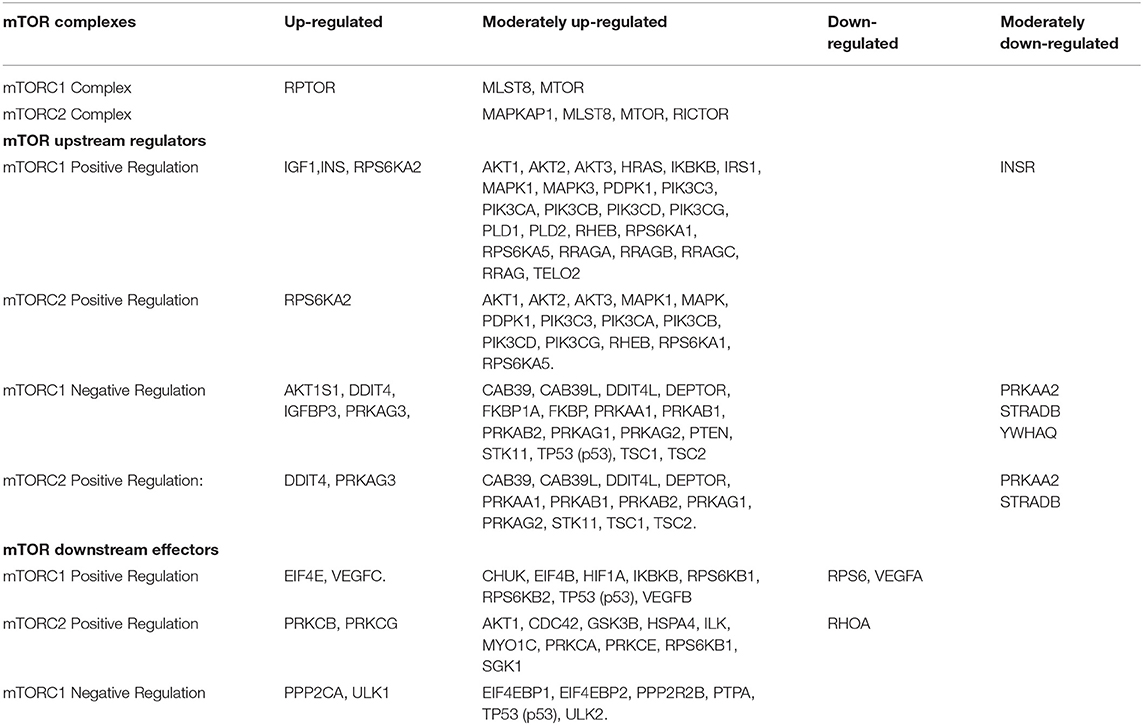
Table 4. Classification of mTOR complex as a function of differential expression between patients with rejection (+DSA/+AMR) and without rejection (+DSA/–AMR and –DSA/–AMR).
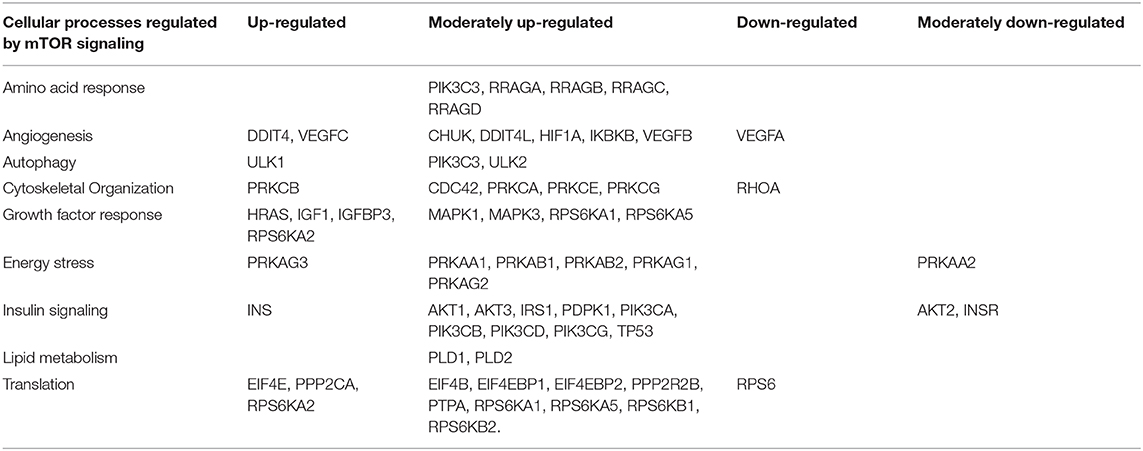
Table 5. Cellular processes regulated by mTOR signaling and differential expression genes between patients with rejection (+DSA/+AMR) and without rejection (+DSA/–AMR and –DSA/–AMR).
Discussion
In this study, we have analyzed the relationship between mTOR pathway gene expression and histological and immunological changes in humoral rejection biopsies in a large cohort of kidney recipients undergoing transplantation in order to determine if there are differences in the gene expression of the mTOR pathways between +DSA/+AMR and control recipients (–DSA/–AMR, +DSA/–AMR) and its possible influence on transplant outcome.
Genomic quantification of the overall inflammatory burden in the kidney graft seems to be important to determine the suitability of an invasive biopsy. Our results show that several particular gene expressions were increased in biopsies of +DSA/+AMR. Particularly, a higher number of over-expressed genes with mTORC1+ regulation and a number of under-expressed genes with mTORC2+ regulation in biopsies from +DSA/+AMR patients were found.
In this regard, EIF4EBP1 could have an influence on the regulation of protein translation by growth factors and other stimuli that signal through the MAP kinase and mTORC1 pathways. VEGF-A, which has been described to stimulate endothelial cell mitogenesis and cell migration, is also vasodilator and increases microvascular permeability promoting angiogenesis. PRKAA2 is activated in response to cellular metabolic stresses and RPS6 is implicated in cell size regulation and cell proliferation, and similar characteristics occurs in a situation of allograft rejection. The imbalance of gene expression in very important proteins of the mTOR pathway, showed in this study in biopsies, could inhibit mTORC2 activation promoting mTORC1, leading to fibrosis, proliferation and rejection in +DSA/+AMR patients. Thus, a higher number of over-expressed genes with mTORC1+ regulation and a number of under-expressed genes with mTORC2+ regulation in biopsies from +DSA/+AMR patients were found.
Rapamycin's mammalian target (mTOR) is a highly conserved serine/threonine protein kinase and there is much evidence that the mTOR signaling pathway plays a significant role in disease pathogenesis (20, 22, 58). However, changes in RNA levels of the PI3K-AKT-mTOR pathway have not been reported in pathology literature to date. Nevertheless, understanding the burden of inflammation, rejection or accommodation in a graft is critical for the optimization of therapy, following response to chosen interventions and as a means to predict risk stratification for progressive chronic injury and graft loss
Our tested array includes members of the mTORC1 and mTORC2 complexes as well as upstream regulators of many mTOR responses, and downstream genes from the many cellular processes regulated by mTOR complex activation. As a high number of over-expressed genes with mTORC1+ regulation and a number of under-expressed genes with mTORC2+ regulation in biopsies from +DSA/+AMR patients were found, pointing to an important role of particular gene expression of mTOR pathways in kidney rejection. The differential expression of multiple genes in the mTOR signaling pathway in AMR may be an important molecular mechanism that may lead to histological changes suffered by the recipient (59).
However, due to the various components involved in the PI3K-signaling pathway, we are currently unable to study all the components involved in the signal transduction pathway at protein level simultaneously. In this sense, it should be taken into account that when a protein is discovered to be abnormally active it could be due to co-relationships between components involved in the signal transduction pathway. Nevertheless, the PI3K-AKT Signaling PCR Array detects expression of 84 genes in the signaling pathway to obtain a detailed understanding of the molecular profile. The mTOR signaling pathway plays a significant role in immune and inflammatory reactions according to experimental findings (21), It indicates that the increased expression of inflammatory cytokines may be the result of abnormal mTOR activation. In this sense, our group has published the important role of inflammatory cytokines in kidney and liver transplant outcome (4, 48, 60, 61). Logically, a cytokine analysis and real-time correlation analysis would actually prove the association of up-regulated expression of some of mTOR pathway genes. This would pave the way to better management of the rejection episodic kidneys and these analyses will be performed in our following study.
The first generation of mTOR inhibitors do not seem to repress a negative feedback loop that results in the phosphorylation and activation of AKT, whose expression is altered in our study and only inhibits the mTORC1 pathway. These inhibitors may be important in the interpretation of the results of our study, although they are not widely used today. On the other hand, the second generation of mTOR inhibitors are known as ATP-competitive mTOR kinase inhibitors, they inhibit the kinase-dependent functions of mTORC1 and mTORC2 and thus block the feedback activation of PI3K/signaling. AKT, unlike the previous ones that only target mTORC1. Thus, the most important advantage of these second-generation inhibitors is the decrease in phosphorylation of AKT on the blockade of mTORC2 and, also, a better inhibition on mTORC1. Our data does not seem to be affected by this situation due to the same reason mentioned above. Several so-called dual mTOR/PI3K inhibitors (TPdI) have also been developed and are in early-stage preclinical trials and show promising results. Its development has benefited from previous studies with selective PI3K inhibitors. The activity of these small molecules from rapalog activity differs in the way that it blocks both the mTORC1-dependent phosphorylation of S6K1 and the mTORC2-dependent phosphorylation of the AKT Ser473 residue. These inhibitors target PI3K isoforms (p110α, β, and γ) together with the ATP binding sites of mTORC1 and mTORC2 by blocking PI3K/AKT signaling, which may be interesting to study and compare in our future studies more diversified.
Moreover, as there are no important differences in mTOR pathway gene expression in kidney recipients without DSA and with DSA, independently of AMR development, this could indicate that the major event is the particular combination of the DSA presence and AMR development and that the DSAs not producing AMR development could not influence mTOR gene expression. We must study in the future several aspects of the DSA determination as IgG subclasses, complement fixation as C1q or C3d, between others. On the other hand, mTOR pathway expressed genes extracted from peripheral blood rather than from the biopsies would be more appropriate and easier to obtain, unfortunately, we could not determine them in peripheral blood (data not shown).
One of the limitations of our study was the number of patients with kidney rejection in a total of 269 adult sequential kidney transplant (KT) patients recruited during 10 years and analyzed retrospectively. In spite of this, the expression of 84 mTOR pathway genes determined by human mTOR-PCR array technology allowed to analyzed and discriminated effectively the cases of rejection.
Other subject to discuss is whether the mTOR activation was different in various renal diseases and whether mTOR activation could predict relapse with rejection in the baseline renal biopsies of donors in the non-rejection group. This point has been revised in our present study and no special confounding factors have been found (data not shown).
Finally, these findings show the important role of mTOR pathways genes in biopsies with AMR but it is also necessary to quantify inflammation from biopsy tissue, thus providing an important tool for clinical correlation and outcome analysis of kidney transplants. Further research is needed to determine if particular gene expression profiles can prevent graft failure, which highlights the need to develop a more complete understanding of the mechanisms of allograft protection or injury.
Data Availability Statement
The original contributions presented in the study are publicly available. This data can be found here: 10.6084/m9.figshare.14020901, 10.6084/m9.figshare.14020898.
Ethics Statement
The studies involving human participants were reviewed and approved by Institutional Review Board and Ethics Committee of the University Clinical Hospital Virgen Arrixaca-Biomedical Research Institute of Murcia (IMIB), Murcia, Spain and conducted in accordance with the Declaration of Helsinki. The patients/participants provided their written informed consent to participate in this study.
Author Contributions
MM participated in designing the assays, supervising the data generation, analyzing the data, and writing the manuscript. IL, MB, and AP participated in data analysis for gene expression assays and contributed in writing the manuscript. HM-B and RA participated in tissue processing contributed in manuscript writing. VJ-C, AMr, and AMi participated in tissue processing. MM-Q and CB contributed in gene expression data generation, organization, and manuscript writing. SL and JP-M provided the study samples, participated in discussions in data analysis strategies, and manuscript writing. CB and JG were part of the study design and contributed in tissue processing and supervision HLA antibodies optimization, data analysis, and manuscript writing. All authors contributed to the article and approved the submitted version.
Funding
Our work was possible thanks to the support from Instituto de Salud Carlos III (ISCIII), Spanish Ministry of Economy and Competitiveness. Grant Nos. PI15/01370 and P19/01194 and co-funding of the European Union with European Fund of Regional Development (FEDER) with the principle of A manner to build Europe.
Conflict of Interest
The authors declare that the research was conducted in the absence of any commercial or financial relationships that could be construed as a potential conflict of interest.
References
1. Loupy A, Lefaucheur C, Vernerey D, Prugger C, Van Huyen JPD, Mooney N, et al. Complement-binding anti-HLA antibodies and kidney-allograft survival. N Engl J Med. (2013) 369:1215–26. doi: 10.1056/NEJMoa1302506
2. Wiebe C, Gibson IW, Blydt-Hansen TD, Karpinski M, Ho J, Storsley LJ, et al. Evolution and clinical pathologic correlations of de novo donor-specific HLA antibody post kidney transplant. Am J Transplant. (2012) 12:1157–67. doi: 10.1111/j.1600-6143.2012.04013.x
3. Muro M, Llorente S, Marín L, Moya-Quiles MR, Gonzalez-Soriano MJ, Prieto A, et al. Acute vascular rejection mediated by HLA antibodies in a cadaveric kidney recipient: discrepancies between flow PRA, ELISA and CDC vs. luminex screening. Nephrol Dial Transplant. (2005) 20:223–6. doi: 10.1093/ndt/gfh527
4. Muro M, Moya-Quiles MR, Mrowiec A. Humoral response in liver allograft transplantation: a review of the role of anti-human leukocyte antigen (HLA) antibodies. Curr Protein Pept Sci. (2016) 17:776–84. doi: 10.2174/1389203717666160226145101
5. Bosch A, Llorente S, Diaz JA, Salgado G, López M, Boix F, et al. Low median fluorescence intensity could be a nonsafety concept of immunologic risk evaluation in patients with shared molecular eplets in kidney transplantation. Hum Immunol. (2012) 73:522–5. doi: 10.1016/j.humimm.2012.02.020
6. Kissmeyer-Nielsen F, Olsen S, Petersen VP, Fjeldborg O. Hyperacute rejection of kidney allografts, associated with pre-existing humoral antibodies against donor cells. Lancet. (1966) 2:662–5. doi: 10.1016/S0140-6736(66)92829-7
7. Boix-Giner F, Millan O, San Segundo D, Muñoz-Cacho P, Mancebo E, Llorente S, et al. High frequency of central memory regulatory T cells allows detection of liver recipients at risk of early acute rejection within the first month after transplantation. Int Immunol. (2016) 28:55–64. doi: 10.1093/intimm/dxv048
8. Boix F, Millan O, Segundo DS, Mancebo E, Rimola A, Fabrega E, et al. High expression of CD38, CD69, CD95, and CD154 biomarkers in cultured peripheral T lymphocytes correlates with an increased risk of acute rejection in liver allograft recipients. Immunobiology. (2016) 221:595–603. doi: 10.1016/j.imbio.2016.01.008
9. Boix F, Mrowiec A, Muro M. Cytokine expression profile as predictive surrogate biomarkers for clinical events in the field of solid organ transplantation. Curr Protein Pept Sci. (2017) 18:240–9. doi: 10.2174/1389203717666160902130001
10. Muro M, Bosch A, López-Hernández R, Boix F, López M, Campillo JA, et al. Donor Specific Antibody (DSA) Mediated Humoral Rejection and Biological Implications of B Cells in Human Solid Organ Transplantation. (2012). Available online at: https://accedacris.ulpgc.es/handle/10553/54697 (accessed March 21, 2020).
11. Cai J, Terasaki PI. Humoral theory of transplantation: mechanism, prevention, and treatment. Hum Immunol. (2005) 66:334–42. doi: 10.1016/j.humimm.2005.01.021
12. Terasaki PI. Humoral theory of transplantation. Am J Transplant. (2003) 3:665–73. doi: 10.1034/j.1600-6143.2003.00135.x
13. Einecke G, Sis B, Reeve J, Mengel M, Campbell PM, Hidalgo LG, et al. Antibody-mediated microcirculation injury is the major cause of late kidney transplant failure. Am J Transplant. (2009) 9:2520–31. doi: 10.1111/j.1600-6143.2009.02799.x
14. Everly MJ, Rebellato LM, Haisch CE, Ozawa M, Parker K, Briley KP, et al. Incidence and impact of de novo donor-specific alloantibody in primary renal allografts. Transplantation. (2013) 95:410–7. doi: 10.1097/TP.0b013e31827d62e3
15. Abraham RT. PI 3-kinase related kinases: “Big” players in stress-induced signaling pathways. DNA Repair. (2004) 3:883–7. doi: 10.1016/j.dnarep.2004.04.002
16. Engelman JA, Luo J, Cantley LC. The evolution of phosphatidylinositol 3-kinases as regulators of growth and metabolism. Nat Rev Genet. (2006) 7:606–19. doi: 10.1038/nrg1879
17. Loewith R, Jacinto E, Wullschleger S, Lorberg A, Crespo JL, Bonenfant D, et al. Two TOR complexes, only one of which is rapamycin sensitive, have distinct roles in cell growth control. Mol Cell. (2002) 10:457–68. doi: 10.1016/S1097-2765(02)00636-6
18. Wong KK, Engelman JA, Cantley LC. Targeting the PI3K signaling pathway in cancer. Curr Opin Genet Dev. (2010) 20:87–90. doi: 10.1016/j.gde.2009.11.002
19. Lo YC, Lee CF, Powell JD. Insight into the role of mTOR and metabolism in T cells reveals new potential approaches to preventing graft rejection. Curr Opin Organ Transplant. (2014) 19:363–71. doi: 10.1097/MOT.0000000000000098
20. Meng X-F, Yu J-T, Song J-H, Chi S, Tan L. Role of the mTOR signaling pathway in epilepsy. J Neurol Sci. (2013) 332:4–15. doi: 10.1016/j.jns.2013.05.029
21. Weichhart T, Säemann MD. The multiple facets of mTOR in immunity. Trends Immunol. (2009) 30:218–26. doi: 10.1016/j.it.2009.02.002
22. Yasin SA, Ali AM, Tata M, Picker SR, Anderson GW, Latimer-Bowman E, et al. mTOR-dependent abnormalities in autophagy characterize human malformations of cortical development: evidence from focal cortical dysplasia and tuberous sclerosis. Acta Neuropathol. (2013) 126:207–18. doi: 10.1007/s00401-013-1135-4
23. Grimbert P, Thaunat O. mTOR inhibitors and risk of chronic antibody-mediated rejection after kidney transplantation: where are we now? Transpl Int. (2017) 30:647–57. doi: 10.1111/tri.12975
24. Grahammer F, Haenisch N, Steinhardt F, Sander L, Roerden M, Arnold F, et al. MTORC1 maintains renal tubular homeostasis and is essential in response to ischemic stress. Proc Natl Acad Sci USA. (2014) 111:E2817–26. doi: 10.1073/pnas.1402352111
25. Velagapudi C, Bhandari BS, Abboud-Werner S, Simone S, Abboud HE, Habib SL. The tuberin/mTOR pathway promotes apoptosis of tubular epithelial cells in diabetes. J Am Soc Nephrol. (2011) 22:262–73. doi: 10.1681/ASN.2010040352
26. Gödel M, Hartleben B, Herbach N, Liu S, Zschiedrich S, Lu S, et al. Role of mTOR in podocyte function and diabetic nephropathy in humans and mice. J Clin Invest. (2011) 121:2197–209. doi: 10.1172/JCI44774
27. Weide T, Huber TB. Implications of autophagy for glomerular aging and disease. Cell Tissue Res. (2011) 343:467–73. doi: 10.1007/s00441-010-1115-0
28. Shillingford JM, Murcia NS, Larson CH, Low SH, Hedgepeth R, Brown N, et al. The mTOR pathway is regulated by polycystin-1, and its inhibition reverses renal cystogenesis in polycystic kidney disease. Proc Natl Acad Sci USA. (2006) 103:5466–71. doi: 10.1073/pnas.0509694103
29. Kajiwara M, Masuda S. Role of mTOR inhibitors in kidney disease. Int J Mol Sci. (2016) 17:975. doi: 10.3390/ijms17060975
30. Weichhart T, Hengstschläger M. Regulation of Innate Immune Cell Function by mTOR. (2015). Available online at: https://www.nature.com/articles/nri3901 (accessed March 22, 2020).
31. Powell JD, Pollizzi KN, Heikamp EB, Horton MR. Regulation of immune responses by mTOR. Annu Rev Immunol. (2012) 30:39–68. doi: 10.1146/annurev-immunol-020711-075024
32. Thomson AW, Turnquist HR, Raimondi G. Immunoregulatory functions of mTOR inhibition. Nat Rev Immunol. (2009) 9:324–37. doi: 10.1038/nri2546
33. Fantus D, Thomson AW. Evolving perspectives of mTOR complexes in immunity and transplantation. Am J Transplant. (2015) 15:891–902. doi: 10.1111/ajt.13151
34. Park CO, Kupper TS. The emerging role of resident memory T cells in protective immunity and inflammatory disease. Nat Med. (2015) 21:688–97. doi: 10.1038/nm.3883
35. Rogers NM, Ferenbach DA, Isenberg JS, Thomson AW, Hughes J. Dendritic cells and macrophages i. The kidney: a spectrum of good and evil. Nat Rev Nephrol. (2014) 10:625–43. doi: 10.1038/nrneph.2014.170
36. Turner JE, Paust HJ, Steinmetz OM, Panzer U. The Th17 immune response in renal inflammation. Kidney Int. (2012) 77:1070–5. doi: 10.1038/ki.2010.102
37. Park S, Lee J-G, Jang JY, Ryu J-H, Kim DJ, Chang SJ, et al. Induction of accommodation by anti-complement component 5 antibody-based immunosuppression in ABO-incompatible heart transplantation. Transplantation. (2019) 103:e248–55. doi: 10.1097/TP.0000000000002808
38. Salama AD, Delikouras A, Pusey CD, Cook HT, Bhangal G, Lechler RI, et al. Transplant accommodation in highly sensitized patients: a potential role for Bcl-xL and alloantibody. Am J Transplant. (2001) 1:260–9. doi: 10.1034/j.1600-6143.2001.001003260.x
39. Flechner SM. mTOR inhibition & clinical transplantation: kidney. Transplantation. (2018) 102:S17–8. doi: 10.1097/TP.0000000000001692
40. Dalman MR, Deeter A, Nimishakavi G, Duan ZH. Fold-change and p-value cutoffs significantly alter microarray interpretations. BMC Bioinformat. (2012) 13(Suppl. 2):S11. doi: 10.1186/1471-2105-13-S2-S11
41. Eisen HJ, Hasni SF, Wang D. The return of the mTOR inhibitors: getting it right in patients after cardiac transplantation. J Am Coll Cardiol. (2018) 71:651–3. doi: 10.1016/j.jacc.2017.12.033
42. Sciarretta S, Forte M, Frati G, Sadoshima J. New insights into the role of mTOR signaling in the cardiovascular system. Circ Res. (2018) 122:489–505. doi: 10.1161/CIRCRESAHA.117.311147
43. Asleh R, Alnsasra H, Lerman A, Briasoulis A, Pereira NL, Edwards BS, et al. Effects of mTOR inhibitor–related proteinuria on progression of cardiac allograft vasculopathy and outcomes among heart transplant recipients. Am J Transplant. (2020) 1–11. doi: 10.1111/ajt.16155
44. Jin Y-P, Valenzuela NM, Zhang X, Rozengurt E, Reed EF. HLA class II–triggered signaling cascades cause endothelial cell proliferation and migration: relevance to antibody-mediated transplant rejection. J Immunol. (2018) 200:2372–90. doi: 10.4049/jimmunol.1701259
45. Jennings DL, Lange N, Shullo M, Latif F, Restaino S, Topkara VK, et al. Outcomes associated with mammalian target of rapamycin (mTOR) inhibitors in heart transplant recipients: a meta-analysis. Int J Cardiol. (2018) 265:71–6. doi: 10.1016/j.ijcard.2018.03.111
46. Organización Nacional de Transplantes (2017). Available online at: https://www.ont.es/infesp/memorias/memoriarenal2017_paracolgar.pdf (accessed October 18, 2020).
47. Kidney Basics. National Kidney Foundation. Available online at: https://www.kidney.org/kidney-basics (accessed March 31, 2020).
48. Boix F, Llorente S, Eguía J, Gonzalez-Martinez G, Alfaro R, Galián JA, et al. In vitro intracellular IFNγ, IL-17, and IL-10 producing T cells correlates with the occurrence of post-transplant opportunistic infection in liver and kidney recipients. World J Transplant. (2018) 8:23–37. doi: 10.5500/wjt.v8.i1.23
49. Boix F, Trujillo C, Muro M. Cell-mediated immunity (CMI) as the instrument to assess the response against the allograft: present and future. Curr Protein Pept Sci. (2018) 19:1092–106. doi: 10.2174/1389203719666180730164542
50. Legaz I, Boix F, López M, Alfaro R, Galián JA, Llorente S, et al. Influence of preformed antibodies in liver transplantation. J Clin Med. (2020) 9:708. doi: 10.3390/jcm9030708
51. Haas M, Loupy A, Lefaucheur C, Roufosse C, Glotz D, Seron D, et al. The banff 2017 kidney meeting report: revised diagnostic criteria for chronic active T cell–mediated rejection, antibody-mediated rejection, and prospects for integrative endpoints for next-generation clinical trials. Am J Transplant. (2018) 18:293–307. doi: 10.1111/ajt.14625
52. Cohen D, Colvin RB, Daha MR, Drachenberg CB, Haas M, Nickeleit V, et al. Pros and cons for C4d as a biomarker. Kidney Int. (2012) 81:628–39. doi: 10.1038/ki.2011.497
53. Muro M, González-Soriano MJ, Salgado G, López R, Boix F, López M, et al. Specific “intra-allele” and “intra-broad antigen” human leukocyte antigen alloantibodies in kidney graft transplantation. Hum Immunol. (2010) 71:857–60. doi: 10.1016/j.humimm.2010.05.018
54. Galián JA, Mrowiec A, Muro M. Molecular targets on B-cells to prevent and treat antibody-mediated rejection in organ transplantation. Present and future. Expert Opin Ther Targets. (2016) 20:859–67. doi: 10.1517/14728222.2016.1135904
55. STRING: Functional Protein Association Networks. Available online at: https://string-db.org/ (accessed March 31, 2020).
56. REVIGO Summarizes and Visualizes Long Lists of Gene Ontology Terms. Available online at: https://revigo.irb.hr/ (accessed March 31, 2020).
57. Leongómez JD. Análisis de Poder Estadístico y Cálculo de Tamaño de Muestra en R: Guía Práctica. Zenodo (2020).
58. Lee JY, Park A-K, Lee E-S, Park W-Y, Park S-H, Choi JW, et al. miRNA expression analysis in cortical dysplasia: regulation of mTOR and LIS1 pathway. Epilepsy Res. (2014) 108:433–41. doi: 10.1016/j.eplepsyres.2014.01.005
59. Le Moine A, Goldman M, Abramowicz D. Multiple pathways to allograft rejection. Transplantation. (2002) 73:1373–81. doi: 10.1097/00007890-200205150-00001
60. Millán O, Rafael-Valdivia L, San Segundo D, Boix F, Castro-Panete MJ, López-Hoyos M, et al. Should IFN-γ, IL-17, and IL-2 be considered predictive biomarkers of acute rejection in liver and kidney transplant? Results of a multicentric study. Clin Immunol. (2014) 154:141–54. doi: 10.1016/j.clim.2014.07.007
Keywords: mTOR, Gene expression, medico-legal autopsy, antibody-mediated rejection, PCR array
Citation: Legaz I, Bernardo MV, Alfaro R, Martínez-Banaclocha H, Galián JA, Jimenez-Coll V, Boix F, Mrowiec A, Salmeron D, Botella C, Parrado A, Moya-Quiles MR, Minguela A, Llorente S, Peña-Moral Jdl and Muro M (2021) PCR Array Technology in Biopsy Samples Identifies Up-Regulated mTOR Pathway Genes as Potential Rejection Biomarkers After Kidney Transplantation. Front. Med. 8:547849. doi: 10.3389/fmed.2021.547849
Received: 31 March 2020; Accepted: 27 January 2021;
Published: 17 February 2021.
Edited by:
Narinder K. Mehra, All India Institute of Medical Sciences, IndiaReviewed by:
Sunil K. Arora, Post Graduate Institute of Medical Education and Research (PGIMER), IndiaGurvinder Kaur, All India Institute of Medical Sciences, India
Copyright © 2021 Legaz, Bernardo, Alfaro, Martínez-Banaclocha, Galián, Jimenez-Coll, Boix, Mrowiec, Salmeron, Botella, Parrado, Moya-Quiles, Minguela, Llorente, Peña-Moral and Muro. This is an open-access article distributed under the terms of the Creative Commons Attribution License (CC BY). The use, distribution or reproduction in other forums is permitted, provided the original author(s) and the copyright owner(s) are credited and that the original publication in this journal is cited, in accordance with accepted academic practice. No use, distribution or reproduction is permitted which does not comply with these terms.
*Correspondence: Manuel Muro, manuel.muro@carm.es
†These authors have contributed equally to this work and the order is arbitrary