Chemerin and PEDF Are Metaflammation-Related Biomarkers of Disease Activity and Obesity in Rheumatoid Arthritis
 Barbara Tolusso1
  Maria Rita Gigante1 Stefano Alivernini1 Luca Petricca1 Anna Laura Fedele1 Clara Di Mario1 Barbara Aquilanti2 Maria Rosaria Magurano3 Gianfranco Ferraccioli1
  Elisa Gremese1*
- 1Division of Rheumatology, Fondazione Policlinico Universitario A. Gemelli, IRCCS, Catholic University of the Sacred Heart, Rome, Italy
- 2Service of Dietary and Human Nutrition, Fondazione Policlinico Universitario A. Gemelli, IRCCS, Catholic University of the Sacred Heart, Rome, Italy
- 3Service of Psychology and Psychotherapy, Fondazione Policlinico Universitario A. Gemelli, IRCCS, Catholic University of the Sacred Heart, Rome, Italy
Objective: Obesity is a risk factor for Rheumatoid Arthritis (RA) being associated to low grade inflammation. This study aimed to determine whether PEDF and Chemerin are biomarkers of inflammation related to fat accumulation in RA and to investigate whether weight loss associates with clinical disease improvement through the modification of fat-related biomarkers in overweight/obese RA with low-moderate disease.
Participants and Methods: Two-hundred and thirty RA patients were enrolled, of whom 176 at disease onset treated according to a treat-to-target strategy (T2T) and 54 overweight/obese RA in stable therapy and low-moderate disease activity. Gene expression of adipokines, interleukin-6 and their receptors were examined in adipose tissue from obese RA. Obese RA with low-moderate disease activity underwent low-calories diet aiming to Body Mass Index (BMI) reduction >5%, maintaining RA therapy unchanged. Chemerin, PEDF and Interleukin-6 plasma values were assessed by ELISA and disease activity was evaluated.
Results: At RA onset, PEDF and Chemerin plasma values correlated with BMI (p < 0.001) but only Chemerin plasma values correlated with disease activity (p < 0.001). After adopting a T2T strategy, Chemerin arose as an independent factor associated with remission in early RA [OR(95%CIs):0.49(0.25–0.97)]. Moreover, after low-calories diet, RA with low-moderate disease activity reaching BMI reduction ≥5% (62.6%) at 6 months had significant decrease of PEDF (p < 0.05) and Chemerin (p < 0.05) plasma values, in parallel with the improvement in disease activity.
Conclusions: PEDF and Chemerin arose as biomarkers of obesity and metaflammation respectively, providing a link between chronic inflammation and excess of body weight in RA. Therefore, BMI reduction of at least 5% in obese RA allowed better disease control without modifying RA treatment.
Introduction
Obesity is a risk factor for autoimmune diseases as Rheumatoid Arthritis (RA) (1–3) since adipose tissue releases adipokines able to create a low grade inflammatory environment (4–8). However, the link between obesity and RA is not fully clarified since there are no parameters available at the moment to understand the inflammation related to fat accumulation and the behavior of fat-inflammation under weight loss.
Among adipokines, pigment epithelium derived factor (PEDF) is one of the most abundant proteins secreted during adipocytes maturation directly linked to central obesity (9–12). Recently, Chemerin has emerged as a key adipokine involved in immune response. Overweight and obese healthy subjects show higher Chemerin values than normal weight, whose plasma values decrease after diet (13, 14). Despite Chemerin was found in inflamed tissues and biological fluids of RA, promoting synovial fibroblasts hyperplasia (15–17), it is not completely known whether Chemerin is associated with systemic inflammation or with adipose tissue activation in RA.
To date, there are only few data regarding the influence of body fat on RA disease activity suggesting that obesity associates with disease outcomes (18, 19). Therefore, the aims of our study were: (i) to dissect whether PEDF and Chemerin are biomarkers of obesity and fat-related inflammation (metaflammation) in RA, influencing disease activity at RA onset. Moreover, since overweight/obesity status influences the chance of good clinical outcome achievement in RA, (ii) to evaluate whether in obese RA patients with low-moderate disease activity, weight loss, mirrored by fat-related biomarkers, without RA treatment change might improve the clinical outcome.
Subjects and Methods
Participants
Study Population-1
To verify the value and role of biomarkers in deciphering the metaflammation and inflammation course, 176 consecutive early-RA (ERA) patients, fulfilling the 2010 American College of Rheumatology criteria for RA (20), were studied at disease onset. Subjects with symptoms duration < 3 months were defined as “very early RA” (VERA) (21). All ERA were naïve to conventional Disease-Modifying Anti-Rheumatic Drugs (cDMARDs) and/or biological (bDMARDs) and were followed according to the “treat-to-target strategy” (T2T) (22). For each RA patient, the ACR/European League Against Rheumatism core data set and disease activity scores (DAS/SDAI) were recorded (23).
BMI at study entry and during follow-up was recorded for each patient (24). A comparison of sex and age matched healthy group (n = 30) was enrolled.
The study was approved by the local Ethical Committee and all participants gave their signed informed consent.
Study Population-2
Fifty-four overweight/obese RA patients, with moderate disease activity (DAS < 3.7) for at least 12 weeks despite cDMARDs and/or bDMARDs treatment were enrolled. Each patient underwent a dietary intervention (1,000–1,200 kcal/day) (25) for at least 6 months under nutritionist/psychologist supervision aiming to a BMI reduction >5% within 6 months without RA therapy changes (26, 27). Since in any trial of diet induced weight loss, a mean of 15% of patients do not succeed in obtaining the 5% BMI reduction, we decided to use the unsuccessful subset of patients as an internal control group (28).
White Adipose Tissue (WAT) Biopsy and Gene Expression by qPCR in WAT
Twenty-seven of the obese RA patients underwent abdominal subcutaneous adipose tissue biopsy using an aspiration technique. Ten age and sex matched obese osteoarthritis (OA) patients were enrolled as controls.
Total RNA was isolated from adipose tissue in TRIzol® (Invitrogen, Carlsbad, CA) according to the manufacturer protocol. iScript™ cDNA Synthesis Kit (Bio Rad Laboratories, Hercules, CA) was used for cDNA preparation. FastStart Universal Probe Master (Roche Diagnostics, Germany) was used for qPCR. Primers for human RARRES2 (Chemerin), CMKLR1 (Chemerin receptor23), SERPINF1 (PEDF), IL6, IL6-R, and GAPDH, as endogenous control, were used (Roche Diagnostics, Germany). The relative expression fold change of each target gene was calculated using the comparative CT method with 2∧−ΔΔCT equation.
Chemerin, PEDF, sIL-6R, and IL-6 Plasma Values Assessment
For each enrolled RA patient, peripheral blood samples were collected, immediately processed and stored at −80°C until analysis. IL-6, sIL-6R, PEDF and Chemerin plasma values were measured by ELISA (R&D Systems, UK). The sensitivity of the test was 0.7 pg/ml for IL-6, 6.5 pg/ml for sIL-6R, 0.045 ng/ml for PEDF and 4.13 pg/ml for Chemerin.
Statistical Analysis
Statistical analysis was performed using SPSS (SPSS version 20.0, Chicago, IL, USA) and Graph-Pad Prism statistical software (San Diego, CA, USA). Categorical and quantitative variables were recorded as frequencies, percentages, mean ± Standard Deviation (SD). The non-parametric Mann-Whitney U-test and the χ2 test were used, as appropriate. The Spearman rank correlation was used to evaluate the relationship between fat-related parameters and inflammatory and clinical parameters and the Wilcoxon test was used to compare the clinical parameters and the soluble biomarkers during follow-up. A receiver operating characteristic (ROC) analysis of the adipokines related to BMI was performed.
Sample size for Study population-2 was calculated by G*Power 3.1 software (29) using as reference the successful rate of outcome achievement (BMI reduction > 5%) in the general population (27), obtaining a minimum sample size of 41 individuals with a study power of 82.2% and α = 0.04.
A multivariate logistic regression model, in which “DAS or SDAI remission at 6 or 12 month follow-up visit” were the dependent variables to be explained, was performed and results were expressed as the odds ratio (OR) and 95% confidence interval (95%CI). Statistical significance was defined as p < 0.05.
Results
Overweight and Obesity Status, Mirrored by Adipokines Milieu, is Related to Disease Activity of RA Patients at Onset
To dissect the contribution of fat mass on clinical phenotype at RA onset, 176 ERA patients were enrolled as investigational cohort (Study population-1). Baseline demographic and clinical characteristics are shown in Table 1. Overweight and obese ERA patients showed higher disease activity than normal weight ones (Table 1) (Figure 1A) (Supplemental Table 1).
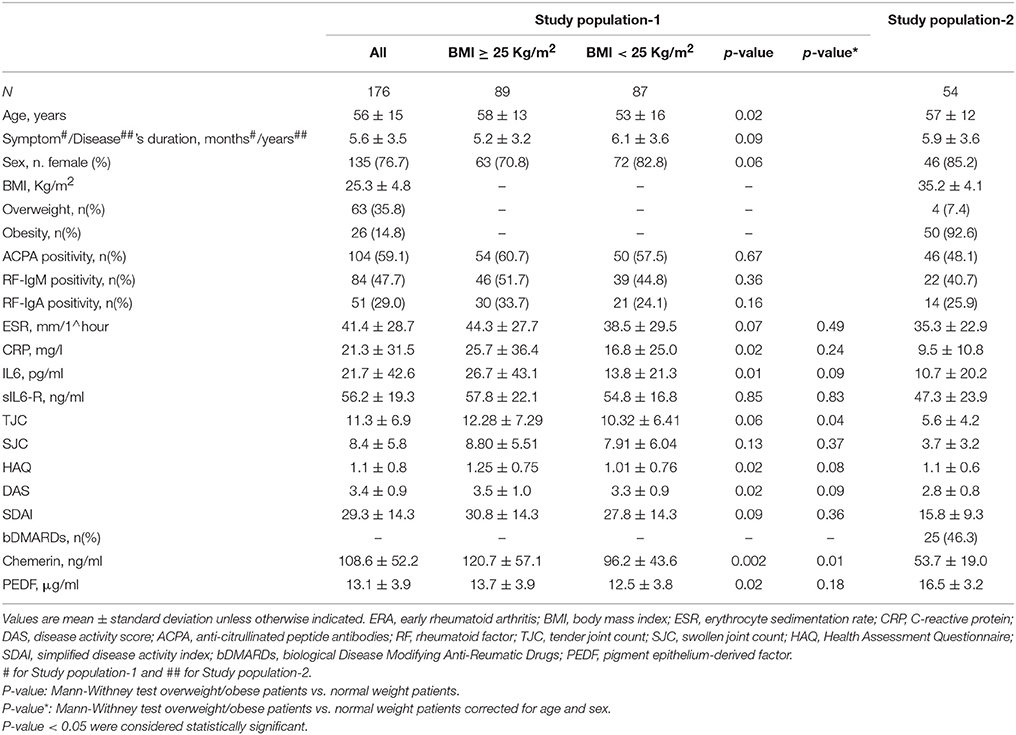
Table 1. Demographic, immunological and clinical characteristics of Study populations 1 and 2.
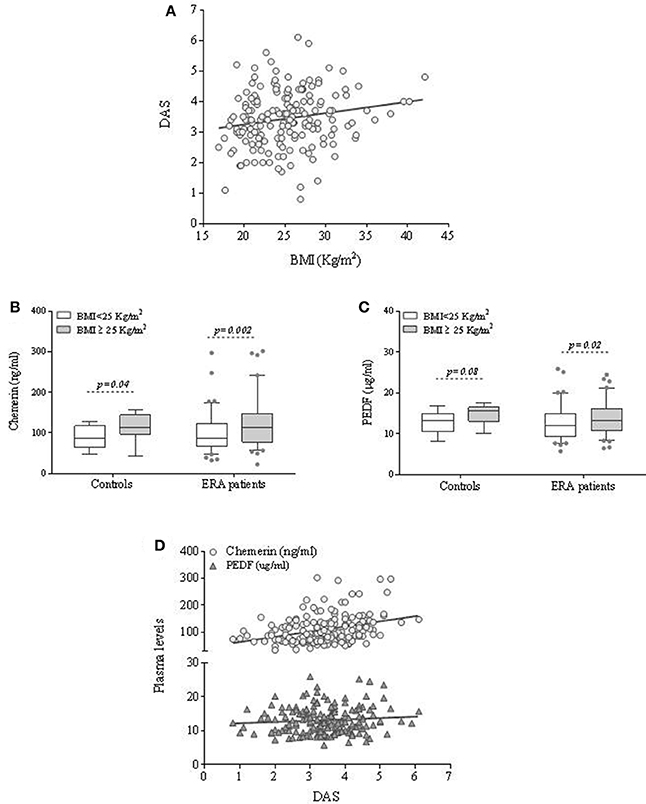
Figure 1. Body mass index, PEDF and Chemerin plasma values are reciprocally related and associated to disease activity in ERA patients at disease onset. (A) Correlation between disease activity and BMI in ERA patients at baseline. (B,C) Plasma adipokines (PEDF and Chemerin) values in ERA patients at diagnosis and controls based on the BMI category. (D) Correlation between disease activity and PEDF and Chemerin plasma values in ERA patients at baseline.
Moreover, to investigate whether specific molecules related to adipose tissue excess are associated with the inflammatory burden of RA, PEDF, and Chemerin plasma values were assessed in RA patients at disease onset compared to healthy subjects stratified by BMI category [30 healthy individuals, among whom 70% female, with a mean age of 50.0 years (SD = 9.6) and 12 (40.0%) overweight or obese].
PEDF and Chemerin plasma values were similar in ERA patients at diagnosis (PEDF: 13.1 ± 3.9 μg/ml, Chemerin: 108.6 ± 52.2 ng/ml) and controls (PEDF: 13.7 ± 2.4 μg/ml; p = ns; Chemerin: 95.2 ± 34.1 ng/ml; p = ns), while IL-6 plasma values were significantly higher in ERA patients than in controls (20.3 ± 34.5 pg/ml vs. 1.6 ± 3.8 pg/ml; p < 0.001). No significant difference was found between the sIL-6R plasma values at study entry comparing RA patients and controls (p = 0.34). Moreover, in ERA cohort, PEDF and Chemerin values directly correlated with age at the time of diagnosis (Supplemental Table 1).
However, higher plasma values of PEDF and Chemerin were observed in overweight/obese individuals than in normal weight ones (Figures 1B,C) and this difference remained significant only for Chemerin after age and sex adjustment (p = 0.01) (Table 1). Moreover, overweight/obese ERA patients showed higher IL-6 plasma values (26.8 ± 43.1 pg/ml) compared to normal weight (13.8 ± 21.3 pg/ml; p = 0.01) at baseline directly correlating with Chemerin plasma values (R = 0.25; p = 0.003). Considering sIL-6R in ERA cohort, overweight/obese ERA patients did not differ from normal weight ones at baseline (p = 0.85) with no significant correlation with Chemerin plasma values (R = −0.14; p = 0.36) at disease onset.
These data were confirmed by the positive correlation between PEDF, Chemerin and IL-6 plasma values and BMI (Supplemental Figure 1) (Supplemental Table 1). Optimal Chemerin cut-off value associated with BMI ≥ 25 Kg/m2 was 95.7 ng/ml with sensitivity and specificity of 60.0 and 60.9%, respectively. Optimal PEDF cut-off value associated with a BMI ≥ 25 Kg/m2 was 13.3 ug/ml with a sensitivity and specificity of 50.3 and 63.2%, respectively (Supplemental Figure 2).
Chemerin but not PEDF Plasma Values are Independently Associated With Baseline Disease Activity in ERA Patients
In ERA patients (Study population-1), Chemerin but not PEDF plasma values positively correlated with disease activity scores (DAS: R = 0.33; p < 0.001; SDAI: R = 0.30; p < 0.001) and disability index (HAQ: R = 0.21; p = 0.01) (Supplemental Table 1 and Figure 1D).
In particular, ERA patients with Chemerin plasma values ≥ 95.7 ng/ml had more likely a moderate-high disease activity (46.6%) compared to RA patients with Chemerin plasma values < 95.7 ng/ml (27.6%; p = 0.01). On the contrary, no significant association was observed between PEDF plasma values and disease activity at diagnosis.
Chemerin but not PEDF Plasma Levels Values are Independently Associated With Clinical Outcome in ERA Patients Treated According to Treat to Target Strategy
In the whole ERA cohort (Study population-1), DAS remission was achieved by 40.7 and 50.4% after 6 and 12 months follow-up, respectively, and SDAI remission status by 29.1% at 6 and 35.7% at 12 months follow-up, respectively. Overweight/obesity per se was not influencing remission achievement (Table 2). However, a higher and faster remission rate was reached by RA patients having Chemerin plasma levels < 95.7 ng/ml at baseline (Figures 2A,B), despite similar bDMARDs usage (Table 2), in addition to being VERA or having a high disease activity at the time of diagnosis (Table 2). On the contrary, high PEDF plasma levels values didn't influence treatment response (Table 2). The logistic regression analysis confirmed the independent association between therapy response at 12 months and Chemerin plasma values at baseline [OR(95%CIs):0.49(0.25–0.97)], together with being VERA [OR(95%CIs):2.05(1.00–4.23)], suggesting that low Chemerin plasma values is a predictor of remission (Table 2). This association was observed also using a stricter remission parameter as SDAI (28.6% of SDAI remission in ERA patients having Chemerin plasma values ≥95.7 ng/ml vs. 42.4% of SDAI remission in ERA patients having Chemerin plasma values < 95.7 ng/ml; p = 0.10). These findings suggest that a low Chemerin plasma values is a positive predictor of remission achievement in RA.
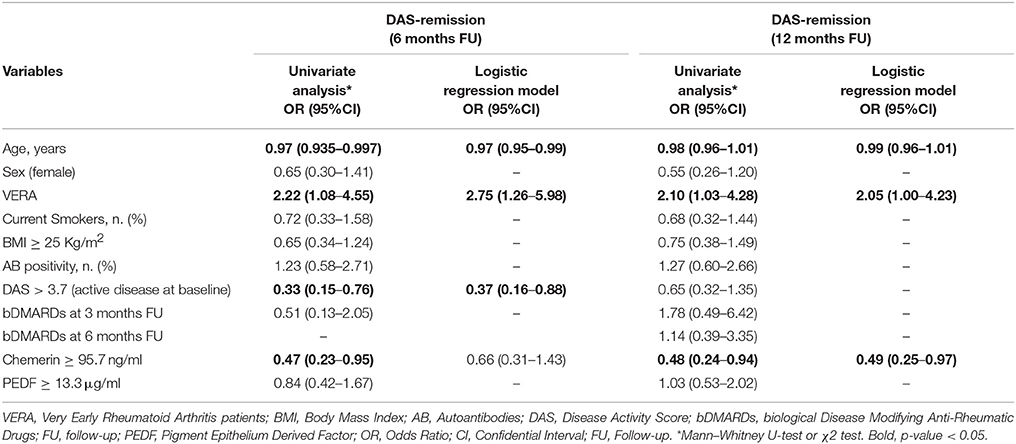
Table 2. Logistic regression analysis showing factors independently associated with DAS-remission (DAS < 1.6) at 6 and 12 months of follow-up in a cohort of ERA patients treated according to the T2T strategy.
Figure 2. Association between chemerin plasma values and response to therapy over time in ERA patients treated according to a treat-to-target (T2T) strategy. (A) Association between Chemerin plasma values and percentage of remission (DAS < 1.6) at 3, 6, and 12 months of T2T treatment. (B) Kaplan-Meier survival curve in ERA patients achieving remission over 1 year stratified for the baseline Chemerin plasma values cut-off point (Log Rank test: χ2:8.72; p = 0.003; Breaslow-Wilcoxon text: χ2:7.24; p = 0.01). (C) Chemerin plasma values at baseline and during treat to target protocol (at 6 and 12 months) in ERA patients; *p < 0.05 vs. baseline in ERA patients with BMI ≥ 25 Kg/m2, §p < 0.05 vs. baseline in ERA patients with BMI < 25 Kg/m2; #p < 0.05 for difference at different time points between BMI ≥ 25 Kg/m2 and BMI < 25 Kg/m2. (D) Correlation between changes in Chemerin plasma values, BMI at baseline and disease activity; Delta, (value at baseline - value at 12 months); Fold change, Delta/(value at baseline).
As previously stated, a significant disease activity reduction at 6 and 12 months was observed in both normal weight and overweight-obese ERA patients. Similarly, Chemerin plasma values significantly decreased over time reaching comparable levels already after 6 months in overweight/obese and normal weight RA patients, showing a higher rate of Chemerin plasma values reduction in overweight/obese compared to normal weight ERA patients (Figure 2C). On the contrary, PEDF plasma values remained unchanged during the follow-up (data not shown). The entity of Chemerin plasma values reduction was found tightly related to the initial BMI (R = 0.26; p = 0.02) and directly correlated with the DAS value reduction (R = 0.24; p = 0.03) in ERA patients (Figure 2D). Furthermore, this finding was confirmed by the direct correlation between Chemerin plasma values reduction and the delta SDAI (R = 0.28; p = 0.02). Therefore, in ERA patients changes of Chemerin plasma values but not of PEDF, throughout the T2T treatment, is associated with baseline BMI and mirrors the reduction of disease activity despite stable body weight.
Adipose Tissue of Obese RA Patients Shows Different Expression of Adipokines, IL-6 and Their Receptors Based on Disease Activity
To reveal whether WAT of patients with RA shows different gene expression profile based on disease itself and/or fat-related inflammation, we investigated the quantitative expression of RARRES2, CMKLR1, SERPINF1, IL6, and IL6-R in WAT of obese RA (BMI: 35.5 ± 4.1 Kg/m2) and OA (BMI: 34.8 ± 3.2).
In particular, we found that SERPINF1 was highly expressed in WAT of RA (2.7 ± 1.6 fold change) than OA patients (1.5 ± 1.2 fold change; p = 0.03), mainly in RA with moderate disease activity (MDA) (Figure 3A). No differences were seen for RARRES2 and IL6 expression in WAT between the whole obese RA and OA cohorts. However, stratifying patients based on the disease activity, WAT from MDA RA showed higher IL6 expression compared to RA patients with low disease activity (LDA) (Figure 3A). Increased expression of CMKLR1 was observed in WAT of obese RA (7.2 ± 12.1 fold change) compared to OA (2.3 ± 3.7 fold change; p = 0.02), particularly in MDA RA (7.4 ± 12.1; p = 0.04) (Figure 3B). Finally, no correlation was found between adipokines and their receptors expression in WAT and Chemerin, PEDF or IL6 plasma values or disease activity (i.e., DAS) in obese RA patients (data not shown).
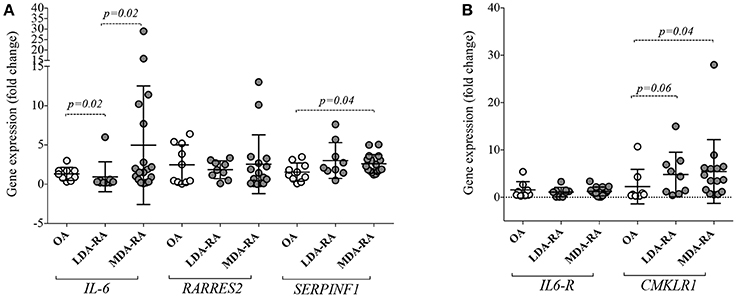
Figure 3. Chemerin, PEDF, IL6 and their receptors expression in White Adipose Tissue (WAT) of obese RA patients with low-moderate disease activity and in obese OA. (A) IL6, RARRES2, and SERPINF1 expression and (B) CMKLR1 and IL6-R were determined in abdominal WAT from obese RA (n = 27) and obese OA (n = 10). Levels of target genes mRNA expression were determined, after normalization with GAPDH values, using the 2−ΔΔCT method. Horizontal lines indicate mean values with SD. RA, Rheumatoid Arthritis; OA, Osteoarthritis; LDA, Low disease activity (1.6 < DAS < 2.4); MDA, Moderate disease activity (2.4 < DAS < 3.7); IL6, Interleukin 6; RARRES2, retinoic acid receptor responder protein 2; CMKLR1, Chemokine like receptor 1; IL6-R, interleukin-6 receptor.
Weight Loss Induces Chemerin and PEDF Plasma Values Reduction, Influencing the Remission Achievement in Overweight/Obese RA Patients
We enrolled 54 overweight/obese RA patients with low-moderate disease activity, despite a treat to target strategy treatment, undergoing low calories diet for at least 6 months (Study population-2) (Table 1). During the follow-up, the mean BMI reduction was 2.5 ± 1.8 Kg/m2 (corresponding to 7.4 ± 5.7% of initial BMI) at 6 months and 3.1 ± 2.4 Kg/m2 (corresponding to 8.9 ± 6.8% of initial BMI) at 12 months of diet, respectively. However, 7 (13.0%) RA patients did not show any change in BMI during the follow-up.
To clarify whether weight loss was directly associated with adipokines modulation in RA patients, Chemerin and PEDF plasma values were tested at baseline and after a low-calories diet (Study population-2). A significant reduction of Chemerin and PEDF plasma values was observed since the 6TH month of low-calories diet, in patients achieving ≥5% BMI reduction (Figures 4A,B). Moreover, a direct correlation between the BMI fold change (baseline/6 months) and Chemerin plasma values fold change was found (R = 0.30; p = 0.04) (Figure 4C), whereas there was no correlation with PEDF plasma values fold change. Finally, RA patients achieving a decrease of BMI ≥ 5% at 6 months showed a significant reduction of sIL-6R plasma values at 12 months follow-up (47.9 ng/ml at baseline vs. 40.4 ng/ml at 12 months follow-up; Wilcoxon test: p = 0.04), not observed in RA patients with BMI reduction < 5% during the same follow-up period (p = 0.10). IL-6 plasma values were similar in the two subgroups (data not shown).
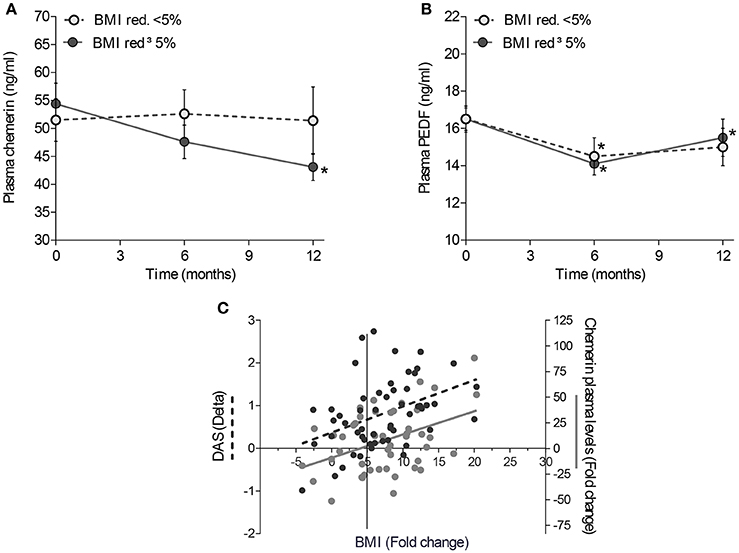
Figure 4. Effect of weight loss on Chemerin and PEDF plasma values. Mean changes in Chemerin (A) and PEDF (B) plasma values from baseline in overweight/obese RA patients with a low-moderate disease activity undergoing scheduled dietetic regimen aiming at BMI reduction. RA patients were divided based on the percentage of reduction of BMI (< or ≥ 5%); *: p ≤ 0.05. (C) Correlation between changes in BMI, plasma values of Chemerin and disease activity; Delta, (value at baseline - value at 6 months); Fold change, Delta/(value at baseline).
RA patients with low-moderate disease activity (Study population-2) reducing ≥5% the baseline BMI after 6 months, showed a significant reduction of disease activity after 6 and 12 months, without any pharmacological change (Supplemental Figure 3):34 RA patients reaching ≥5% BMI reduction after 6 months and 19 with ≥10% BMI reduction after 12 months, obtained higher DAS remission rates than patients with a less significant BMI reduction. In addition, 39.4% of RA patients experiencing BMI decrease ≥5% achieved DAS remission at 6 months follow-up compared to 10.0% of RA patients achieving BMI decrease < 5% (p = 0.02), whereas 55.6% RA patients experiencing BMI decrease ≥10% achieved DAS remission at 12 months follow-up compared to 15.0% of RA patients achieving BMI decrease < 10% (p = 0.01). The effect of weight reduction on disease activity was already seen at 6 months, as confirmed by the positive correlation between the BMI fold change (baseline/6 months) and delta DAS (R = 0.45; p = 0.001) as well as delta SDAI (R = 0.49; p < 0.001).
Discussion
Over the last years, understanding the importance of overweight and obesity during RA disease course, from the disease onset through its progression and outcome has increased and improved. To date, adipose tissue arose as a dynamic endocrine organ that releases bioactive substances secreted by adipocytes and adipose tissue resident macrophages shared with chronic inflammatory diseases as RA (30). Most of these molecules show pro-inflammatory properties accounting for a low-grade systemic inflammation. Among them, Chemerin appears to be a crucial inflammatory mediator in RA, correlating with disease activity rather than obesity (17, 31) whereas PEDF plays a role in the promotion of inflammation (9, 12).
Our data show that Chemerin plasma values positively correlate with BMI and disease activity in RA patients at diagnosis. Moreover, a low calories Mediterranean diet induces weight loss in an important percentage of overweight/obese RA patients, increasing the number of patients achieving disease remission. In fact, we observed, for the first time, that a significant percentage of RA patients with low-moderate disease activity can be led to clinical remission without any treatment change by loosing at least 5% of baseline BMI which is a commonly recommended therapeutic target for obese people leading to profound health benefits (28, 32). In particular, effective dietary intervention significantly affects direct and indirect adipose tissue-related inflammatory markers, as Chemerin and sIL-6R respectively, possibly by positively reducing the recruitment of adipose tissue macrophages as the underlying features of meta-inflammation (33, 34). These data underline the importance of fat-derived inflammatory mediators on disease activity in obese RA patients.
Since the direct link between high BMI and disease activity at RA onset is still a matter of debate, we investigated the clinical features of RA patients at disease onset stratified according to their BMI category. Interestingly, we found that, at disease onset, overweight/obese RA patients had higher disease activity compared to normal weight ones. Moreover, analyzing the influence of body weight excess in terms of adipose tissue derived inflammatory markers on the remission rate achievement in ERA patients treated with the T2T scheme, high Chemerin plasma values at diagnosis were negatively associated to the achievement of good disease control after the T2T scheme. The impact of obesity on clinical outcome was previously investigated in long standing RA (8) despite the controversial indirect link between obesity and bone erosiveness (18, 35, 36). Considering adipose tissue derived adipokines, Ha et al previously found an indirect correlation between BMI and Chemerin plasma values evaluated in a limited RA cohort, stating that Chemerin plasma values could be associated with systemic inflammation rather than obesity in RA. However, this latter cohort was made of already treated patients with long standing disease and no data were reported about Chemerin plasma values at disease onset (17). It should be considered that, in the general population, Chemerin plasma values directly correlate not only with the obesity status, in terms of BMI category, total body fat percentage, waist circumference and total lipids asset but even with multiple markers of chronic inflammation (i.e., CRP, SAA, IL-6, and sTNFRII) suggesting that it may induce extensive inflammatory processes in various chronic inflammatory disorders (37).
In our ERA cohort, a significant association between Chemerin and PEDF plasma values and parameters of systemic inflammation was found at the time of diagnosis, even though only Chemerin plasma values positively correlated with disease activity. These data mirror cytokines' behavior, as IL-6, which is a crucial player in the inflammatory cascade at the earliest stages of RA (38), suggesting that Chemerin may play a role in RA, mainly in patients with high BMI. Interestingly in our study, higher Chemerin plasma values at disease onset, but not the overweight-obesity status nor higher PEDF plasma values, was associated with remission achievement, identifying Chemerin as a biomarker of metaflammation and as a modifiable risk factor associated with RA treatment response (16, 39).
In animal models, it is well documented that high-fat diet induces a low-grade chronic inflammation called metaflammation (40) leading to the production of pro-inflammatory cytokines as IL-1, IL-6, and Tumor Necrosis Factor (41–43), all over-expressed at the early phases of RA (38). These pro-inflammatory cytokines affect synovial and adipose tissues causing inflammation that promotes the recruitment and activation of immune cells within these target tissues and the amplification of the inflammatory loop in RA (44, 45). Based on this, we investigated the gene profile of IL-6, Chemerin/ChemR23 and PEDF in abdominal adipose tissue derived from obese RA patients, finding a higher expression of IL-6, ChemR23, and PEDF in WAT of obese RA patients with MDA than in obese OA. These findings suggest that the gene expression profile of pro-inflammatory mediators in WAT is tightly related to the inflammatory status mirroring the disease activity phases in obese RA. Moreover, studies on animal models revealed that obesity influences the degree of inflammation in another biological compartment involved in RA pathogenesis, as synovial tissue, which seems to be affected by high fat diet mainly at the earliest disease phases in terms of synovial hyperplasia and inflammatory cells infiltrates with no significant differences between obese and lean animals after disease establishment (46).
In conclusion, PEDF and Chemerin can be biomarkers of obesity and metaflammation in RA patients respectively. In particular, Chemerin seems to be linked to RA disease activity and treatment response, supporting its dual role in mirroring inflammation and metabolism and providing a link between chronic inflammation and obesity. Based on that, a BMI reduction of at least 5%, mirrored by Chemerin modulation, allows the achievement of a better disease control without changing RA treatment.
Author Contributions
BT, GF, and EG conceived the study. MRG, SA, LP, ALF, BA, and MRM collected clinical data. BT, MRG, SA, LP, and CD performed experiments. BT, MRG, SA, and LP performed statistical analysis. BT, MRG, SA, LP, ALF, GF, and EG drafted and revised the manuscript. All authors read and approved the final manuscript.
Conflict of Interest Statement
The authors declare that the research was conducted in the absence of any commercial or financial relationships that could be construed as a potential conflict of interest.
Supplementary Material
The Supplementary Material for this article can be found online at: https://www.frontiersin.org/articles/10.3389/fmed.2018.00207/full#supplementary-material
References
1. Swinburn BA, Sacks G, Hall KD, McPherson K, Finegood DT, Moodie ML, et al. The global obesity pandemic: shaped by global drivers and local environments. Lancet (2011) 378:804–14. doi: 10.1016/S0140-6736(11)60813-1
2. Tolusso B, Alivernini S, Gigante MR, Ferraccioli G, Gremese E. Biomolecular features of inflammation in obese rheumatoid arthritis patients: management considerations. Exp Rev Clin Immunol. (2016) 22:1–12. doi: 10.1586/1744666X.2016.1159132
3. Qin B, Yang M, Fu H, Ma N, Wei T, Tang Q, et al. Body mass index and the risk of rheumatoid arthritis: a systematic review and dose-response meta-analysis. Arth Res Ther. (2015) 17:86–98. doi: 10.1186/s13075-015-0601-x
4. Naranjo A, Sokka T, Descalzo MA, Calvo-Alén J, Hørslev-Petersen K, Luukkainen RK, et al. Cardiovascular disease in patients with rheumatoid arthritis: results from the QUEST-RA study. Arthritis Res Ther. (2008) 10:R30. doi: 10.1186/ar2383
5. Hauner H. Secretory factors from human adipose tissue and their functional role. Proc Nutr Soc. (2005) 64:163–9.
6. Moreno-Indias I, Oliva-Olivera W, Omiste A, Castellano-Castillo D, Lhamyani S, Camargo A, et al. Adipose tissue infiltration in normal-weight subjects and its impact on metabolic function. Transl Res. (2016) 172:6–17. doi: 10.1016/j.trsl.2016.01.002
7. Klaasen R, Wijbrandts CA, Gerlag DM, Tak PP. Body mass index and clinical response to infliximab in rheumatoid arthritis. Arthritis Rheumatol. (2011) 63:359–64. doi: 10.1002/art.30136
8. Gremese E, Carletto A, Padovan M, Atzeni F, Raffeiner B, Giardina AR, et al. Obesity and reduction of the response rate to anti-tumor necrosis factor alpha in rheumatoid arthritis: an approach to personalized medicine. Arthritis Care Res. (2013) 65:94–100. doi: 10.1002/acr.21768
9. Famulla S, Lamers D, Hartwig S, Passlack W, Horrighs A, Cramer A, et al. Pigment epithelium-derived factor (PEDF) is one of the most abundant proteins secreted by human adipocytes and induces insulin resistance and inflammatory signaling in muscle and fat cells. Int J Obes. (2011) 35:762–72. doi: 10.1038/ijo.2010.212
10. Sabater M, Moreno-Navarrete JM, Ortega FJ, Pardo G, Salvador J, Ricart W, et al. Circulating pigment epithelium-derived factor levels are associated with insulin resistance and decrease after weight loss. Clin Endocrinol Metab. (2010) 95:4720–8. doi: 10.1210/jc.2010-0630
11. Wang P, Smit E, Brouwers MC, Goossens GH, van der Kallen CJ, van Greevenbroek MM, et al. Plasma pigment epithelium-derived factor is positively associated with obesity in Caucasian subjects, in particular with the visceral fat depot. Eur J Endocrinol. (2008) 159:713–8. doi: 10.1530/EJE-08-0521
12. Chavan SS, Hudson LK, Li JH, Ochani M, Harris Y, Patel NB, et al. Identification of pigment epithelium-derived factor as an adipocyte-derived inflammatory factor. Mol Med. (2012) 18:1161–8. doi: 10.2119/molmed.2012.00156
13. Bozaoglu K, Bolton K, McMillan J, Zimmet P, Jowett J, Collier G, et al. Chemerin is a novel adipokine associated with obesity and metabolic syndrome. Endocrinology (2007) 148:4687–94. doi: 10.1210/en.2007-0175
14. Sell H, Divoux A, Poitou C, Basdevant A, Bouillot JL, Bedossa P, Tordjman J, et al. Chemerin correlates with markers for fatty liver in morbidly obese patients and strongly decreases after weight loss induced by bariatric surgery. J Clin Endocrinol Metab. (2010) 95:2892–6. doi: 10.1210/jc.2009-2374
15. Eisinger K, Bauer S, Schäffler A, Walter R, Neumann E, Buechler C, et al. Chemerin induces CCL2 and TLR4 in synovial fibroblasts of patients with rheumatoid arthritis and osteoarthritis. Exp Mol Pathol. (2012) 92:90–6. doi: 10.1016/j.yexmp.2011.10.006
16. Kaneko K, Miyabe Y, Takayasu A, Fukuda S, Miyabe C, Ebisawa M, et al. Chemerin activates fibroblast-like synoviocytes in patients with rheumatoid arthritis. Arthritis Res Ther. (2011) 13:R158. doi: 10.1186/ar3475
17. Ha YJ, Kang EJ, Song JS, Park YB, Lee SK, Choi ST. Plasma chemerin levels in rheumatoid arthritis are correlated with disease activity rather than obesity. Joint Bone Spine (2013) 81:189–90. doi: 10.1016/j.jbspin.2013.07.013
18. Liu Y, Hazlewood GS, Kaplan GG, Eksteen B, Barnabe C. Impact of obesity on remission and disease activity in rheumatoid arthritis: a systematic review and meta-analysis. Arthr Care Res. (2017) 69:157–165. doi: 10.1002/acr.22932
19. Nikiphorou E, Norton S, Young A, Dixey J, Walsh D, Helliwell H, et al. The association of obesity with disease activity, functional ability and quality of life in early rheumatoid arthritis: data from the Early Rheumatoid Arthritis Study/Early Rheumatoid Arthritis Network UK prospective cohorts. Rheumatology (2018) 57:1194–202. doi: 10.1093/rheumatology/key066
20. Aletaha D, Neogi T, Silman AJ, Funovits J, Felson DT, Bingham CO 3rd, et al. 2010 Rheumatoid arthritis classification criteria: an American College of Rheumatology/European League Against Rheumatism collaborative initiative. Arthritis Rheumatol. (2010) 62:2569–81. doi: 10.1002/art.27584
21. Gremese E, Salaffi F, Bosello SL, Ciapetti A, Bobbio-Pallavicini F, Caporali R, et al. Very early rheumatoid arthritis as a predictor of remission: a multicentre real life prospective study. Ann Rheum Dis. (2013) 72:858–62. doi: 10.1136/annrheumdis-2012-201456
22. Smolen JS, Breedveld FC, Burmester GR, Bykerk V, Dougados M, Emery P, et al. Treating rheumatoid arthritis to target: 2014 update of the recommendations of an international task force. Ann Rheum Dis. (2016) 75:3–15. doi: 10.1136/annrheumdis-2015-207524
23. van Gestel AM, Prevoo ML, van 't, Hof MA, van Rijswijk MH, van de Putte LB, van Riel PL. Development and validation of the European League Against Rheumatism response criteria for rheumatoid arthritis. Comparison with the preliminary American College of Rheumatology and the World Health Organization/International League Against Rheumatism Criteria. Arthritis Rheumatol. (1996) 39:34–40.
24. Global Database on Body Mass Index,. BMI Classification. (2013). Available online at: http://apps.who.int/bmi/index.jsp?introPage=intro_3.html
25. Shai I, Schwarzfuchs D, Henkin Y, Shahar DR, Witkow S, Greenberg I, et al. Weight loss with a low-carbohydrate, Mediterranean, or low-fat diet. N Engl J Med. (2008) 359:229–41. doi: 10.1056/NEJMoa0708681
26. Williams RL, Wood LG, Collins CE, Callister R. Effectiveness of weight loss interventions-is there a difference between men and women: a systematic review. Obes Rev. (2015) 16:171–86. doi: 10.1111/obr.12241
27. Cawley J, Meyerhoefer C, Biener A, Hammer M, Wintfeld N. Savings in medical expenditures associated with reductions in Body Mass Index among US adults with obesity, by diabetes status. Pharmacoeconomics (2015) 33:707–22. doi: 10.1007/s40273-014-0230-2
28. Williamson DF, Serdula MK, Anda RF, Levy A, Byers T. Weight loss attempts in adults: goals, duration, and rate of weight loss. Am J Public Health (1992) 82:1251–1257.
29. Faul F, Erdfelder E, Lang AG, Buchner A. G*Power 3: a flexible statistical power analysis program for the social behavioral and biomedical sciences. Behav Res Methods (2007) 39:175–191.
30. Gremese E, Ferraccioli G. The metabolic syndrome: the crossroads between rheumatoid arthritis and cardiovascular risk. Autoimmun Rev. (2011) 10:582–589. doi: 10.1016/j.autrev.2011.04.018
31. Iannone F, Lapadula G. Chemerin/ChemR23 pathway: a system beyond chemokines. Arthritis Res Ther. (2011) 13:104. doi: 10.1186/ar3273
32. Jensen MD, Ryan DH, Apovian CM, Comuzzie AG, Donato KA, Hu FB, et al. 2013 AHA/ACC/TOS guideline for the management of overweight and obesity in adults: a report of the American College of Cardiology/American Heart Association Task Force on Practice Guidelines and The Obesity Society. J Am Coll Cardiol. (2014) 63(25 Pt B):2985–3023. doi: 10.1016/j.jacc.2013.11.004
33. Kraakman MJ, Kammoun HL, Allen TL, Deswaerte V, Henstridge DC, Estevez E, et al. Blocking IL-6 trans-signaling prevents high-fat diet-induced adipose tissue macrophage recruitment but does not improve insulin resistance. Cell Metab. (2015) 21:403–16. doi: 10.1016/j.cmet.2015.02.006
34. Sindhu S, Thomas R, Shihab P, Sriraman D, Behbehani K, Ahmad R. Obesity is a positive modulator of IL-6R and IL-6 expression in the subcutaneous adipose tissue: significance for metabolic inflammation. PLoS ONE (2015) 10:e0133494. doi: 10.1371/journal.pone.0133494
35. Vidal C, Barnetche T, Morel J, Combe B, Daien C. Association of body mass index categories with disease activity and radiographic joint damage in rheumatoid arthritis: a systematic review and meta-analysis. J Rheumatol. (2015) 42:2261–9. doi: 10.3899/jrheum.150224
36. Mangnus L, Nieuwenhuis WP, van Steenbergen HW, Huizinga TW, Reijnierse M, van der Helm-van Mil AH. Body mass index and extent of MRI-detected inflammation: opposite effects in rheumatoid arthritis versus other arthritides and asymptomatic persons. Arthritis Res Ther. (2016) 18:245. doi: 10.1186/s13075-016-1146-3
37. Er LK, Wu S, Hsu LA, Teng MS, Sun YC, Ko YL. Pleiotropic Associations of RARRES2 gene variants and circulating chemerin levels: potential roles of chemerin involved in the metabolic and inflammation-related diseases. Mediators Inflamm. (2018) 2018:4670521. doi: 10.1155/2018/4670521
38. Ferraccioli G, Bracci-Laudiero L, Alivernini S, Gremese E, Tolusso B, De Benedetti F. Interleukin-1β and interleukin-6 in arthritis animal models: roles in the early phase of transition from acute to chronic inflammation and relevance for human rheumatoid arthritis. Mol Med. (2010) 16:552–7. doi: 10.2119/molmed.2010.00067
39. Iwamoto T, Okamoto H, Toyama Y, Momohara S. Molecular aspects of rheumatoid arthritis: chemokines in the joints of patients. FEBS J. (2008) 275:4448–4455. doi: 10.1111/j.1742-4658.2008.06580.x
41. Subbaramaiah K, Howe LR, Bhardwaj P, Du B, Gravaghi C, Yantiss RK, et al. Obesity is associated with inflammation and elevated aromatase expression in the mouse mammary gland. Cancer Prev Res. (2011) 4:329–46. doi: 10.1158/1940-6207.CAPR-10-0381
42. Zhou Q, Leeman SE, Amar S. Signaling mechanisms involved in altered function of macrophages from diet-induced obese mice affect immune responses. Proc Natl Acad Sci USA (2009) 106:10740–5. doi: 10.1073/pnas.0904412106
43. Shoda H, Nagafuchi Y, Tsuchida Y, Sakurai K, Sumitomo S, Fujio K, et al. Increased serum concentrations of IL-1 beta, IL-21 and Th17 cells in overweight patients with rheumatoid arthritis. Arthritis Res Ther. (2017) 19:111. doi: 10.1186/s13075-017-1308-y
44. Carlsen H, Haugen F, Zadelaar S, Kleemann R, Kooistra T, Drevon CA, et al. Diet-induced obesity increases NF-kB signaling in reporter mice. Gene Nutr. (2009) 4:215–222. doi: 10.1074/jbc.M110.123620
45. Lloyd JW, Choi MD, Keslacy S. Does NF-kappaB signaling regulate chemerin expression in adipocytes? FASEB J. (2011) 25(Suppl. 1):859–13.
Keywords: Rheumatoid arthritis, adipose tissue, Chemerin, PEDF, metaflammation
Citation: Tolusso B, Gigante MR, Alivernini S, Petricca L, Fedele AL, Di Mario C, Aquilanti B, Magurano MR, Ferraccioli G and Gremese E (2018) Chemerin and PEDF Are Metaflammation-Related Biomarkers of Disease Activity and Obesity in Rheumatoid Arthritis. Front. Med. 5:207. doi: 10.3389/fmed.2018.00207
Received: 26 April 2018; Accepted: 02 July 2018;
Published: 03 August 2018.
Edited by:
Helena Canhao, Unidade EpiDoC, Epidemiologia de Doenças Crônicas, PortugalReviewed by:
Antje Mueller, Universität zu Lübeck, GermanyAntonio Manzo, University of Pavia, Italy
Copyright © 2018 Tolusso, Gigante, Alivernini, Petricca, Fedele, Di Mario, Aquilanti, Magurano, Ferraccioli and Gremese. This is an open-access article distributed under the terms of the Creative Commons Attribution License (CC BY). The use, distribution or reproduction in other forums is permitted, provided the original author(s) and the copyright owner(s) are credited and that the original publication in this journal is cited, in accordance with accepted academic practice. No use, distribution or reproduction is permitted which does not comply with these terms.
*Correspondence: Elisa Gremese, elisa.gremese@unicatt.it