


Abstract
Type 2 diabetes is associated with increased fracture risk but paradoxically greater bone mineral density (BMD). Trabecular bone score (TBS) is derived from the texture of the spine dual x-ray absorptiometry (DXA) image and is related to bone microarchitecture and fracture risk, providing information independent of BMD.
This study evaluated the ability of lumbar spine TBS to account for increased fracture risk in diabetes.
We performed a retrospective cohort study using BMD results from a large clinical registry for the province of Manitoba, Canada.
We included 29,407 women 50 years old and older with baseline DXA examinations, among whom 2356 had diagnosed diabetes.
Lumbar spine TBS was derived for each spine DXA examination blinded to clinical parameters and outcomes. Health service records were assessed for incident nontraumatic major osteoporotic fractures (mean follow-up 4.7 years).
Diabetes was associated with higher BMD at all sites but lower lumbar spine TBS in unadjusted and adjusted models (all P < .001). The adjusted odds ratio (aOR) for a measurement in the lowest vs the highest tertile was less than 1 for BMD (all P < .001) but was increased for lumbar spine TBS [aOR 2.61, 95% confidence interval (CI) 2.30–2.97]. Major osteoporotic fractures were identified in 175 women (7.4%) with and 1493 (5.5%) without diabetes (P < .001). Lumbar spine TBS was a BMD-independent predictor of fracture and predicted fractures in those with diabetes (adjusted hazard ratio 1.27, 95% CI 1.10–1.46) and without diabetes (hazard ratio 1.31, 95% CI 1.24–1.38). The effect of diabetes on fracture was reduced when lumbar spine TBS was added to a prediction model but was paradoxically increased from adding BMD measurements.
Lumbar spine TBS predicts osteoporotic fractures in those with diabetes, and captures a larger portion of the diabetes-associated fracture risk than BMD.
Osteoporosis predisposes to fragility (low trauma) fractures and has large public health implications. Pain, reduced function, impaired quality of life, institutionalization, and death are consequences to the individual, with a large societal burden resulting from economic costs (1, 2). Bone mineral density (BMD), as measured by dual x-ray absorptiometry (DXA), has been the gold standard tool both for osteoporosis detection and the monitoring of treatment efficacy (3). Although bone density is a major determinant of bone strength and fracture risk (4), considerable overlap exists in BMD values between individuals who develop fractures and those who do not (5–7). Other factors that influence both bone strength and fracture risk include the macrogeometry of cortical bone, the microarchitecture of trabecular bone, bone mineralization, and turnover (8–10).
Diabetes is more frequent in the elderly and therefore frequently coexists with osteoporosis (11, 12). Type 1 diabetes and, more recently, type 2 diabetes have been associated with increased fracture risk (13–15), despite the paradox that areal BMD from DXA is higher in individuals with type 2 diabetes compared with nondiabetic individuals (16–19). In current clinical practice, because BMD is central to fracture prediction, a consequence of this paradox is a lack of suitable methods, including the World Health Organization Fracture Risk Assessment tool, to adequately predict fracture risk in older adults with type 2 diabetes (20, 21). Currently, the World Health Organization Fracture Risk Assessment tool does not include diabetes as a primary entry variable, although type 1 diabetes is listed among the secondary cause of osteoporosis that increase fracture probability when BMD is not known.
The trabecular bone score (TBS) is a novel texture parameter that evaluates pixel gray-level variations in the spine DXA image and is related to bone microarchitecture and fracture risk, providing information independent of BMD (22–25). Conceptually, a dense trabecular network, associated with greater mechanical bone strength, produces a projection image with many gray-level texture variations of small amplitude and therefore a steep variogram slope with a high TBS value (associated with better bone structure). In contrast, a low TBS value indicates fewer gray-level texture variations of larger amplitude and therefore a lower slope (associated with worse bone structure).
Although there is evidence that TBS is able to discriminate between fracture and nonfracture subjects and predict future fracture risk (26–30), it remains uncertain whether TBS is useful in specific conditions that modify fracture risk. In this analysis, we evaluated the ability of lumbar spine TBS to account for the increased fracture risk in diabetes.
Materials and Methods
Patient population
In this retrospective cohort study, 2-dimensional gray-scale DXA images of the lumbar spine, collected from a large cohort of postmenopausal women from the Canadian province of Manitoba, were sent to the University of Lausanne, (Lausanne, Switzerland) for the calculation of spine TBS. The Manitoba Bone Density Program is a targeted case-finding clinical program. The associated database has been shown to exceed 99% in terms of completeness and accuracy (31). All women 50 years old and older who had undergone BMD measurement of the spine and hip by DXA using a single narrow fan-beam scanner configuration (Prodigy; GE Healthcare, Madison, Wisconsin), were eligible for inclusion, providing they had medical coverage during the observation period ending March 31, 2008. All scans were acquired between January 1998 and March 2007. We excluded 59 women with missing height or weight data and 630 women with 1 or more missing skeletal measurements (usually the lumbar spine due to severe structural artifact). For women with more than 1 eligible set of measurements, only the first record was included in the analysis. The study was approved by the Research Ethics Board for the University of Manitoba and the Health Information Privacy Committee of Manitoba Health.
Data sources
In the Province of Manitoba, Canada, health services are provided to virtually all residents through a single public health care system. Manitoba Health maintains computerized databases of physician billing claims and hospital separations for all residents of the province eligible to receive health services (31). Each health system contact includes information on a patient's demographics, date and type of service, and diagnoses from physician billing claims (inpatient, outpatient, and private office) coded using the International Classification of Disease-9-Clinical Modification (ICD-9-CM) system, and hospital discharge abstracts, for which the diagnoses and procedures have been coded using the ICD-9-CM system prior to 2005 and the ICD-10-CA system thereafter. Medication use can be obtained from a provincial retail pharmacy database (32). Each prescription record contains the date of dispensation; an exact identification of the dispensed drug, including substance, strength, route, and dosage form; the number of doses provided; the anticipated duration of the prescription in days; and a code for prescribing physician and dispensing pharmacy. The pharmacy database is accurate both for capture of drug dispensations as well as the prescription details (33). Anonymous linkage of these databases to the BMD database is possible via a unique scrambled health identification number, thereby allowing for the creation of a longitudinal record of health services and outcomes.
Bone mineral density and trabecular bone score
All DXA scans were originally performed using Prodigy scanners (GE Healthcare) and analyzed (encore Software 12.4) in accordance with manufacturer recommendations. BMD measurements were derived for the lumbar spine (L1–4) and femoral neck. Hip T-scores were calculated using the National Health and Nutrition Examination Survey III white female reference values. For the lumbar spine, manufacturer reference data for white US women were used. TBS and BMD values that fell below the 0.1 percentile or above the 99.9 percentile were treated as outliers and excluded from further analysis. The resultant data approximated a normal distribution. Instruments were cross-calibrated using anthropomorphic phantoms. No clinically significant differences were identified; therefore, all analyses are based upon unadjusted numerical results generated by the instrument. All 3 instruments used for this study exhibited stable long-term performance (coefficient of variation <0.5%).
All TBS measurements were performed in the Bone Disease Center at the Lausanne University Hospital, Lausanne, Switzerland (TBS iNsight Software, version 1.8; Med-Imaps, Pessac, France) using anonymized spine DXA files from the Manitoba database to ensure blinding of the Swiss investigators to all clinical parameters and outcomes. The software uses the anteroposterior spine raw image(s) from the densitometer, including the BMD region of interest and edge detection so that the TBS calculation is performed over exactly the same region of interest as the BMD measurement. In the current analysis, we used a research version of the commercialized TBS iNsight software (Med-Imaps), which allows for large batched analyses from a work station. No significant differences in mean TBS measurements were seen for the 3 DXA scanners used. Short-term reproducibility (coefficient of variation) for TBS calculated from all 3 instruments used for this study was 2.1% and 1.7% for spine BMD in 92 individuals with repeat spine DXA scans performed within 28 days (14).
Diabetes and other covariates
Women were categorized by the presence or absence of previously diagnosed diabetes using a validated method for identifying individuals with diabetes (11); diabetes was ascertained on the basis of the presence of 2 separate physician claims for diabetes, or a hospitalization with a diabetes diagnosis, during the 2 years prior to BMD testing. Ascertainment rates for diabetes using this definition have shown excellent agreement with 2-source capture-recapture methods (>95%) and has been implemented in a national diabetes surveillance program (34). Type 1 and type 2 diabetes cannot be reliably distinguished in our data sources, and therefore, our case definition for diabetes included all diagnosed cases.
Longitudinal health service records were assessed for the presence of specific diagnostic codes during the 2 years before BMD testing. This included prior diagnosis of rheumatoid arthritis (RA), diabetes, chronic obstructive pulmonary disease (COPD) (a proxy for smoking), alcohol/substance abuse (a proxy for high alcohol intake), prolonged (≥3 months) of systemic corticosteroid use in the last year, and pharmacological treatment for osteoporosis dispensed in the last year (defined as ≥6 months dispensation of a bisphosphonate, raloxifene, salmon calcitonin, or systemic estrogen product). Anthropomorphic data (height and weight) were measured at the time of DXA and body mass index (BMI) was calculated.
Incident fractures
Longitudinal health service records were assessed for the presence of fracture codes before and after BMD testing that were not associated with trauma codes (35). Major osteoporotic fractures (hip, clinical spine, forearm, and humerus fractures) were studied because these are the basis for the 10-year absolute fracture risk estimates published by Kanis et al (36, 37). We required that hip fractures and forearm fractures be accompanied by a site-specific fracture reduction, fixation, or casting code, which enhances the diagnostic and temporal specificity for an acute fracture. These same fracture definitions have been used in previous analyses to show that BMD measurements predict fractures in our clinical cohort as well as those reported in large meta-analyses (35).
Statistics
Descriptive statistics for subject characteristics are presented as mean ± SD for continuous variables or count (percentage) for categorical variables. Group comparisons were with Student's t test and the χ2 test, respectively. Using a cross-sectional study design, baseline lumbar spine TBS was analyzed as the dependent variable in analysis of covariance models that initially included only clinical covariates and then again with the addition of lumbar spine and femoral neck BMD in separate models. To further assess the association between diabetes and lumbar spine TBS, measurements were stratified into tertiles, and odds ratios for the lowest vs highest TBS tertiles with 95% confidence intervals (CIs) were estimated from logistic regression models. We used Cox proportional hazards models to estimate hazard ratios (HRs) for the association between TBS and BMD and incident osteoporotic fracture, adjusted for covariates, separately in women with diabetes and women without diabetes. To determine whether the association between TBS and BMD and incident osteoporotic fracture differed by diabetes status, we also created models for all women combined that included an interaction term between diabetes and the skeletal measurement.
We estimated HRs for the association between diabetes and fracture in 4 models: 1) without adjusting for any skeletal measurement (base model), 2) adjusting individually for lumbar spine TBS, 3) adjusting individually for lumbar spine BMD, and 4) adjusting jointly for both lumbar spine TBS and BMD. Change in the diabetes-related HR and Wald χ2 statistic from the base model reflects how including the skeletal measurement impacts on diabetes as a predictor of fracture (eg, a decrease in the diabetes HR and Wald statistic implies that the skeletal measurement captures a portion of the diabetes-associated fracture risk). The likelihood ratio (LR) test was used to assess the incremental value of combining BMD and TBS measurements (38). The LR χ2 statistic from the Cox proportional hazards model provides a global measure of model fit, and the difference between χ2 values is used to test the improvement in model fit. A decrease in the Akaike information criterion was also evaluated as a measure of improved model fit. Overall fracture risk stratification was assessed from the area under the receiver-operating characteristic curve (AUROC). Because obesity may potentially degrade image quality and affect texture analysis, we performed sensitivity analyses in subgroups defined by BMI (≥30 kg/m2 vs <30 kg/m2). A P < .05 was taken to indicate a statistically significant effect. Statistical analyses were performed with Statistica (version 10.0; StatSoft Inc, Tulsa, Oklahoma) except for AUROC, which was estimated using PASW SPSS for Windows (version 18, SPSS Inc, Chicago, Illinois).
Results
Table 1 summarizes the baseline characteristics of the study cohort. Of the 29 047 women included, 2356 (8.1%) had previously diagnosed diabetes, whereas the remaining 27 051 (91.9%) did not have diagnosed diabetes. As expected, women with diabetes were slightly older, with higher BMI, greater prevalence of recent glucocorticoid use, prior major fracture, and COPD. However, they were less likely to have recently received treatment for osteoporosis. All BMD measurements were significantly greater in women with than without diabetes (P < .001), which resulted in a significantly lower prevalence of osteoporosis defined by a T-score of −2.5 or lower (P < .001). In contrast to BMD measurements, mean lumbar spine TBS was significantly lower in the diabetic than nondiabetic women (P < .001). Similar results were seen when results were stratified by obesity defined as BMI 30 kg/m2 or greater.
Baseline Study Population Characteristics
| All Women (n = 29 407) | Women With Diabetes (n = 2356) | Women Without Diabetes (n = 27 051) | P Value | |
|---|---|---|---|---|
| Age, y | 65.4 ± 9.4 | 67.6 ± 9.1 | 65.2 ± 9.5 | <.001 |
| BMI, kg/m2 | 26.7 ± 5.0 | 29.7 ± 6.1 | 26.4 ± 4.9 | <.001 |
| Recent osteoporosis therapy | 8898 (30.3) | 522 (22.2) | 8376 (31.0) | <.001 |
| Recent glucocorticoid use | 348 (4.1) | 519 (6.2) | 32 (3.9) | <.001 |
| Prior major fracture | 3986 (13.6) | 385 (16.3) | 3601 (13.3) | <.001 |
| Rheumatoid arthritis | 995 (3.4) | 85 (3.6) | 910 (3.4) | .530 |
| COPD | 2239 (7.6) | 241 (10.2) | 1998 (7.4) | <.001 |
| Alcohol abuse | 681 (2.3) | 44 (1.9) | 637 (2.4) | .132 |
| Lumbar spine T-score | −1.2 ± 1.5 | −0.8 ± 1.5 | −1.2 ± 1.5 | <.001 |
| Trochanter T-score | −1.3 ± 1.1 | −1.0 ± 1.3 | −1.3 ± 1.1 | <.001 |
| Femoral neck T-score | −1.5 ± 0.9 | −1.3 ± 1.0 | −1.5 ± 0.9 | <.001 |
| Total hip T-score | −1.0 ± 1.2 | −0.7 ± 1.3 | −1.1 ± 1.1 | <.001 |
| Minimum T-score osteoporotic | 9166 (31.2) | 633 (26.9) | 8533 (31.5) | <.001 |
| Lumbar spine TBS (unitless) | 1.241 ± 0.12 | 1.172 ± 0.133 | 1.247 ± 0.119 | <.001 |
Continuous variables expressed as mean ± SD. Values in parentheses are percentages.
Adjusting for multiple covariates (age, BMI, glucocorticoids, prior major fracture, RA, COPD as a smoking proxy, alcohol abuse, and osteoporosis therapy), least squares mean (LSM) BMD measurements were all significantly greater in women with than without diabetes, whereas the LSM for lumbar spine TBS was significantly lower (Table 2). Adjusted odds ratios (aORs) for skeletal measurements in the lowest tertile (vs highest tertile reference) were significantly less than 1 for all BMD measurements but were increased for lumbar spine TBS (aOR 2.61, 95% CI 2.30–2.97) (Fig. 1). Similar results were seen for lumbar spine TBS in nonobese subjects with BMI less than 30 kg/m2 (aOR 2.52, 95% CI 2.13–2.97) and in obese subjects with BMI 30 kg/m2 or greater (aOR 2.90, 95% CI 2.37–3.54).
LSM for Skeletal Measurements in Women With and Without Diabetes From ANCOVA Models Adjusted for Multiple Covariatesa
| Women With Diabetes LSM (95% CI) | Women Without Diabetes LSM (95% CI) | LSM Difference (95% CI) | |
|---|---|---|---|
| All women (n = 29 407) | |||
| Lumbar spine BMD, g/cm2 | 1.066 (1.059, 1.072) | 1.035 (1.033, 1.037) | 0.031 (0.024, 0.038) |
| Femoral neck BMD, g/cm2 | 0.844 (0.839, 0.848) | 0.832 (0.831, 0.833) | 0.012 (0.007, 0.016) |
| Trochanter BMD, g/cm2 | 0.710 (0.706, 0.715) | 0.702 (0.701, 0.704) | 0.008 (0.003, 0.013) |
| Total hip BMD, g/cm2 | 0.896 (0.891, 0.901) | 0.877 (0.875, 0.878) | 0.019 (0.014, 0.025) |
| Lumbar spine TBS (unitless) | 1.194 (1.189, 1.198) | 1.245 (1.243, 1.246) | −0.051 (−0.056, −0.046) |
| Nonobese women (BMI < 30 kg/m2) (n = 20 047) | |||
| Lumbar spine BMD, g/cm2 | 1.053 (1.044, 1.062) | 1.014 (1.011, 1.016) | 0.040 (0.031, 0.049) |
| Femoral neck BMD, g/cm2 | 0.832 (0.826, 0.838) | 0.816 (0.814, 0.817) | 0.017 (0.011, 0.023) |
| Trochanter BMD, g/cm2 | 0.689 (0.683, 0.695) | 0.680 (0.679, 0.682) | 0.008 (0.002, 0.015) |
| Total hip BMD, g/cm2 | 0.874 (0.868, 0.881) | 0.853 (0.851, 0.854) | 0.022 (0.015, 0.028) |
| Lumbar spine TBS (unitless) | 1.211 (1.206, 1.217) | 1.254 (1.252, 1.255) | −0.042 (−0.048, −0.036) |
| Obese women (BMI ≥ 30 kg/m2) (n = 6654) | |||
| Lumbar spine BMD, g/cm2 | 1.106 (1.102, 1.11) | 1.131 (1.121, 1.142) | 0.025 (0.014, 0.037) |
| Femoral neck BMD, g/cm2 | 0.889 (0.885, 0.892) | 0.898 (0.891, 0.905) | 0.009 (0.002, 0.017) |
| Trochanter BMD, g/cm2 | 0.777 (0.774, 0.78) | 0.791 (0.784, 0.798) | 0.014 (0.006, 0.022) |
| Total hip BMD, g/cm2 | 0.958 (0.955, 0.962) | 0.981 (0.973, 0.988) | 0.022 (0.014, 0.031) |
| Lumbar spine TBS (unitless) | 1.215 (1.211, 1.218) | 1.150 (1.142, 1.158) | −0.065 (−0.074, −0.056) |
Models were adjusted for age, BMI, glucocorticoids, prior major fracture, RA, COPD, alcohol abuse, and osteoporosis therapy.
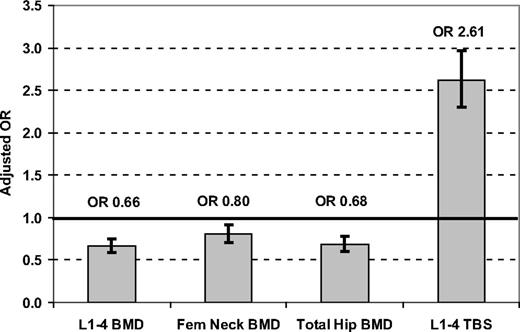
Odds ratios (95% CI) for BMD or TBS in the lowest tertile (reference: highest tertile) associated with diabetes status in all 29 407 women. Results are adjusted for age, BMI, glucocorticoids, prior major fracture, RA, COPD, alcohol abuse, and osteoporosis therapy.
During follow-up of a mean of 4.7 years, major osteoporotic fractures were identified in 175 women with (7.4%) and 1493 women without (5.5%) diabetes (P < .001). Lumbar spine TBS predicted time to first major osteoporotic fracture (adjusted for multiple covariates) in those with diabetes [adjusted HR (aHR) per SD 1.27, 95% CI 1.10–1.46] and without diabetes (aHR 1.31 per SD, 95% CI 1.24–1.38) (Table 3). Lumbar spine TBS and each of the BMD measurements showed a consistent relationship for fracture prediction in women with and without diabetes (all P interaction >.2). Similar results were seen for lumbar spine TBS in nonobese subjects with BMI less than 30 kg/m2 (aHR 1.28, 95% CI 1.21–1.36) and in obese subjects with a BMI 30 kg/m2 or greater (aHR 1.37, 95% CI 1.24–1.51). For all women combined, the aHR for fracture was 1.30 (95% CI 1.24–1.37) for lumbar spine TBS and 1.42 (95% CI 1.34–1.50) for lumbar spine BMD. The addition of lumbar spine TBS to lumbar spine BMD was associated with improved overall fracture prediction and model fit (log LR test P < .001, change in Akaike information criterion −39.2). Similar results were seen when lumbar spine TBS was combined with other BMD measurement sites (data not shown). Overall fracture risk stratification from lumbar spine TBS (AUROC 0.63, 95% CI 0.61–0.64) was similar to lumbar spine BMD (AUROC 0.64, 95% CI 0.63–0.65), and neither showed a statistically significant difference between women with and without diabetes (P > .05).
HR for Major Osteoporotic Fracture Prediction From Skeletal Measurements in Women With and Without Diabetes from Cox Models Adjusted for Multiple Covariates During Mean Follow-Up of 4.7 Yearsa
| Women With Diabetes (n = 2356) HR (95% CI) | Women Without Diabetes (n = 27 051) HR (95% CI) | P Interactionb | |
|---|---|---|---|
| Lumbar spine BMD per SD | 1.39 (1.17–1.64) | 1.42 (1.34–1.51) | .782 |
| Femoral neck BMD per SD | 1.44 (1.20–1.74) | 1.68 (1.56–1.81) | .134 |
| Trochanter BMD per SD | 1.47 (1.25–1.74) | 1.56 (1.46–1.65) | .552 |
| Total hip BMD per SD | 1.53 (1.29–1.82) | 1.65 (1.55–1.76) | .416 |
| Lumbar spine TBS per SD | 1.27 (1.10–1.46) | 1.31 (1.24–1.38) | .664 |
Models were adjusted for age, BMI, glucocorticoids, prior major fracture, RA, COPD, alcohol abuse, and osteoporosis therapy.
Women with diabetes vs women without diabetes.
In models that included multiple covariates (but not skeletal measurements), diabetes was associated with a 49% increase in the risk for major osteoporotic fracture (aHR 95% CI 1.27–1.74; χ2 23.6). When lumbar spine TBS was included in the model, the diabetes effect was slightly attenuated (HR 1.35, 95% CI 1.15–1.59, χ2 13.6), whereas inclusion of lumbar spine BMD accentuated the diabetes effect (HR 1.59, 95% CI 1.35–1.86, χ2 32.0). Similar results were seen with other BMD measurement sites (Table 4). Including lumbar spine TBS and lumbar spine BMD in the same model led to opposing effects in the model, with diabetes predicting fracture to an equivalent degree as in the model without skeletal measurements (HR 1.47, 95% CI 1.25–1.73, χ2 22.0).
Adjusted HRs for Major Osteoporotic Fracture Prediction From Diabetes and Combinations of Lumbar Spine Skeletal Measurements in 29 407 Women Adjusted for Multiple Covariates During a Mean Follow-Up of 4.7 Yearsa
| Models | Diabetes | TBS HR (95% CI) | BMD HR (95% CI) | |
|---|---|---|---|---|
| HR (95% CI) | Wald χ2 | |||
| Model 1: no skeletal measurement | 1.49 (1.27–1.74) | 23.6 | — | — |
| Model 2: lumbar spine TBS per SD | 1.35 (1.15–1.59) | 13.4 | 1.30 (1.24–1.37) | — |
| Model 3: lumbar spine BMD per SD | 1.59 (1.35–1.86) | 32.0 | — | 1.42 (1.34–1.50) |
| Model 4: lumbar spine TBS and BMD per SD | 1.47 (1.25–1.73) | 22.0 | 1.19 (1.13–1.26) | 1.32 (1.25–1.41) |
Models were adjusted for age, BMI, glucocorticoids, prior major fracture, RA, COPD, alcohol abuse, and osteoporosis therapy. Dashes indicate not applicable.
Discussion
In this large clinical cohort of women, we found that diabetes was associated with higher BMD measurements (unadjusted and multivariable adjusted), whereas lumbar spine TBS was associated with lower measurements. This opposing effect of diabetes on BMD and TBS also affected models of fracture prediction in which lumbar spine TBS attenuated the effect of diabetes, whereas BMD measurements accentuated this effect. This suggests that lumbar spine TBS captures some of the fracture risk associated with diabetes. In contrast, because BMD measurements are paradoxically higher in the women with diabetes despite higher fracture risk, BMD measurements actually confound this relationship.
The mechanisms for increased fracture risk in diabetes are likely multifactorial and include material changes and structural abnormalities (39). High glucose levels in diabetes lead to accumulation of advanced glycosylation end-products in the organic bone matrix (40–43), and advanced glycosylation end-products cross-links lead to biomechanically more brittle bone that has lost its toughness and is less able to deform before fracturing (44). The cortical compartment in diabetes may be preferentially compromised (45, 46). Increased cortical porosity in particular has been reported at the radius in female persons with diabetes who have had a fracture (46), and this porosity reduces bone strength yet is undetectable by DXA (47, 48). There is also evidence of a possible defect in trabecular microarchitecture in type 1 and type 2 diabetes, particularly among those who have sustained low-trauma fractures (49, 50).
Further work is needed to clarify exactly which skeletal properties in diabetes affect lumbar spine TBS. A review by Bousson et al (23) observed that TBS correlates with, but does not have the resolution to directly measure, bone microarchitecture. The contribution of the vertebral body trabecular network to the gray levels in a DXA image is difficult to determine relative to the contributions of bone geometry, soft tissue composition, detector heterogeneity, and image noise. Despite these uncertainties, clinical results obtained in large populations show that spine TBS predicts fragility fractures independent of BMD (23). The current study suggests that spine TBS may be particularly helpful in type 2 diabetes in which BMD is paradoxically increased.
Limitations of the current study are acknowledged. We were unable to distinguish women with type 1 vs type 2 diabetes, and therefore, we were not able to account for any differences. Given the age of our cohort, the great majority of the sample with diabetes would have type 2 diabetes; in the population-based Canadian Multicenter Osteoporosis Study, 1.3% of participants over age 50 years had type 1 diabetes and 6.8% had type 2 diabetes (18). Similarly, we did not have information on duration of diabetes or related complications and cannot exclude the possible effect of unmeasured confounders such as a falls risk, which is increased in diabetes (51, 52). Our definition of major osteoporotic fracture did not include lower limb fractures, which are common in persons with diabetes, and it is uncertain how well lumbar spine TBS would predict these fractures. We also did not have sufficient numbers of fractures in diabetic women for site-specific fracture analyses and did not consider time since prior fracture in the analysis. The analysis was conducted using a single manufacturer, and it is uncertain whether equivalent results would be obtained with other manufacturers. Men were not included in our study population; therefore, caution should be exercised in generalizing these findings to men. It is also unclear whether equivalent results would be obtained in other countries and ethnic groups.
Lumbar spine TBS is sensitive to skeletal deterioration in postmenopausal women with diabetes, whereas BMD is paradoxically greater. Lumbar spine TBS predicts osteoporotic fractures in those with diabetes and captures a larger portion of the diabetes-associated fracture risk than BMD. Combining lumbar spine TBS with BMD incrementally improves fracture prediction.
Acknowledgments
The authors are indebted to Manitoba Health for the provision of data (Health Information Privacy Committee number 2008/2009-33). The results and conclusions are those of the authors, and no official endorsement by Manitoba Health is intended or should be inferred. This article has been reviewed and approved by the members of the Manitoba Bone Density Program Committee.
Disclosure Summary: W.D.L. receives speaker's fees from Amgen and research grants from Amgen and Genzyme and is on the advisory boards of Amgen, Novartis. D.H. has coownership in the TBS patent and research grants from Amgen, Eli Lilly, Servier, and Nycomed-Takeda. The other authors have nothing to disclose.
Abbreviations
- aHR
Adjusted HR
- aOR
adjusted odds ratio
- AUROC
area under the receiver-operating characteristic curve
- BMD
bone mineral density
- BMI
body mass index
- CI
confidence interval
- COPD
chronic obstructive pulmonary disease
- DXA
dual x-ray absorptiometry
- HR
hazard ratio
- ICD-9-CM
International Classification of Disease-9-Clinical Modification
- LR
likelihood ratio
- LSM
least squares mean
- RA
rheumatoid arthritis
- TBS
trabecular bone score.
References
