


Abstract
It is well known that T3 plays a crucial role in the maintenance of early pregnancy through the induction of endocrine function in villous trophoblasts. The effects of T3 on extravillous trophoblast (EVT) function, however, remain to be elucidated. To investigate the possible role of T3 in the regulation of EVT invasion to the decidua, we have examined whether T3 affects EVT invasive potential and the expression of matrix metalloproteinase-2 (MMP-2), MMP-3, tissue inhibitor metalloproteinase-1, fetal fibronectin (FN), and integrin α5β1 in cultured early placental EVTs. Isolation and purification of trophoblasts differentiating into EVTs were performed by the enzymatic digestion of the anchoring chorionic villi, with the use of human FN-precoated culture dishes and FN-precoated Matrigel Transwells. The cells attached to the dishes were subcultured in DMEM supplemented with 10% fetal bovine serum for 48 h and were characterized by RT-PCR analysis after 24-h subculture and immunocytochemical analysis after 48-h subculture for specific EVT markers. Thereafter, the cultured cells were stepped down to a 4% fetal bovine serum condition and cultured in the presence or absence of T3 (10−8m) for the subsequent 72 h. Matrigel invasion assay demonstrated that the treatment with T3 significantly increased the number of cell projections of subsequent 24-, 48-, and 72-h cultured EVTs. RT-PCR analysis revealed that the treatment with T3 increased the expression of MMP-2, MMP-3, fetal FN, and integrin α5β1 mRNA in subsequent 24-h cultured EVTs compared with those in control cultures. Immunocytochemical and Western immunoblot analyses revealed that treatment with T3 increased the expression of MMP-2 and MMP-3 in subsequent 48-h cultured EVTs compared with those in control cultures. The present results suggest that T3 (10−8m) may play a vital role in up-regulating the invasive potential of EVTs into the decidua.
PLACENTAL TISSUES CONTAIN a heterogeneous population of cells, including villous cytotrophoblasts (C cells) and syncytiotrophoblasts (S cells) as well as extravillous trophoblasts (EVTs) (1). The development of the human fetus depends on the ability of EVTs to invade the maternal uterine tissues to anchor the placenta and the fetus to the maternal endometrium, enabling the fetus to gain access to the maternal circulation (2–4). Cell adhesion molecules (CAMs) expressed in EVTs have important roles in invasive processes of EVTs to the decidua (5–8). The invasive potential of EVTs has been demonstrated to be regulated by a variety of CAMs and involves at least three main factors, including polar degradation of extracellular matrix (ECM) in the direction of migration, suppression of degradation and stopping the invasion, and binding of cells to the ECM, and active movement through the matrix. The first factor requires respective enzymes, such as matrix metalloproteinases (MMPs), whereas the second factor requires respective enzymes, such as tissue inhibitor metalloproteinases (TIMPs). Several researchers have reported the distribution patterns of MMPs and TIMPs in EVTs (9–17) and suggested important roles of MMP-2, MMP-3, and TIMP-1 in the regulation of EVT’s invasion (18–23). The third factor requires integrins that are cell surface receptors for matrix proteins. The cell surface phenotypes of cytotrophoblast change during the invasion, with a decrease in integrin α6β4 and a rapid increase in integrin α5β1 (1, 24, 25). The possible interaction between fibronectin (FN) and integrin α5β1 in EVT’s invasiveness is assumed to exist (24).
Maternal thyroid hormone insufficiency has been implicated in early pregnancy loss (26, 27). Maternal T3 was shown to have a physiological role in the maintenance of early pregnancy due to its action as a biological amplifier of trophoblast endocrine function in villous trophoblasts (28–30). Little information is available, however, regarding the effects of T3 on the invasive potential in early placental EVTs. It is now evident that T3 receptors are present in EVTs in early pregnancy (31). Thus, we conducted the present study to investigate the direct effects of T3 on the invasive potential of EVTs through Matrigel Transwells and the expression of integrins and MMPs in cultured early placental EVTs.
Materials and Methods
Clinical materials
Normal early placental tissues were obtained from 32 patients who underwent elective abortion at 8–12 wk gestation for psychosocial reasons. The gestational age of the placenta was determined by estimating the duration of pregnancy from the date of the patient’s last menstrual period and by ultrasound examination. Informed consent was obtained from each patient before surgical intervention for use of placental tissues for the present study. The study was approved by the institutional review board.
Cell culture
The procedure of isolation and purification of trophoblasts differentiating into EVTs was adapted from the techniques of Loke and Burland (32) based on the enzymatic digestion of the anchoring chorionic villi. Trophoblasts from the cell column were directly accessible to enzymatic digestion and were released from the tissues in aggregates, whereas the isolation of villous cytotrophoblasts required more intensive enzymatic digestion of the chorionic villi (33). Purified human fibronectin (FN; 10 μg/ml; ICN Biomedicals, Aurora, OH) was incubated for 1 h at 37 C in 5% CO2, then 0.5 ml FN was placed into the dishes. Chorionic villi were incubated in PBS containing 0.125% trypsin (Sigma-Aldrich Corp., Tokyo, Japan), 4.2 mm MgSO4, 25 mm HEPES, and 50 Kunitz units/ml deoxyribonuclease type IV (Sigma-Chemie, Saint-Quentin Fallavier, France) for 15 min at 37 C without agitation. After tissue sedimentation, the supernatant was filtered (100 μm pore size). The collected cells were sedimented twice with PBS. Trypsin digestion was stopped with 5% fetal bovine serum (FBS; BioWhittaker, Walkersville, MD). The cells obtained were centrifuged at 300 × g for 10 min, diluted to a concentration of 5–6 × 10⁵ cells/2 ml, and then plated on FN-precoated, six-well, 35-mm culture dishes (BD Biosciences, Oxnard, CA) and FN-precoated, two-well chamber, plastic slides (Nalge, Nunc International, Naperville, IL). The cells were maintained in bicarbonate-buffered DMEM (Invitrogen Life Technologies, Grand Island, NY), supplemented with 10% FBS, 2 mm glutamine, 25 mm HEPES, 100 IU/ml penicillin, and 100 μg/ml streptomycin and incubated in 5% CO2 at 37 C. After 3 h, the cells were washed three times to eliminate debris and were cultured for 48 h at 37 C in 5% CO2 in bicarbonate-buffered DMEM supplemented with 10% FBS, 2 mm glutamine, 25 mm HEPES, 100 IU/ml penicillin, and 100 μg/ml streptomycin. After 1.5-, 24-, and 48-h subcultures, the cells attached to FN-precoated dishes were characterized by immunocytochemical analyses of cytokeratin-7 (CK7), human placental lactogen (hPL), ErbB1, and ErbB2 to identify the trophoblastic origin of the cells. Moreover, the cells were characterized by RT-PCR analyses of erbB1 and erbB2 after 1.5- and 24-h subcultures. Thereafter, the cultured cells were stepped down to 4% FBS condition by incubating in DMEM in the presence or absence of T3 (10−8m) supplemented with 2 mm glutamine, 25 mm HEPES, 100 IU/ml penicillin, and 100 μg/ml streptomycin for the subsequent 72 h. T3 was purchased from Sigma-Aldrich Corp. (St. Louis, MO) and was processed as described previously (30). Briefly, T3 was dissolved with 1 m NaOH and absolute ethanol and brought to a concentration of 10−4m with warm distilled water. The T3 stock solution was diluted in culture medium immediately before use. Cultures were inspected daily under a Nikon ELWD 0.3 inverted, phase contrast microscope. After 48 h of subsequent culture, the protein expression of MMP-2, MMP-3, and TIMP-1 in cultured EVTs was examined immunocytochemically.
Immunocytochemical analysis
Immunocytochemical staining was performed using the avidin-biotin immunoperoxidase method with the use of polyvalent immunoperoxidase kit (Omnitag, Lipshaw, MI) as described previously (34). Briefly, cultured cells attached to the FN-precoated chamber slides were washed three times with PBS at room temperature and were fixed in 99.9% ethyl alcohol overnight at 4 C. The fixed cells were preincubated with 3% hydrogen peroxide in PBS for 5 min to quench endogenous peroxidase activity. The first incubation was performed with the primary antibody, followed by the second incubation with biotinylated polyvalent antibody. The third incubation was carried out with avidin-horseradish peroxidase. Thereafter, chromogenic reaction was developed by incubation with prepared solution of 3-amino-9-ethylcarbazole and hydrogen peroxide. The cells were counterstained with Harris hematoxylin, mounted in glycerin phosphate buffer solution, and examined microscopically. Photomicrograph of the samples was taken using a UFX camera attachment (Nikon, Melville, NY). The primary antibodies used are indicated in Table 1.
Antibodies used for immunocytochemistry
| Antibodies | Species | Isotype | Dilution | Source |
|---|---|---|---|---|
| Cytokeratin 7 | Mouse | IgG1 | 1:200 | Dako, Trappes, France |
| HPL | Rabbit | 1:500 | Dako, Trappes, France | |
| ErbB2 | Goat | 1:100 | Santa Cruz Biotechnology, Santa Cruz, CA | |
| ErbB1 | Mouse | IgG1 | 1:100 | Coulter, Margency, France |
| MMP-2 | Rabbit | 1:200 | Chemicon International, Inc., Temecula, CA | |
| MMP-3 | Goat | 1:200 | Chemicon International, Inc., Temecula, CA | |
| TIMP-1 | Rabbit | 1:200 | Chemicon International, Inc., Temecula, CA |
Protein extraction and Western immunoblot analysis of MMP-2, MMP-3, and TIMP-1
After 48-h subsequent culture, the cells adherent to the FN-precoated dishes were lysed at 4 C for 30 min in the presence of a lysis buffer (150 mm NaCl, 1 mm phenylmethylsulfonylfluoride, 1 mm EDTA, 20 mm HEPES, 12 mm deoxycholic acid, 35 mm SDS, 10 mm dithiothreitol, and 1% Triton X). The lysates were subsequently centrifuged at 13,000 × g for 30 min at 4 C, and supernatants were collected. The protein content in the supernatants was determined by Bradford assay (26) with BSA as a standard.
Each 200-μg aliquot of proteins extracted from cultured EVTs was separated by 14% SDS-PAGE under a reducing condition using 100 V for 2–3 h. The proteins were then electrophoretically transferred from gels to nitrocellulose membranes (Bio-Rad Laboratories, Inc., Hercules, CA). Blots were exposed overnight with primary antibodies at a dilution of 1:100 in blocking buffer. The membranes were incubated for 1 h with horseradish peroxidase-conjugated donkey antirabbit secondary antibody (Santa Cruz Biotechnology, Inc., Santa Cruz, CA) or antigoat secondary antibody (Santa Cruz Biotechnology, Inc.) diluted 1: 2000 with blocking buffer. The antigen-antibody complexes were detected with the ECL chemiluminescence detection kit (Amersham Biosciences, Little Chalfont, UK). Membranes were visualized by exposure to X-OMAT film (Eastman Kodak Co., Tokyo, Japan). The radioautograms were then scanned and quantified with ChemiImager 4400 (Astec Co. Ltd., Osaka, Japan). These experiments were performed five times using different cultured EVTs. The primary antibodies used are indicated in Table 1.
Quantitative RT-PCR analysis
After 1.5- and 24-h subcultures, the cells attached to six-well, 35-mm culture dishes were characterized by RT-PCR analyses with erbB1 and erbB2 primers. After 24 h of subsequent culture, the mRNA expression of CAMs in subcultured EVTs was examined by RT-PCR analyses with MMP-2, MMP-3, and TIMP-1, fetal FN (FFN), integrin α5 and integrin β1 primers. Total RNA was isolated from frozen EVTs using RNeasy Mini Kit (Qiagen, Hilden, Germany) according to the manufacturer’s protocol. First strand cDNA was synthesized from 4 μg total RNA using a cDNA synthesis kit (Qiagen) according to the manufacturer’s protocol. PCR was performed using 0.1 μg cDNA as a template in a 25-μl reaction buffer [10 mm Tris-HCl (pH 8.3), 50 mm KCl, 1.5 mm of MgCl2, and 0.01% gelatin] containing 6.25 pm of each primer, 2.5 mm deoxy-NTPs, and 0.125 U Taq DNA polymerase (all from Qiagen). Reactions were amplified by a Gene Amp PCR System 9600-R (PerkinElmer, Norwalk, CT) using the following thermal profile: initial denaturation step at 95 C for 5 min, followed by 20 or 21 cycles of denaturation at 94 C for 1 min, annealing at 55 C for 1 min, extension at 72 C for 1 min, and a final elongation of 72 C for 5 min. Primers and antisense primer were synthesized according to the report by Tarrade et al. (35). Separate reactions were performed using primers specific for β-actin (sense primer, 5′-CTTCTACAATGAGCTGCGTG-3′; antisense primer, 5′-TCATGAGGTAGTCAGTCAGG-3′). The PCR product specific for β-actin was visualized under UV light after gel electrophoresis on a 1.5% agarose gel stained with ethidium bromide. These experiments were performed four times using different cultured EVTs. The sequences of the specific oligonucleotide primers and the sizes of the respective amplification products are given in Table 2.
Primers used in quantitative RT-PCR
| Forward primer (5′–3′) | Reverse primer (5′–3′) | PCR products (bp) | |
|---|---|---|---|
| erbB1 | 5′-GGAGAACTGCCAGAAACTGACC-3′ | 5′-GCCTGCAGCACACTGGTTG-3′ | 474 |
| erbB2 | 5′-AGCCGCGAGCACCCAAGT-3′ | 5′-TTGGTGGGCAGGTAGGTGAGTT-3′ | 297 |
| MMP-2 | 5′-AGATCTTCTTCTTCAAGGACCGGTT-3′ | 5′-GGCTGGTCAGTGGCTTGGGGTA-3′ | 303 |
| MMP-3 | 5′-GATCTCTTCATTTTGGCCATCTCTTC-3′ | 5′-CTCCAGTATTTGTCCTCTACAAAGAA-3′ | 400 |
| TIMP-1 | 5′-CATCCTGTTGTTGCTGTGGCTGAT-3′ | 5′-GTCATCTTGATCTCATAACGCTGG-3′ | 385 |
| FFN | 5′-AAGGCATAGGCCAAGACCATAC-3′ | 5′-ATGCGAATTCGTTTTTTTTTTTTTTTTTTT-3′ | 216 |
| Integrin α5 | 5′-GGCAGCTATGGCGTCCCACTGTGG-3′ | 5′-GGCATCAGAGGTGGCTGGAGGCTT-3′ | 171 |
| Integrin β1 | 5′-GTGGTTGCTGGAATTGTTCTTATT-3′ | 5′-TTTTCCCTCATACTTCGGATTGAC-3′ | 189 |
Matrigel invasion assay
To assess the invasive potential of cultured EVTs, we used the Matrigel Transwell inserts (23.1 mm; BD Biosciences, Tokyo, Japan) containing polycarbonate filters with 8-μm pores, as described previously (36). The upper side was coated with 10 μl diluted Matrigel (5–6 mg/ml) and was coated further with FN on the Matrigel. After 48-h subculture in DMEM supplemented with 10% FBS, the cells were harvested with 0.01% EDTA-0.1% trypsin and diluted to a concentration of 2.5 × 10⁵ cells/2 ml, then plated on FN-precoated Matrigel Transwell inserts. Thereafter, the cells were stepped down to 4% FBS condition and cultured in the presence or absence of T3 (10−8m) supplemented with 2 mm glutamine, 25 mm HEPES, 100 IU/ml penicillin, and 100 μg/ml streptomycin; 3 ml of the same medium were added to the well. The cells were kept in culture for the subsequent 72 h at 37 C in 5% CO2.
After 1.5-, 24-, 48-, and 72-h subsequent cultures, the upper surface of the membrane in each insert was gently scrubbed with a cotton swab to remove all of the noninvading cells, FN, and Matrigel matrix. The invading cells on the under surface of the membranes were fixed and immunostained for CK7. The invasive potential was quantified by counting the number of cell projections that penetrated the filter pores in 20 fields. These experiments were performed 10 times using different cultured EVTs.
Statistical analysis
Statistical analysis was performed using one-way ANOVA with Stat View 5.0 software (SAS Institute, Inc., Cary, NC) for Macintosh, followed by post hoc testing using Fisher’s protected least significant difference test. Difference with a P < 0.05 was considered statistically significant.
Results
Characterization of subcultured cells attached to FN-precoated chamber slides
Immunocytochemical analyses of the cells adherent to FN-precoated slides demonstrated that CK7, hPL, ErbB1, and ErbB2 were present in the attached cells, and the CK7-positive rate was 99.6%, the hPL-positive rate was 62.0%, the ErbB2-positive rate was 61.8%, and the ErbB1-positive rate was 36.2%, respectively, after 1.5-h subculture (Table 3), whereas after 48-h subculture, CK7, hPL, and ErbB2 were detected in 99.2%, 99.4%, and 98.9% of the cells, respectively, but ErbB1 was negligible in the cells (Fig. 1 and Table 3). Replacement of the primary antibodies with nonimmune murine, rabbit, or goat IgG resulted in a lack of positive immunostaining in the cells after 1.5- and 48-h subcultures (Fig. 1).
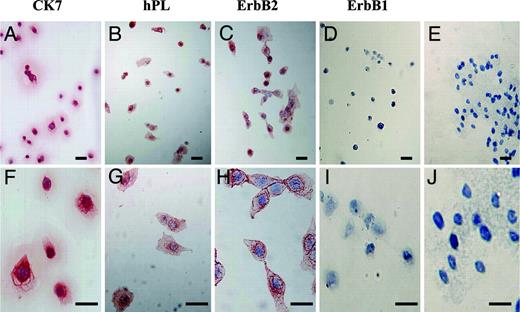
Immunocytochemical staining of CK7, hPL, ErbB2, and ErbB1 in early placental cells attached to FN-precoated dishes after 48-h subculture on FN-precoated dishes. Immunocytochemical analysis of the cells after 48-h subculture demonstrated that CK7 (A and F), hPL (B and G), and ErbB2 (C and H) were present, whereas ErbB1 was absent (D and I). Replacement of the primary antibody with nonimmune murine or goat IgG resulted in a lack of positive immunostaining in the cells after 48-h subcultures (E and J). Bars, 50 μm. Original magnification: A–E, ×200; F-J, ×400.
The percentage of immunodetection of markers in cultured cells after 1.5-, 24-, and 48-h subcultures on FN-precoated dishes
| Immunodetection (%) | |||
|---|---|---|---|
| 1.5 h | 24 h | 48 h | |
| CK7 | 99.6 ± 0.3 | 98.9 ± 1.6 | 99.2 ± 1.3 |
| hPL | 62.0 ± 3.9 | 83.6 ± 3.9 | 99.4 ± 1.5 |
| ErbB2 | 61.8 ± 3.4 | 82.2 ± 5.5 | 98.9 ± 3.6 |
| ErbB1 | 36.2 ± 4.1 | 14.9 ± 3.2 | 0.3 ± 0.2 |
| Immunodetection (%) | |||
|---|---|---|---|
| 1.5 h | 24 h | 48 h | |
| CK7 | 99.6 ± 0.3 | 98.9 ± 1.6 | 99.2 ± 1.3 |
| hPL | 62.0 ± 3.9 | 83.6 ± 3.9 | 99.4 ± 1.5 |
| ErbB2 | 61.8 ± 3.4 | 82.2 ± 5.5 | 98.9 ± 3.6 |
| ErbB1 | 36.2 ± 4.1 | 14.9 ± 3.2 | 0.3 ± 0.2 |
Each value is expressed as the mean ± sd.
The transcript levels of erbB1 and erbB2 after 1.5- and 24-h subcultures are shown in Fig. 2. RT-PCR analysis of mRNA extracts from the cells after 1.5- and 24-h subcultures revealed that 474-bp erbB1 mRNA was present after 1.5-h subculture, but was undetectable after 24-h subculture (Fig. 2A). The erbB1 mRNA expression in the cells significantly decreased after 24-h subculture compared with that after 1.5-h subculture (P < 0.05; Fig. 2B). Moreover, RT-PCR analysis of mRNA extracts from the cells after 1.5- and 24-h subcultures revealed that 297-bp erbB2 mRNA was abundantly present after 1.5- and 24-h subcultures (Fig. 2A), without significant changes (Fig. 2C).
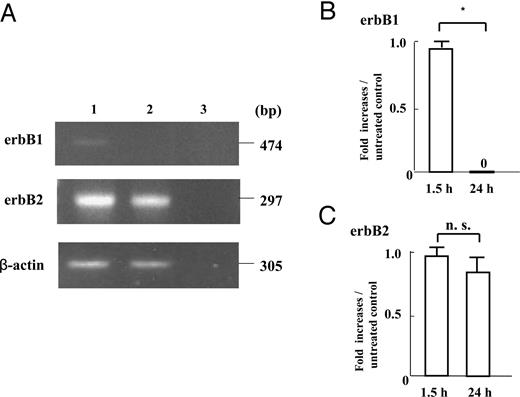
The mRNA expression of erbB1, erbB2 in early placental cells attached to FN-precoated dishes after 1.5- and 24-h subcultures, as assessed by quantitative RT-PCR. First strand cDNA was synthesized from total RNA extracted from cultured early placental EVTs after 1.5- and 24-h subcultures. Each 0.1 μg cDNA was subjected to RT-PCR as described in Materials and Methods. The 474-bp PCR product specific for erbB1, the 297-bp PCR product specific for erbB2, and the 305-bp PCR product specific for β-actin were detected. The amounts of erbB1 and erbB2 mRNA were expressed relative to the abundance of β-actin mRNA. Data were presented as the fold increases over the average intensity of β-actin mRNA. RT-PCR analyses of mRNA extracts from the cells after 1.5- and 24-h subcultures revealed that 474-bp erbB1 mRNA was present after 1.5-h subculture, but was undetectable after 24-h subculture (A), whereas 297-bp erbB2 mRNA was abundantly present not only after 1.5-h subculture, but also after 24 h-subculture (A). The 474-bp mRNA expression of erbB1 after 24-h subculture significantly decreased compared with that after 1.5-h subculture (P < 0.05; B), whereas the mRNA expression of 297-bp erbB2 after 24-h subculture was comparable with that after 1.5-h subculture (C). Experiments were repeated four times with similar results for each. Lane 1, 1.5-h subculture; lane 2, 24-h subculture; lane 3, negative control. Each value is expressed as the mean ± sd. *, P < 0.05. n.s., Not significant.
Matrigel invasion assay
Scanning digital microscopy after immunostaining with an antibody against CK7 showed many cell projections on the lower side of the filter. Figure 3B shows the high magnification of an area within the frame. Treatment with T3 (10−8m) resulted in an apparent increase in the number of EVTs compared with that in untreated cultures after 24-, 48-, and 72-h subsequent cultures (Fig. 3A). The quantitative analysis of the number of cell projections observed in the absence or presence of T3 (10−8m) revealed that T3 treatment significantly increased the number of cell projections compared with that in untreated cultures after 24-, 48-, and 72-h subsequent cultures (Fig. 3C; P < 0.05).
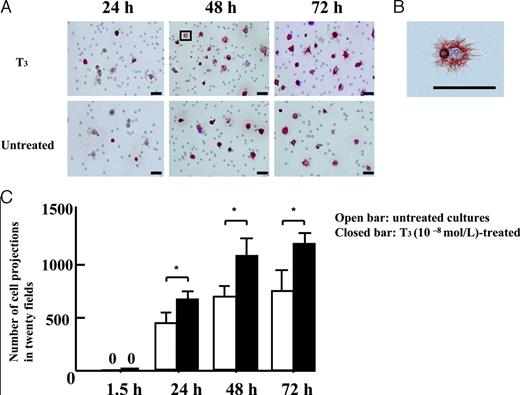
A, Effects of treatment with T3 (10−8m) on the number of the cells invading the under surface of the membrane, as assessed by immunocytochemical analysis with CK7. Many cell projections were visible on the bottom of the filter by scanning digital microscopy after immunostaining with an antibody against CK7. The EVTs visible on the bottom side of the filter in cultures treated with T3 (10−8m) were more abundantly apparent than with those in untreated cultures after 24-, 48-, and 72-h subsequent cultures. B, The high magnification of an area within the frame. Bars, 50 μm. C, The quantitative analysis of the number of cell projections cultured in the absence or presence of T3 (10−8m). T3 treatment significantly increased the number of cell projections compared with those in untreated cultures after 24-, 48-, and 72-h subsequent cultures (P < 0.05). Experiments were repeated 10 times with similar results for each. Each value is expressed as the mean ± sd. *, P < 0.05. □, Untreated cultures; ▪, T3 (10−8m)-treated cultures.
Immunocytochemical and Western immunoblot analyses of MMP-2, MMP-3, and TIMP-1 in cultured early placental EVTs
Immunocytochemical analyses revealed that MMP-2, MMP-3, and TIMP-1 proteins were present in the cytoplasm of the cultured EVTs after 48-h subsequent culture. Replacement of the primary antibodies with nonimmune either rabbit or goat IgG resulted in a lack of positive immunostaining in the cultured EVTs (Fig. 4A, g–i). The expressions of MMP-2 and MMP-3 in the cultured EVTs treated with T3 were more abundant than those in untreated cultures, whereas there was no apparent difference in the expression of TIMP-1 protein between the EVTs treated with T3 and untreated cultures (Fig. 4A).
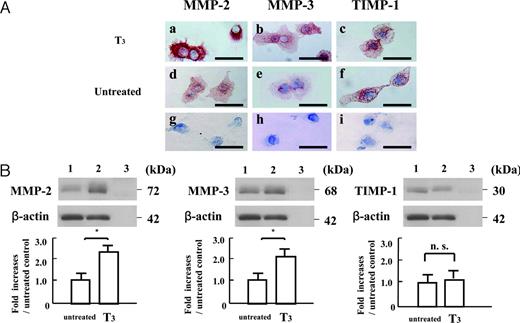
The protein expression of MMP-2, MMP-3, and TIMP-1 in cultured early placental EVTs after 48-h subsequent culture on FN-precoated dishes, as assessed by immunocytochemical and Western immunoblot analyses. A, Immunocytochemical detection of MMP-2, MMP-3, and TIMP-1 in cultured early placental EVTs after 48-h subsequent culture in the presence or absence of T3 (10−8m). MMP-2, MMP-,3 and TIMP-1 proteins were abundant in the cytoplasm of cultured EVTs after 48-h subsequent culture. Replacement of the primary antibody with nonimmune rabbit or goat IgG resulted in a lack of positive immunostaining in the cultured EVTs (g–i). The expression of MMP-2 and MMP-3 in cultured EVTs treated with T3 was more abundant than that in untreated cultures. However, there was no apparent change in the expression of TIMP-1 protein between the cultured EVTs treated with T3 and untreated cultures. Bars, 50 μm. B, Western immunoblot analyses of MMP-2, MMP-3, and TIMP-1 in cultured early placental EVTs after 48-h subsequent culture in the presence or absence of T3 (10−8m). Each 200-μg aliquot of proteins extracted from cells after 48-h subsequent culture was subjected to Western immunoblot with polyclonal antibodies to recombinant MMP-2, MMP-3, and TIMP-1 proteins as described in Materials and Methods. The amounts of MMP-2, MMP-3, and TIMP-1 proteins were expressed relative to the abundance of β-actin protein. Data were presented as the fold increases over the average intensity of β-actin protein. Treatment with T3 significantly increased the expression of 72-kDa MMP-2 and 68-kDa MMP-3 in the cells compared with those in untreated cultures (P < 0.05), whereas the expression of 30-kDa TIMP-1 in the cells treated with T3 was comparable with that in untreated cultures. Experiments were repeated five times with similar results for each. Lane 1, Untreated cultures; lane 2, T3 (10−8m)-treated cultures; lane 3, negative control. Each value is expressed as the mean ± sd. *, P < 0.05. n.s., Not significant.
Western immunoblot analysis of proteins extracted from the EVTs cultured for 48 h in the absence or presence of T3 (10−8m) showed that T3 treatment significantly increased the expression of 72-kDa MMP-2 and 68-kDa MMP-3 compared with those in untreated cultures (P < 0.05), whereas the expression of 30-kDa TIMP-1 in those cells treated with T3 was comparable with that in untreated cultures (Fig. 4B).
RT-PCR analyses of MMP-2, MMP-3, TIMP-1, FFN, integrin α5, and integrin β1 in cultured early placental EVTs
RT-PCR analyses of mRNA extracted from EVTs cultured for 24 h in the absence or presence of T3 (10−8m) showed that T3 treatment significantly increased the expression of 303-bp MMP-2 mRNA, 400-bp MMP-3 mRNA, 216-bp FFN mRNA, 171-bp integrin α5 mRNA and 189-bp integrin β1 mRNA compared with those in untreated cultures (P < 0.05), whereas the expression of 385-bp TIMP-1 mRNA in those cells treated with T3 was comparable with that in untreated cultures (Figs. 5 and 66).
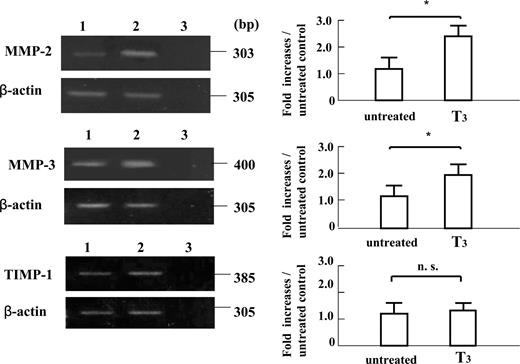
The mRNA expression of MMP-2, MMP-3, and TIMP-1 in cultured early placental EVTs after 24-h subsequent culture on FN-precoated dishes, as assessed by quantitative RT-PCR. First strand cDNA was synthesized from total RNA extracted from cultured early placental EVTs after 24-h subsequent culture. Each 0.1 μg cDNA was subjected to RT-PCR as described in Materials and Methods. The 303-bp PCR product specific for MMP-2, the 400-bp PCR product specific for MMP-3, the 385-bp PCR product specific for TIMP-1, and the 305-bp PCR product specific for β-actin were detected. The amount of MMP-2, MMP-3, and TIMP-1 mRNA was expressed relative to the abundance of β-actin mRNA. Data were presented as the fold increase over the average intensity of β-actin mRNA. The treatment with T3 significantly increased the mRNA expression of 303-bp MMP-2 and 400-bp MMP-3 in the cells compared with those in untreated cultures (P < 0.05), whereas the expression of 385-bp TIMP-1 in the cells treated with T3 was comparable with that in untreated cultures. Experiments were repeated four times with similar results for each. Lane 1, Untreated cultures; lane 2, T3 (10−8m)-treated cultures; lane 3, negative control. Each value is expressed as the mean ± sd. *, P < 0.05. n.s., Not significant.
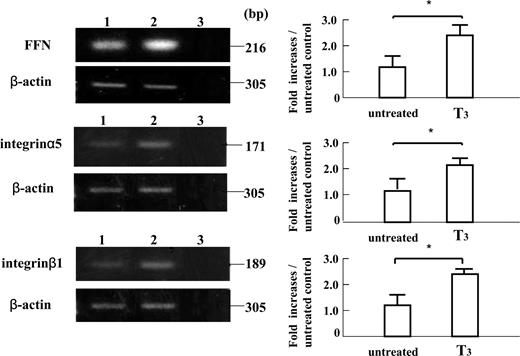
The mRNA expressions of FFN, integrin α5, and integrin β1 in cultured early placental EVTs after 24-h subsequent culture on FN-precoated dishes, as assessed by quantitative RT-PCR. First strand cDNA was synthesized from total RNA extracted from cultured early placental EVTs after 24-h subsequent culture. Each 0.1 μg cDNA was subjected to RT-PCR as described in Materials and Methods. The 216-bp PCR product specific for FFN, the 171-bp PCR product specific for integrin α5, the 189-bp PCR product specific for integrin β1, and the 305-bp PCR product specific for β-actin were detected. The amounts of FFN, integrin α5, and integrin β1 mRNA was expressed relative to the abundance of β-actin mRNA. Data were presented as the fold increases over the average intensity of β-actin mRNA. The treatment with T3 significantly increased the mRNA expression of 216-bp FFN, 171-bp integrin α5, and 189-bp integrin β1 compared with those in untreated cultures (P < 0.05). Experiments were repeated four times with similar results for each. Lane 1, Untreated cultures; lane 2, T3 (10−8m)-treated cultures; lane 3, negative control. Each value is expressed as the mean ± sd. *, P < 0.05.
Discussion
In our previous studies it has been demonstrated that 10−8m T3 acts as a biological amplifier of differentiated trophoblast endocrine function, including progesterone, estradiol, human chorionic gonadotropin, and hPL production by cultured early placental villous trophoblasts, and either higher or lower concentrations of T3 exert attenuated effects. Because the dose of 10−8m T3 is within the reported physiological range of circulating levels of T3 in human plasma, it is highly possible that thyroid hormone at the optimal concentration plays a physiological role as an enhancer of trophoblast endocrine function (30). Recent research efforts have focused on the regulation of EVT’s invasion of the decidua. Little information is available, however, regarding the effects of T3 on the invasive potential of EVTs. Thus, we investigated the direct effects of the optimal concentration of T3 (10−8m) on the invasive potential and expression of integrins and MMPs in cultured early placental EVTs.
Human trophoblast differentiation along the invasive pathway has been well characterized by immunohistochemistry (1, 37). The cells switch in situ from a proliferative state in the proximal part of the cell column to an invasive, nonproliferative phenotype at the distal part of the cell column (38–41). This is associated with changes in cell to cell contact (42–44), integrin expression (45–47), epidermal growth factor (EGF) receptor expression (43, 48), and soluble factor expression (1, 47). Signals from the ECM, transduced by integrins, have been shown to mediate alterations in cell shape, adhesion, and migration (24). The present study has revealed that the treatment with T3 (10−8m) significantly increased the number of invading EVTs using Matrigel invasion assay. Moreover, the present study has demonstrated that the treatment with T3 (10−8m) enhanced not only the protein expression of MMP-2 and MMP-3 assessed by immunocytochemical and Western immunoblot analyses, but also the mRNA expression of MMP-2, MMP-3, FFN, and integrin α5β1 assessed by RT-PCR analyses. The main target of MMP-2 is collagen IV (1, 37), which is abundant in all parts of ECM. The main target of MMP-3 is FN, which is more abundant with an increase in the depth of ECM, and collagen IV (1, 37). The synthesis of FFN facilitates the migration of EVTs into the uterine ECM (48–50). The interaction between integrin α5β1 and FN contributes significantly to the attachment and invasion of EVTs to uterine ECM (24). We have demonstrated for the first time that T3 (10−8m) promotes the invasion of EVTs through up-regulating the expression of integrins and MMPs in vitro cultures of early placental EVTs.
Matsuo et al. (51) demonstrated that cultured early placental villous trophoblasts were capable of producing an EGF-like substance and that T3 enhanced the production of the EGF-like substance by cultured early placental villous trophoblasts. This suggests that EGF may serve as a signal in regulating placental growth and function in synergy with T3 in human early placenta. Bischof et al. (52) demonstrated using zymography that leukemia inhibitory factor inhibited the secretion of MMP-2 by cultured EVTs without affecting the secretion of FFN. Meisser et al. (53) demonstrated using zymography and enzyme immunoassays that TNF-α increased MMP-9 activity, but decreased MMP-2 and FFN activities in EVTs, whereas TGF-β inhibited MMP-2 and MMP-9 activities in those cells. Castellucci et al. (54) demonstrated using immunocytochemical and RT-PCR analyses that leptin increased the secretions of immunoreactive MMP-2 and FFN by EVTs. It is, therefore, likely that unlike the leukemia inhibitory factor, TNF-α, and TGF-β, T3 stimulates the expression of MMP-2, MMP-3, FFN, and integrin α5β1. Taking these ideas into account, our observations presented in this study may reinforce the possibility that the stimulatory effects of T3 (10−8m) on the invasive potential of early placental EVTs may be mediated in part by local factors such as integrins and MMPs produced by EVTs. Additional studies will be necessary to determine the molecular mechanism by which T3 stimulates the expression of integrins and MMPs in EVTs.
The trophoblast cell undergoes a change in cell surface phenotype during the differentiation into the extravillous lineage (55–59) with loss of integrin α6β4 and rapid up-regulation of other integrins, including the FN receptor α5β1 (24). EVTs require a matrix to attach to the plastic dishes and survive in culture in vitro as described previously by several investigators (32, 33, 36, 60). One of the matrices used to make the in vitro culture of EVTs possible is FN, which is abundant with increasing depth of ECM and therefore presents the similarities with the matrix present around the invasive EVTs in the decidua (1).
Actually, in the present study, we demonstrated that the use of FN-precoated dishes is appropriate for the isolation and subsequent culture of EVTs in vitro. After 1.5-h subculture on FN-precoated dishes, almost all cultured cells expressed CK7, which is a marker for trophoblast (61, 62), whereas some cells expressed hPL and ErbB2, which are specific markers for both EVT and S cells (33, 46), as well as ErbB1, which is a specific marker for both C and S cells (33, 46). These findings indicate that with 1.5-h subculture, the cells adherent to FN-precoated dishes were not sufficiently purified to obtain EVTs from villous trophoblasts. After 48-h subculture, more than 99% of the cultured cells adherent to FN-precoated dishes expressed CK7, hPL, and ErbB2 protein, but not ErbB1 protein. In addition, we noted that the expression of erbB2 mRNA was stable, whereas the expression of erbB1 mRNA decreased remarkably after 24-h subculture compared with that after 1.5-h subculture. These results show a complete purification of EVTs after 48-h subculture in FN-precoated dishes. This is supported by the fact that all cells attached to FN-precoated dishes observed in the present study were mononuclear, because EVTs never fuse. We believe that the present experiments evaluating the effects of the optimal concentration of thyroid hormone (10−8m T3) were performed with a well defined population of purified EVTs obtained by adherence to FN-precoated dishes, followed by the subculture for 48 h.
In conclusion, we demonstrated that the use of FN-precoated dishes is an appropriate tool for the isolation and purification of human early placental EVTs, and that treatment with the optimal concentration of thyroid hormone (10−8m T3) increases the number of invading cells through Matrigel Transwells and the expression of integrins and MMPs in cultured early placental EVTs. It, therefore, seems likely that T3 (10−8m) may augment the invasive potential of EVTs into the decidua through up-regulating the expression of integrins and MMPs in those cells. This may explain, at least in part, the crucial role of an adequate supply of maternal thyroid hormone in the maintenance of early pregnancy and suggest the implication of maternal thyroid hormone insufficiency in early pregnancy loss. Further studies will be necessary to determine the precise molecular mechanism by which T3 regulates the expression of integrins and MMPs in early placental EVTs.
This work was supported in part by Grant-in-Aid for Scientific Research 12877263 from the Japanese Ministry of Education, Science, and Culture and by the Japan Association of Obstetricians and Gynecologists Ogyaa-Donation Foundation.
Abbreviations:
- CAM,
Cell adhesion molecule;
- CK7,
cytokeratin-7;
- ECM,
extracellular matrix;
- EGF,
epidermal growth factor;
- EVT,
extravillous trophoblast;
- FFN,
fetal fibronectin;
- FN,
fibronectin;
- hPL,
human placental lactogen;
- TIMP,
tissue inhibitor metalloproteinase.
