


Abstract
Pioglitazone increases the insulin sensitivity of peripheral tissues and may provide an alternative first-line treatment for type 2 diabetes. This study compared metabolic control in drug-naive type 2 diabetes patients given either pioglitazone or metformin. Eleven hundred and ninety-nine patients with poorly controlled type 2 diabetes mellitus [glycosylated hemoglobin (HbA1c), 7.5–11%; normal, 4.3–6.1%] were randomized to receive either pioglitazone (≤45 mg/d) or metformin (≤850 mg, three times daily). HbA1c, fasting plasma glucose (FPG), insulin levels, total cholesterol (TC), high density lipoprotein cholesterol (HDL-C), low density lipoprotein cholesterol, triglycerides, free fatty acids, and urinary albumin/creatinine ratio were measured. Mean HbA1c decreased in both treatment groups from baseline to wk 52 (−1.4% and −1.5%). Significantly greater mean reductions in FPG were observed in the pioglitazone group (−45.0 mg/dl; −2.5 mmol/liter) than in the metformin (−39.6 mg/dl; −2.2 mmol/liter) group (P = 0.016). Favorable changes in triglycerides and HDL-C were more pronounced with pioglitazone. Although low density lipoprotein cholesterol and TC levels increased with pioglitazone, TC/HDL-C ratios decreased similarly with both treatments. The urinary albumin/creatinine ratio was reduced by 19% with pioglitazone treatment, but remained unchanged with metformin therapy (−1%; P = 0.002). There was an increase in body weight of 1.9 kg in the pioglitazone group and a decrease of 2.5 kg in the metformin group. The overall frequency of adverse events was similar between treatment groups, but adverse event profiles were different between treatment groups. HbA1c reduction is similar after pioglitazone and metformin monotherapies, but differences in FPG, plasma lipids, and adverse effects between the two compounds may influence decision-making in individual prescribers.
AS SHOWN IN the United Kingdom Prospective Diabetes Study, type 2 diabetes is characterized by an inexorable progression of glucose control deterioration (1). Both β-cell dysfunction and insulin resistance are core defects in the progression of type 2 diabetes and the associated metabolic syndrome (2).
Metformin lowers plasma glucose concentrations while simultaneously decreasing plasma insulin and may act by decreasing hepatic glucose production, increasing splanchnic and hepatic glucose utilization, and having a secondary effect on insulin resistance (3–7). The metabolic effects of metformin may be due to its ability to phosphorylate and activate AMP-activated protein kinase (8). The thiazolidinedione pioglitazone, is a peroxisome proliferator-activated receptor agonist that affects regulators of carbohydrate and lipid metabolism (9). Pioglitazone reduces insulin resistance by enhancing the action of insulin, thereby promoting glucose utilization in peripheral tissues, suppressing gluconeogenesis, and reducing lipolysis (10, 11).
In a 26-wk clinical trial comparing pioglitazone monotherapy in a dose range of 15–45 mg/d with placebo in patients with type 2 diabetes, pioglitazone treatment resulted in significant improvements in glycosylated hemoglobin (HbA1c; 0.6–2.5% decrease) and fasting plasma glucose [FPG; 29.6–55.9 mg/dl (1.64–3.11 mmol/liter) decrease] and appeared to confer additional benefits with respect to lipid parameters [significant improvements in triglycerides (TG) and high density lipoprotein cholesterol (HDL-C) levels] and fasting insulin [decrease of 2.1–4.0 μU/ml (12–24 pmol/liter)] (12). A meta-analysis of metformin monotherapy in prospective, randomized, controlled trials of 6- to 52-wk duration documented mean reductions of 1.2% in HbA1c, 23.4 mg/dl (1.3 mmol/liter) in FPG, and 3.8 μU/ml (22 pmol/liter) in insulin compared with sulfonylureas (13). The mean changes in lipid parameters were small, and as expected, there was a significant mean decrease in body weight (−1.2 kg).
We have compared the effects of pioglitazone with metformin on metabolic variables in type 2 diabetes patients naive to oral hypoglycemic therapy. To determine any additional benefits, we also evaluated the effects on lipid profiles, hyperinsulinemia, and glucose disposal during oral glucose tolerance tests (OGTT).
Patients and Methods
Design and patients
This parallel-group, double-blind study recruited 1199 patients from 167 centers in 12 European countries. Patients, aged 35–75 yr, with type 2 diabetes inadequately treated with diet alone were randomized to receive either pioglitazone or metformin. Male and female patients were eligible for study if they had HbA1c between 7.5% and 11% with stable or worsening glycemic control for at least 3 months. Main exclusion criteria were prior use of glucose-lowering pharmacotherapy and specific contraindications to either drug. Corticosteroids and β-blockers were permitted if treatment commenced at least 4 wk before screening. At study entry, antihypertensive agents, except thiazides, were allowed dependent on clinical need. Lipid-lowering agents were also permitted.
Institutional review boards approved the protocol, and all patients gave written informed consent before study entry. The study was conducted in accordance with the Declaration of Helsinki and Good Clinical Practice Guidelines of the European Community.
Treatment
Patients were instructed to adhere to a disease- and weight-orientated diet throughout the study. Dietary advice was given at baseline, with the target of body weight normalization and supply of individually appropriate calories and nutrients. If body weight increased more than 5% at any stage or HbA1c increased to greater than 9% after completed dose titration, patients were given additional intensive dietary counseling. Patients were randomized centrally using block randomization. A computer-generated list was administered centrally via a telephone randomization and resupply service. The study medication was identified by pack numbers. Patients entered a 12-month treatment period consisting of a 12-wk forced titration period and a 40-wk maintenance period. Patients received either up to 45 mg pioglitazone with metformin placebo once daily or 850 mg metformin with pioglitazone placebo up to three times daily. Patients started with 30 mg pioglitazone or 850 mg metformin. Dose levels were increased, maintained, or decreased at 4, 8, and 12 wk according to tolerability. The dose reached at wk 12 was fixed for the rest of the study. The goal of the forced titration was to reach the individual maximum tolerated dose as quickly as possible.
Efficacy and safety measurements
The analysis of all blood samples was carried out by a central laboratory (Covance Central Laboratory Services SA, Geneva, Switzerland). HbA1c was measured at baseline and every 4–8 wk up to wk 52. Mean HbA1c values at wk 0 (or last available pretreatment value within the previous 2 wk) were taken as baseline. Secondary efficacy end points included changes in FPG and insulin together with lipid profiles [total cholesterol (TC), HDL-C, low density lipoprotein cholesterol (LDL-C), TG, and free fatty acids (FFAs)]. Adverse events (AEs), laboratory tests, blood pressure, and weight were determined throughout the study. At selected centers, C peptide and proinsulin levels were measured, and a standard OGTT using 75 g glucose was performed at baseline and wk 52. Blood samples were drawn for the determination of glucose and insulin before and 30, 60, 90, 120, and 180 min after ingestion.
Statistical analysis
A noninferiority design was used in this study. Sample size was based on the study objective to disprove the null hypothesis that pioglitazone was inferior to metformin in terms of reduction in HbA1c. Based on a 5% significance level and a statistical power of 90%, a sample size of 450 patients in each treatment group was required. Analysis of the primary efficacy end point was performed on an intention to treat (ITT) last observation carried forward basis using an analysis of covariance model with the factor treatment group and the covariant baseline HbA1c (single slope model). The primary variable, HbA1c, was analyzed by a formal noninferiority analysis using 0.2% as the difference between groups in change in HbA1c, which would indicate the limit of noninferiority. The contrasts between adjusted means were considered, and two-sided 90% confidence intervals (CIs) were calculated. The upper limit of the CI was used to determine whether the criterion for noninferiority had been met. A one-sided t test with an α level of 5% was performed.
Treatment effects on secondary efficacy parameters were analyzed using an analysis of covariance model similar to the primary model for HbA1c, with baseline as covariate. Two-sided t tests were used to compare treatments using 95% CIs and α set at 5%. Data were log-transformed if results were not normally distributed. Descriptive statistics were used to summarize changes in body weight, demographics, baseline characteristics, and AEs. All AEs were classified according to MedDRA terminology, and the relationship to the study drug was assessed by the investigator for each individual event at the time that the event occurred.
Results
The disposition of the 2145 patients screened for the study is shown in Fig. 1. Over 80% of the patients took their study medication for at least 52 wk. There were no major differences between the treatment groups with respect to the primary reason for discontinuation. Gastrointestinal disorders led to the withdrawal of nine patients (1.5%; three withdrew due to diarrhea) in the pioglitazone group compared with 15 patients (2.5%; nine withdrew due to diarrhea) in the metformin group. General disorders and administration site disorders led to the withdrawal of nine patients (1.5%; five withdrew due to edema) in the pioglitazone group and two patients (0.3%) in the metformin group. Nervous system disorders (mainly headache and dizziness) led to 10 withdrawals (1.7%) in the pioglitazone group compared with two (0.3%) in the metformin group. Two patients in the metformin group (0.3%) withdrew due to abnormal liver function tests.
Disposition of 2145 patients screened for the study.
Characteristics of the treatment groups
Baseline characteristics were similar in the two treatment groups (Table 1). At the end of the titration period, the mean dose of pioglitazone was 43 mg, and that of metformin was 2124 mg. More patients reached the maximum dose with pioglitazone (85.9%) than metformin (61.6%). Some 34.5% of pioglitazone-treated patients and 33.3% of metformin-treated patients were also taking agents acting on the renin-angiotensin system, primarily angiotensin-converting enzyme inhibitors (31% and 29%, respectively). Eleven percent of patients in the pioglitazone group and 10% of patients in the metformin group received lipid-lowering therapy.
Baseline demographics and clinical characteristics of randomized population, including dose of study medication at the end of the titration period
| Pioglitazone (n = 597) | Metformin (n = 597) | |
|---|---|---|
| Gender (M/F) | 314/283 | 345/252 |
| Mean age± sd [yr (range)] | 57 ± 9.4 (35–75) | 56 ± 9.3 (35–75) |
| Duration of diabetes± sd [yr (range)] | 3.4 ± 4.3 (0.0–31.2) | 3.1 ± 3.8 (0.1–34.6) |
| Mean weight± sd [kg (range)] | 88.2 ± 15.5 (50.0–149.0) | 89.7 ± 16.6 (54.5–147.0) |
| Mean BMI (kg/m2) | 31.2 ± 4.9 (19.8–51.6) | 31.4 ± 5.2 (21.2–50.4) |
| Mean HbA1c (%) | 8.7 ± 1.0 (5.0–11.5) | 8.7 ± 1.0 (6.5–11.7) |
| Mean FPG (mg/dl) | 205.4 ± 48.8 (104.5–394.6) | 203.6 ± 50.0 (39.6–382.0) |
| No. of patients at end of titration (%) | 553 (92.6) | 550 (92.1) |
| Pioglitazone [no. (%)] | ||
| 30 mg | 78 (14.1) | |
| 45 mg | 475 (85.9) | |
| Metformin [no. (%)] | ||
| 850 mg | 65 (11.8) | |
| 1700 mg | 146 (26.5) | |
| 2550 mg | 339 (61.6) |
BMI, Body mass index.
Efficacy
Glycemic control.
Mean HbA1c levels decreased from 8.69% at baseline to 7.28% (−1.41%) at wk 52 in patients receiving pioglitazone. Patients receiving metformin showed a decrease in HbA1c from 8.68% at baseline to 7.18% (−1.50%) at wk 52 (Fig. 2A). The maximum response was observed for both treatment groups after 32 wk and was maintained thereafter to wk 52. For both the ITT and per protocol populations, the upper limit of the 90% confidence interval of the adjusted mean difference in HbA1c (pioglitazone − metformin) did not extend beyond the predefined value (0.2%); hence, noninferiority of pioglitazone with respect to metformin was proven.
HbA1c (A; percentage) and FPG (B; mg/dl) during 12-month treatment with pioglitazone and metformin in the ITT population (mean ± sd). To convert mg/dl to mmol/liter, multiply mg/dl by 0.0555.
FPG decreased from 205.4 mg/dl (11.4 mmol/liter) at baseline to 160.4 mg/dl (8.9 mmol/liter) at wk 52 for those receiving pioglitazone compared with a reduction from 203.6 mg/dl (11.3 mmol/liter) to 164.0 mg/dl (9.1 mmol/liter) in the metformin group (Fig. 2B). The estimated mean treatment difference was −5.4 mg/dl (−0.3 mmol/liter) in favor of pioglitazone (P = 0.016).
Fasting insulin levels
In the metformin group, there was almost no change in fasting insulin (−0.3 μU/ml; −2 pmol/liter), whereas with pioglitazone, fasting insulin was reduced by −2.4 μU/ml (−14 pmol/liter) from baseline to wk 52. The treatment difference was statistically significant (P < 0.0001; Fig. 3). Mean 32,33 split proinsulin decreased from baseline in both groups. Larger mean decreases from baseline were observed in the pioglitazone group [C peptide, −0.2 ng/ml (−0.07 nmol/liter) vs. 0.1 ng/ml (0.03 nmol/liter); 32,33 split proinsulin, −1.2 μU/ml (−7.2 pmol/liter) vs. −1.1 μU/ml (−6.6 pmol/liter); for pioglitazone and metformin, respectively], but these differences were not statistically significant (Fig. 3).
Change in fasting insulin (μIU/ml), C peptide (ng/ml), and 32,33 split proinsulin (μIU/ml) from baseline to last value. To convert μIU/ml to pmol/liter, multiply μIU/ml by 6.945; ng/dl to nmol/liter, multiply mg/dl by 0.33.
OGTT
OGTTs were performed in a total of 195 patients receiving pioglitazone and 187 patients receiving metformin (Fig. 4). The mean incremental area under the curve between 0–3 h (AUC0–3 h) of plasma glucose above fasting levels was similar in both treatment groups during the baseline OGTT (347.7 vs. 362.2 mg/h·dl in the pioglitazone and metformin groups, respectively). The significant reduction from baseline to wk 52 in mean incremental AUC0–3 h of plasma glucose in the pioglitazone group (−90.1 mg/h·dl) was more than twice that in the metformin group (−41.4 mg/h·dl; P < 0.001). The mean incremental AUC0–3 h of insulin above fasting levels was similar in both treatment groups during the baseline OGTT (61.6 vs. 59.1 μIU/h·ml in the pioglitazone and metformin groups, respectively). The mean incremental AUC0–3 h of insulin during the OGTT performed at wk 52 was not different from the baseline OGTT in the pioglitazone group (increase of 3.1 μIU/h·ml), but increased above baseline in the metformin group by 33.5 μIU/h·ml (P = 0.049).
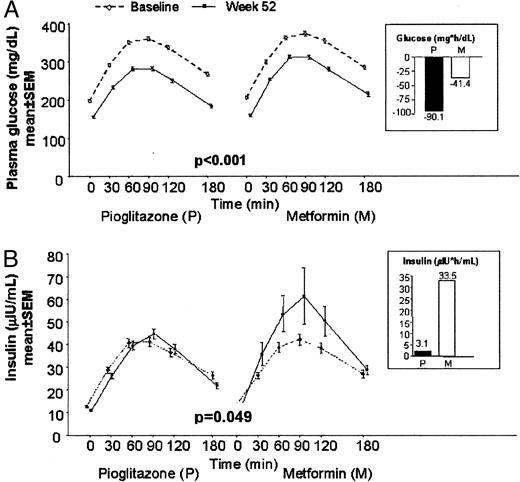
Plasma glucose (A; mg/dl) and insulin (B; μIU/ml) levels during the OGTT in the ITT population with complete baseline and end of study OGTT data. Insets show change in incremental AUC0–3 h from baseline to wk 52. To convert mg/dl to mmol/liter, multiply mg/dl by 0.0555; μIU/ml to pmol/liter, multiply μIU/ml by 6.945.
Lipid profiles
Only 11% of patients were receiving lipid-lowering therapy during the study. Lipid changes after pioglitazone or metformin treatment are shown in Fig. 5. At wk 52, estimated mean TG levels were approximately 54.0 mg/dl (0.61 mmol/liter; 19%) lower than baseline in the pioglitazone group compared with decreases of 26.6 mg/dl (0.3 mmol/liter; 10%) in the metformin group, a difference that was statistically significant (P = 0.001). HDL-C significantly increased by 6.18 mg/dl (0.16 mmol/liter) in the pioglitazone group compared with 3.09 mg/dl (0.08 mmol/liter) in the metformin group (P = 0.001). LDL-C was calculated using Friedewald’s formula (14), which is not valid when TG levels are more than 4.5 mmol/liter. Where TG levels were more than 4.5 mmol/liter, no LDL-C values were determined. LDL-C increased by 10.4 mg/dl (0.27 mmol/liter) in the pioglitazone group compared with −4.63 mg/dl (−0.12 mmol/liter) in the metformin group (P = 0.001), and TC increased by 9.65 mg/dl (0.25 mmol/liter) in the pioglitazone group compared with −4.25 mg/dl (−0.11 mmol/liter) in the metformin group. The mean change in non-HDL-C levels was 3.47 mg/dl (0.09 mmol/liter) in the pioglitazone group and −7.33 mg/dl (−0.19 mmol/liter) in the metformin group. At wk 52, the TC/HDL-C ratio was 8% lower than at baseline in both treatment groups (P = 0.9 between treatment groups).
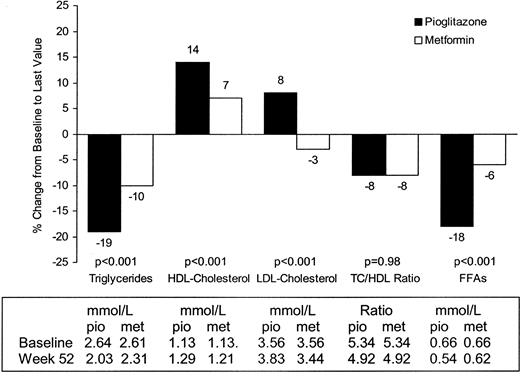
Change in lipid profile from baseline to last value. To convert mg/dl to mmol/liter, multiply mg/dl by 0.0113 (TG), 0.0259 (cholesterol), or 0.0354 (FFAs).
Decreases from baseline FFA levels of −3.39 mg/dl (−0.12 mmol/liter) and 1.13 mg/dl (−0.04 mmol/liter) were seen in the pioglitazone and metformin groups, respectively (P < 0.001).
Urinary albumin/creatinine ratio
After 52 wk, the estimated mean urinary albumin/creatinine ratio decreased significantly by 19% in the pioglitazone group and by 1% in the metformin group (P = 0.002).
Blood pressure showed a tendency to decrease throughout the study in both treatment groups; however, changes from baseline were not statistically significant in either group (P > 0.05).
Tolerability
AE incidence was comparable between the two treatments. Three hundred and sixteen patients in the pioglitazone group and 346 patients in the metformin group reported AEs. The most commonly reported AEs are shown in Table 2. Overall, cardiovascular AEs were reported in 3.7% of pioglitazone- and 3.9% of metformin-treated patients. A higher proportion of AEs was judged as severe with metformin (7.4%) than with pioglitazone (4.9%). There were three deaths in the pioglitazone group and two in the metformin group, but none was judged to be treatment related.
AE (reported by ≥2% of patients in either treatment group)
| MedDRA preferred terms | Pioglitazone (n = 597) | Metformin (n = 597) | ||
|---|---|---|---|---|
| No. | % | No. | % | |
| GI disorders | ||||
| Diarrhea NOS | 19 | 3.2 | 66 | 11.1 |
| Nausea | 14 | 2.3 | 25 | 4.2 |
| General disorders | ||||
| Edema, peripheral | 27 | 4.5 | 10 | 1.7 |
| Edema NOS | 13 | 2.2 | 1 | 0.2 |
| Fatigue | 8 | 1.3 | 12 | 2.0 |
| Infections and infestations | ||||
| Bronchitis NOS | 11 | 1.8 | 14 | 2.3 |
| Influenza | 14 | 2.4 | 22 | 3.7 |
| Nasopharyngitis | 25 | 4.2 | 19 | 3.2 |
| Musculoskeletal | ||||
| Arthralgia | 9 | 1.5 | 12 | 2.0 |
| Back pain | 14 | 2.3 | 17 | 2.8 |
| Nervous system disorders | ||||
| Dizziness | 14 | 2.3 | 11 | 1.8 |
| Headache NOS | 26 | 4.4 | 14 | 2.3 |
| Respiratory disorders | ||||
| Pharyngitis | 15 | 2.5 | 9 | 1.5 |
| Vascular disorders | ||||
| Hypertension NOS | 15 | 2.5 | 17 | 2.8 |
| AE more common in one group | ||||
| Liver function tests | 0 | 0 | 9 | 1.5 |
| Weight gain | 6 | 1.0 | 0 | 0 |
GI, Gastrointestinal; NOS, not otherwise specified.
Decreases in mean hemoglobin were observed for both treatment groups (0.59 g/dl pioglitazone group, 0.44 g/dl metformin), but were not considered clinically significant. Mean changes in hematocrit were small and comparable between treatment groups (−1.8% pioglitazone, −1.7% metformin).
Mean changes in liver enzymes were greater with pioglitazone than with metformin. Alanine transaminase decreased by 6.4 U/liter in the pioglitazone group compared with 2.8 U/liter in the metformin group, and fewer pioglitazone patients (0.9%) than metformin patients (2.2%) had an increase in alanine transaminase to more than 3 times the upper limit of normal. γ-Glutamyltransferase decreased in both groups, but to a greater extent with pioglitazone (pioglitazone, 9.5 U/liter; metformin, 6.4 U/liter). Alkaline phosphatase levels decreased similarly (pioglitazone, 8.5 U/liter; metformin, 9.6 U/liter), whereas aspartate aminotransferase showed little change from baseline. Two of the 597 patients treated with pioglitazone and one of the 597 in the metformin group developed hepatotoxity. The study drug was discontinued in all three patients, and they recovered within 2 wk of development of jaundice.
Mean body weight in the pioglitazone group increased by 1.9 kg, with the rate of weight increase most marked up to wk 42, then plateauing thereafter. With metformin, there was a decrease in mean body weight by 2.5 kg at wk 52. Mean waist circumference remained unchanged in the pioglitazone group and decreased by 3 cm in the metformin group.
Discussion
Pioglitazone has been demonstrated to provide clinically equivalent and statistically noninferior control of HbA1c over a 1-yr period in comparison with metformin, currently the agent of choice for the treatment of obese patients with type 2 diabetes (15). The decrease in HbA1c is almost identical to previously reported HbA1c lowering in patients treated with metformin in a U.S. multicenter trial (15). Significantly greater reductions in FPG and glucose excursions were seen with pioglitazone compared with metformin. However, the absolute differences in fasting and postload glucose values with pioglitazone did not seem to be reflected in differences in HbA1c values obtained with the two treatments.
OGTT data suggest that pioglitazone reduces insulin resistance to a greater degree than metformin, which may have implications when both compounds are being considered for combination therapy (16). Both were found to decrease 32,33 split proinsulin and C peptide, and although this may reflect improvement of underlying β-cell function, fasting proinsulin has also been found to be correlated strongly to measurements of insulin resistance and an independent predictor of cardiovascular mortality (17).
The advent of hypoglycemic drugs that modulate lipids has focused attention on the potential benefits of these compounds on diabetic lipoprotein abnormalities. This study was sufficiently powered to show superiority for either compound for effects on lipids. Pioglitazone treatment reduced TG levels by 19% and increased HDL-C by 14%, nearly double the improvements with metformin. TGs, although not independent risk factors for coronary heart disease (CHD), induce adverse modifications in other lipoproteins (18). Additionally, high TG levels may produce a procoagulant state that may further increase cardiac risk (19); hence, pioglitazone may confer an additional therapeutic effect. However, the quantitative contribution of low HDL-C to CHD risk is difficult to assess. Nonetheless, low HDL-C signals the presence of other lipoprotein abnormalities, especially small LDL particles and increased very low density lipoprotein cholesterol levels, and a larger rise in HDL-C may reflect CHD risk reduction. A decrease in LDL-C levels by metformin cannot be overlooked and may represent a benefit of metformin even though the effects on other lipid parameters were not as potent. Decreases in TC/HDL-C ratios were similar, suggesting an overall risk reduction with both pioglitazone and metformin (20). In contrast to metformin, which reduced LDL-C and TC, pioglitazone increased LDL-C, an effect that has been attributed to a shift from small dense particles to larger, potentially less atherogenic particles (21), and which may be secondary to the substantial TG lowering. TGs have been shown to be strong predictors of CHD events in patients with low (as is the case in the population in this study) compared with higher LDL-C levels (17, 19), and the effect of pioglitazone on TG levels is potentially more significant.
Increases in FFAs are associated with the pathogenesis of enhanced gluconeogenesis, β-cell failure, muscle insulin resistance, and endothelial dysfunction (22–24). Both pioglitazone and metformin reduced FFAs in this study, but changes were greater with pioglitazone.
Increased urinary albumin excretion, endothelial dysfunction, and chronic inflammation are interrelated processes that progressively develop in parallel and are strongly associated with increased mortality risk (25). A recent study has documented that glitazones reduce markers of inflammation in type 2 diabetes (26). In this study, albumin/creatinine ratios were reduced by 19% with pioglitazone, but remained unchanged with metformin (−1%; despite similar numbers of patients receiving angiotensin-converting enzyme inhibitors in each treatment group), confirming previous observations in which troglitazone, but not metformin or glibenclamide, reduced urinary albumin excretion rate (27, 28).
Both drugs were well tolerated. Edema was the most frequently occurring adverse event with pioglitazone. In line with previous reports, the severity was recorded as mild (12, 29). Edema has been linked to the precipitation of cardiac failure (30); however, no association was demonstrated in this study. Consistent with previous findings, treatment-related AEs with metformin were primarily gastrointestinal disturbances (31).
Both metformin and pioglitazone were shown to cause small decreases in Hb and hematocrit, and this effect with metformin has not previously been published. There is evidence that elevated hematocrit levels may be associated with CHD and mortality, and this raises the possibility that some of the well known effects of the thiazolidinediones on Hb and hematocrit may decrease cardiovascular risk (32).
Liver tests suggested that liver function improved with both treatments, but that effects were greater with pioglitazone. This may be due to a decrease in visceral and liver fat content (10). Because nonalcoholic steatohepatitis is associated with insulin resistance (33) and has been reported in some patients with type 2 diabetes (34), an improvement in liver function tests might be beneficial in this subset of patients.
The increase in mean body weight in patients treated with pioglitazone was not accompanied by an increase in waist circumference and was less than that in previous reports (30). This smaller than previously documented increase in body weight with pioglitazone may be due to greater adherence to dietary advice. Weight increases did not appear to be associated with any deterioration of metabolic control and may reflect an increase in sc fat that should not pose any cardiovascular risk (35, 36). Metformin treatment resulted in an overall weight decrease in nearly 70% of patients, which may be of particular benefit to overweight patients.
This study demonstrates that pioglitazone and metformin have similar effects on HbA1c over 1 yr of treatment. However, effects on FPG, postprandial glucose excursion, insulin sensitivity, and lipid profile differ between the treatments. Although pioglitazone and metformin treatments were well tolerated, the side-effect profile of the two drugs was different in this study population. This first comparison of long-term treatment with either pioglitazone or metformin, therefore, demonstrates that both are effective therapies for initial treatment of type 2 diabetes. Differing mechanisms of action also suggest that combination therapy could be comple-mentary.
Acknowledgements
We thank the following study investigators: M.-A. Allione-Bucchiet (France), P. Amar (France), I. Andersone (Latvia), L. Androne (Romania), P. Angeli (France), E. Austenat (Germany), T. Aven (Sweden), A. Bagdonas (Lithuania), F. Bannout (Germany), M. Baranyai (Hungary), J. Bardos (Hungary), A. Barnea (Romania), G. Biesenbach (Austria), M. Bismuth (France), T. Bolcsvolgyi (Hungary), A.-M. Borissova Ivanova (Bulgaria), G. Borras-Draber (Germany), G. Bourdila (France), M. H. Bouzo (Germany), J.-P. Boyes (France), H. Brandström (Sweden), K. Brennan (Ireland), C. Burguier (France), P. Burke (Ireland), E. E. Candrea (Romania), O. Carewicz (Germany), G. Carlgren (Sweden), H. Chabeuf (France), D. Cuisinier (France), P. Daly (Ireland), H.-G. Dammann (Germany), J. Danilevicius (Lithuania), M. David (France), O. Decloux (France), M. Dietrich (Germany), A. Dimitrova (Bulgaria), L. Dohnalova (Czech Republic), T. Drescher (Germany), M. E. Falagas (Greece), P. Faludi (Hungary), C. Fivel (France), I. Foldesi (Hungary), G. Forcada (France), J. L. Gabrielli (France), D. Glatzel (Germany), J. Gomez (France), F. Grivet (France), W. Grosskopf (Germany), H. Hager (Germany), A. Hamann (Germany), M. Haslbeck (Germany), T. Heffernan (Ireland), P. Hellke (Sweden), A. Heufelder (Germany), T. Hidvegi (Hungary), M. Hindamian (France), F. Holmer (Sweden), E. Homsy (Germany), J. L. Huberschwiller (France), K. Irsigler (Austria), B. Jacobsson (Sweden), J. Janousek (Czech Republic), C. Jaursch-Hancke (Germany), B. Jegere (Latvia), G. Jermendy (Hungary), E. Juhasz (Hungary), P. Kaldrimidis (Greece), N. Katsilambros (Greece), L. Kautzky (Hungary), R. Kenefick (Ireland), Z. Kerenyi (Hungary), D. Kleimberg (France), R. Klein (Germany), A. Klimovicova (Czech Republic), H. Koch (Germany), M. Koch (Germany), L. Koeva (Bulgaria), M. Komrskova (Czech Republic), P. Koskinen (Sweden), J. Kotous (Czech Republic), J. Krumpa (Germany), G. Kurta (Hungary), M. Kvapil (Czech Republic), C. Leclerc (France), C. Ledevehat (France), D. Lejay (France), J. Lichte (Germany), A. Lindgren (Sweden), P. Löfdahl (Sweden), A. Lundstedt (Sweden), M. Malinsky (France), B. Mangan (Ireland), P. Marmor (France), C. McCarthy (Ireland), M. Melichar (Czech Republic), A. Melidonis (Greece), C. Meresse (France), C. Meyer (France), M. Mikolaiczik (Germany), U. A. Mueller (Germany), B. Mullins (Ireland), S. Murray (Ireland), I. Naudts (Germany), G. Neuwirth (Hungary), B. Nordenhäll (Sweden), A. Norkus (Lithuania), A. Norrby (Sweden), J. Olsovsky (Czech Republic), J. Orgiazzi (France), T. Oroszlan (Hungary), E. O’Sullivan (Ireland), L. Paillard (France), P. Panczel (Hungary), M. Pavlova (Bulgaria), M. Petkova (Bulgaria), G. P. Piaditis (Greece), B. Polhem (Sweden), M. Protich (Bulgaria), E. Racicka (Czech Republic), S. Raptis (Greece), E. Restorp (Sweden), G. Rose (Sweden), Z. Rusavy (Czech Republic), T. Russev (Bulgaria), J. Rybka (Czech Republic), D. Sacareau (France), C. Salamon (Hungary), F. Saudek (Czech Republic), P. Schatzkine (France), R. Schipper (Germany), H. Schlichthaar (Germany), D. Schmitz (France), J. Schoelmerich (Germany), G. Scholz (Germany), N. Singh-Anand (Germany), A. Sjöstrand (Sweden), P. Skala (Czech Republic), O. Skarpova (Czech Republic), P. Skoghagen (Sweden), J. P. Souquiere (France), V. Stalte (Latvia), S. Stonkus (Lithuania), J. Szegedi (Hungary), I. Szilagyi (Romania), J. Takacs (Hungary), G. Tamas (Hungary), R. Tengel (Sweden), C. Thivolet (France), P. Triot (France), V. Urbanavicius (Lithuania), B. Valenta (Hungary), A. Valtere (Latvia), G. Vandorfi (Hungary), E. Varanauskiene (Lithuania), H. Vavrikova (Czech Republic), A. Venalis (Lithuania), Y. Verhille (France), M. Verquerre (France), B. Vizina (Latvia), J. Y. Vogel (France), V. von Behren (Germany), P. Voros (Hungary), R. Warncke (Germany), A. Warnet (France), R. Weitgasser (Austria), A. Widman (Sweden), A. Winter (Austria), and H. Witt (Germany).
Abbreviations:
- AE,
Adverse event;
- AUC0–3 h,
area under the curve between 0–3 h;
- CHD,
coronary heart disease;
- CI,
confidence interval;
- FFA,
free fatty acid;
- FPG,
fasting plasma glucose;
- HbA1c,
glycosylated hemoglobin;
- HDL-C,
high density lipoprotein cholesterol;
- ITT,
intention to treat;
- LDL-C,
low density lipoprotein cholesterol;
- OGTT,
oral glucose tolerance test;
- TC,
total cholesterol;
- TG,
triglyceride.
