


Abstract
Purpose: There is growing evidence that interaction between stromal and tumor cells is pivotal in breast cancer progression and response to therapy. Based on earlier research suggesting that during breast cancer progression, striking changes occur in CD10+ stromal cells, we aimed to better characterize this cell population and its clinical relevance.
Experimental Design: We developed a CD10+ stroma gene expression signature (using HG U133 Plus 2.0) on the basis of the comparison of CD10 cells isolated from tumoral (n = 28) and normal (n = 3) breast tissue. We further characterized the CD10+ cells by coculture experiments of representative breast cancer cell lines with the different CD10+ stromal cell types (fibroblasts, myoepithelial, and mesenchymal stem cells). We then evaluated its clinical relevance in terms of in situ to invasive progression, invasive breast cancer prognosis, and prediction of efficacy of chemotherapy using publicly available data sets.
Results: This 12-gene CD10+ stroma signature includes, among others, genes involved in matrix remodeling (MMP11, MMP13, and COL10A1) and genes related to osteoblast differentiation (periostin). The coculture experiments showed that all 3 CD10+ cell types contribute to the CD10+ stroma signature, although mesenchymal stem cells have the highest CD10+ stroma signature score. Of interest, this signature showed an important role in differentiating in situ from invasive breast cancer, in prognosis of the HER2+ subpopulation of breast cancer only, and potentially in nonresponse to chemotherapy for those patients.
Conclusions: Our results highlight the importance of CD10+ cells in breast cancer prognosis and efficacy of chemotherapy, particularly within the HER2+ breast cancer disease. Clin Cancer Res; 18(4); 1004–14. ©2012 AACR.
In this study, we aimed at getting further insight on the molecular characteristics differentiating tumor-associated stroma from normal stroma and to investigate the potential clinical relevance of the breast stroma. We specifically concentrated on CD10+ cells as the most striking changes in gene expression were reported during breast cancer progression in this particular cell population from the breast cancer microenvironment (Allinen and colleagues). We highlighted that this stroma contribution, defined by the CD10+ stroma signature, has a clinical relevance, particularly in patients with HER2+ tumors, where it is associated with worse prognosis and potentially to nonresponse to chemotherapy. We believe that these results may help to better identify those patients for whom the cancer stroma is, at least partly, responsible of their worse prognosis and for whom the stroma should thus be specifically targeted.
Introduction
Tumor epithelial cells are surrounded by the tumor microenvironment, which is composed of the extracellular matrix (ECM) and various other cell types, such as endothelial cells, (myo)fibroblasts, and leukocytes. There is growing evidence that interaction of these other cell types with tumor cells is pivotal in breast cancer progression and response to therapy.
Several studies have provided insight on the molecular characteristics differentiating tumor-associated stroma from normal stroma (1–5). Allinen and colleagues were the first to conduct systematic profiling of different stromal cell types isolated through cell type–specific cell surface markers and magnetic beads (1). Their work suggested that during cancer progression, striking changes in gene expression occurred in almost every cell type, with the most dramatic and consistent changes (other than in the malignant epithelial cells) detected in cells that were characterized by the surface marker CD10, which encompasses myoepithelial cells and myofibroblasts. Later, 2 research groups conducted exploratory global gene expression analyses of the tumor microenvironment using laser capture microdissected (LCM) tumor and normal breast samples (2, 3). Both publications reported important expression changes in genes related to the ECM in the cancer stroma compared with the normal stroma. In addition, the study by Ma and colleagues also compared the epithelium and stromal compartment of ductal carcinoma in situ (DCIS) and invasive ductal carcinoma (IDC) lesions: They observed no significant differences at the transcriptome level between the malignant epithelium of DCIS and IDC, whereas they found a significant number of genes differentiating DCIS and IDC lesions in the stromal compartment (2).
Very recently, Bauer and colleagues (4) analyzed gene expression profiles from paired cancer-associated and normal fibroblasts from 6 breast tumor specimens isolated through a method similar to the one developed by Allinen and colleagues (1) followed by short-term cell culture. They identified a list of 31 genes differentiating cancer-associated from normal fibroblasts. On the basis of these genes and consistent with previous work, they suggested that the cancer-associated fibroblasts contribute to cancer growth and progression by enhancing ECM production, promoting stromal–epithelial paracrine signaling, and altering steroid hormone metabolism.
However, the analysis of the clinical relevance of stroma-related molecular signatures has been relatively limited to date. Finak and colleagues identified a stromal signature [referred to henceforth as stroma-derived prognostic predictor (SDPP)] by comparing gene expression profiles of tumor stroma and matched normal stroma isolated by LCM from 53 primary breast tumors (5). SDPP predicted outcome in several published whole tumor–derived gene expression data sets and especially in the HER2+ breast cancer subgroup. In parallel, using a prototype-based clustering approach, we developed a stroma metagene (referred to henceforth as PLAU) as a list of genes specifically correlated to PLAU, which was associated with prognosis only in the HER2+ breast cancer subgroup (6). Using a similar approach, Farmer and colleagues defined their stromal metagene (referred to henceforth as DCN) as a list of genes correlated to decorin; DCN was able to predict chemoresistance in patients treated with preoperative chemotherapy (7).
In this article, we aimed to gain further knowledge about the breast cancer stroma cellular compartment, which, according to Allinen and colleagues (1), undergoes the most extensive changes when compared with normal breast tissue. We therefore compared CD10+ cells issued from tumor and normal breast tissue on the basis of an approach similar to the one used by Allinen and colleagues but differing from that used by Bauer and colleagues (4) in the sense that we did not submit the isolated cells to short-term culture. We further aimed to characterize the cell type–specific contribution of the stroma by carrying out coculture experiments and to investigate the 3-fold clinical relevance of our findings, with regard to the DCIS/invasive transition, breast cancer prognosis, and prediction of the efficacy of preoperative chemotherapy. From the results, it appears that CD10+ cells may be particularly clinically relevant in HER2+ breast cancer.
Materials and Methods
Patients
Patients with IDC were recruited for the study at the Institut Jules Bordet, Brussels, Belgium. Breast tissues were obtained at the time of the surgery. Because Finak and colleagues showed that stroma surrounding histologically normal ducts from tumor specimen and stroma isolated from reduction mammoplasties were highly similar at the gene expression level (8), we used histologically normal tissue distant from at least 2 cm from the tumor as normal breast tissue.
The study was approved by the ethics committee of the Institut Jules Bordet. All patients included in this study signed the consent form.
Isolation of CD10+ cells
To isolate CD10+ cells from breast tissues, we established a procedure similar to the one described by Allinen and colleagues (1) and schematically illustrated in Supplementary Fig. S1. Briefly, we mechanically dissociated carcinoma and normal samples using a scalpel, after confirmation of the pathologist (D. Larsimont) on the tumor and normal nature of the sample. Fragments were incubated in a 12-well culture dish with a mixture of collagenase type IV (LS004189; Worthington Biochemical Corporation) in X-VIVO 20 Serum-free Medium (BE04-448Q; Cambrex) in a 37°C incubator with 5% CO2 with constant agitation for 1 to 2 hours, depending on the size of the sample. Following dissociation, the digestion product was filtered through a BD Falcon Cell Strainer (352340; BD Biosciences) using piston syringe and washed with X-VIVO medium. The EpCAM+ cells were first isolated using the Human EpCAM Selection Kit, followed by a depletion of the CD45+ cells using the Human CD45 Depletion Kit from the same company. The CD10+ cells were further isolated from the unicellular suspension using human CD10+ selection kit. All selection kits were from STEMCELL Technologies and were used according to the manufacturer's instructions. The purity of the population was checked by flow cytometry [antibodies CD326 (EpCAM) FITC from Milteny Biotec, APC anti-human CD45 from Pharmingen, and PE mouse anti-human CD10 from Pharmingen].
Cell cultures
The 7 breast cancer cell lines MCF-7, T47D, LY2 (ER+/HER2−), MDA-MB-231, (ER−/HER2−), SKBR3, MDA-MB-361, BT474 (HER2+), and the CD10+ cell lines HS57BST (myoepithelial cells) and CRL2564 (fibroblasts) were obtained from the American Type Culture Collection (ATCC). They were cultured according to the media indicated by ATCC, except the HS57BST, which we did not stimulate with epidermal growth factor (Supplementary Table S1). Mesenchymal stem cells (MSC) were isolated from bone marrow from a single female healthy donor and cultured as reported previously (9).
For the coculture experiments (each possible combination of a breast cancer cell line with a specific type of CD10+ cells), the CD10+ cells were first plated in Petri dishes until subconfluence. At that time, the epithelial cells were added on top of the CD10+ cells. After 4 days of coculture, the CD10+ and epithelial cells were isolated using flow cytometry. The CD10+ cells used as control were not cocultured with breast cancer cells. All coculture experiments were done in duplicate. Fluorescence-activated cell sorting (FACS) was then carried out with a 3-laser FACSAria I flow cytometer (Becton Dickinson) at high pressure (70 psi) using the same anti-CD10 and anti-EpCAM antibodies as above. Compensation adjustments were conducted with cocultures stained with a single color. Double staining on each cell culture was used as a positive control for the gating strategy. Cells were sorted in 1.5-mL collection tubes containing 350 μL of lysis buffer (Absolutely RNA Microprep Kit, Agilent).
Gene expression data
We used the Human Genome U133-2.0 plus GeneChips to generate the gene expression data. More information about the experiments can be found in Supplementary Methods.
Gene expression data were normalized by using the quantile normalization method of Affy package version 1.28.0 (10) of the Bioconductor software project (http://www.bioconductor.org/). Subsequently, data were log2 transformed. Microarray data are deposited in the Gene Expression Omnibus database under accession number GSE27120.
The CD10+ signature
To select the genes for the CD10+ signature, we carried out a class comparison of the tumor-associated CD10+ cells (n = 28) with CD10+ cells from normal breast tissues (n = 3) using the 10% most variant probe sets across the entire series (n = 5,467 probe sets). The Student t test was used to compare the mean values of probes across groups. To overcome the problem due to multiple testing, a false discovery rate (FDR; ref. 11) approach was used to select the top probe sets.
We first selected those genes with an absolute fold change (FC) ≥ 1.5 and FDR < 0.05 for describing the genes differentially expressed and an absolute FC > 4 and FDR < 0.01 to generate the CD10+ signature, respectively.
Using those genes, the CD10+ signature was computed for each sample as
where xi is the expression of a gene included in the set of genes of interest and wi is either +1 or −1 depending on the increased or decreased expression in tumor-associated CD10 cells versus CD10 cells from normal breast tissue, respectively. When different probe sets represented the same gene, only the most variant one was included in the signature. Also, when a probe set did not match an Entrez GeneID, it was not included in the signature.
The F test was used to compare the variances of genes of the CD10+ signature between tumor-associated and normal CD10+ cells.
The list of genes in the CD10+ stromal signature and the corresponding annotations have been submitted to GeneSigDB (12).
Analysis of gene expression data
For the cell culture data, the Kruskal–Wallis test was applied to identify the differently expressed probes (i) between cell lines and (ii) between the subtypes of each cell line. The Wilcoxon test was used to compute the differences between the different cell lines. It was not applied to the analyses within the different cell lines because the number of samples was too small for these comparisons. To overcome the problem due to multiple testing, the FDR approach was used for the different CD10+ stroma signature genes, except again for comparisons within the different cell lines due to the small number of samples (11). The fold change was calculated by the average difference between those groups.
To assess whether stromal genes can also be expressed in breast cancer epithelial cells, we examined the data from the invasive breast cancer cell lines from Neve and colleagues (13). We first classified the cell lines according to the main 3 molecular subgroups of breast cancer: estrogen receptor–negative (ER−)/HER−, HER2+, and ER+/HER2− based on the ER and HER2 mRNA expression levels using the SCMGENE classifier as implanted in the genefu R package.
To evaluate the implication of the stromal genes in the transition from DCIS to invasive breast cancer, we used publicly available gene expression data from matched DCIS/invasive cancer (14).
To investigate the prognostic value of the CD10+ stroma signature, gene expression data sets were retrieved from public databases or authors' websites. We used normalized data (log2 intensity in single-channel platforms or log2 ratio in dual-channel platforms) as published by the original studies. Hybridization probes were mapped to Entrez GeneID as described (15), using RefSeq and Entrez database version 2007.01.21. When multiple probes were mapped to the same GeneID, the one with the highest variance in a particular data set was selected. Seven public breast cancer microarray data sets were used (refs. 16–24; Supplementary Table S2). Because we wanted to evaluate the pure prognostic value of the signature, we only considered patients who did not receive any systemic anticancer treatment. Distant metastasis-free survival was used as survival endpoint. However, when distant metastasis-free survival was not available, we used relapse-free survival. We censored the survival data at 10 years to have comparable follow-up across the different studies as described (6, 16, 25). The HR was estimated for each data set separately and combined using the inverse variance-weighted method (26). The Kaplan–Meier product-limit estimator was used to display time-to-event curves. The tertiles for the signature scores were computed within each breast cancer molecular subtype separately to estimate the signature's prognostic value for each subtype.
To investigate the prognostic value of the CD10+ stroma signature when treating patients with anthracycline-based chemotherapy, we used gene expression data treated in the TOP trial, NCT00162812 (27). In this trial, patients with ER− tumors were treated with anthracycline (epirubicin) monotherapy, allowing investigating anthracycline-specific predictors. The area under the curve and its confidence interval (CI) were estimated through the concordance index (28), and its one-sided P value was determined by the Wilcoxon rank-sum test.
All the analyses were conducted using R software version 2.9.2 (www.r-project.org).
Results
Development of the CD10+ stroma signature
Using an approach similar to that of Allinen and colleagues (1), we were able to isolate tumor-associated CD10+ cells (n = 28) as well as CD10+ samples from normal breast tissues (n = 3). The characteristics of the tumors are shown in Table 1.
Characteristics of the tumors used to develop the CD10+ stroma signature
| Patients, % (n) (N = 28) | |
|---|---|
| Age, y | |
| ≤50 | 7 (25) |
| >50 | 21 (75) |
| Tumor size, cm | |
| ≤2 | 11 (39) |
| >2 | 16 (57) |
| Missing | 1 (4) |
| Nodal status | |
| N0 | 14 (50) |
| N1–N3 | 14 (50) |
| Histologic grade | |
| G1 | 3 (11) |
| G2 | 11 (39) |
| G3 | 14 (50) |
| ER status | |
| Negative | 4 (14) |
| Positive | 24 (86) |
| Progesterone receptor status | |
| Negative | 12 (43) |
| Positive | 16 (57) |
| HER2 status | |
| Negative (IHC 1+ or 2+ or not amplified by FISH) | 26 (93) |
| Positive (3+ or amplified) | 2 (7) |
Abbreviation: IHC, immunohistochemistry.
A comparison between gene expression profiles of tumor-associated CD10+ cells and CD10+ cells isolated from normal breast tissue (FDR < 0.05 and |FC| > 1.5; Supplementary Table S3) revealed 242 probe sets that were significantly differentially expressed, including genes involved in matrix remodeling, such as matrix metalloproteinases (MMP3, MMP11, and MMP13), fibronectin, collagens (COL1A2, COL8A1, COL10A1, and COL11A1). This list also included genes related to skeletal development such as periostin, matrilin-3, CHRDL1, a BMP-4 antagonist, and the integrin-binding sialoprotein (Supplementary Table S4). We computed the gene overlap between this list and the various published signatures (Supplementary Table S5). All signatures showed some gene overlap except SDPP. COL10A1, the gene which in our data set was the most differentially expressed between tumor and normal CD10+ cells, was present in all signatures, except PLAU and SDPP.
To develop a signature, we selected from the above reported comparison the most differentially expressed genes, with |FC| ≥ 4 and FDR < 0.01 (Supplementary Table S6). Twelve genes were selected on the basis of these criteria. The reason we developed a signature based on a small number of genes was to facilitate its potential future translation into the clinic by evaluating a small number of genes using a reverse-transcriptase PCR assay for instance. Figure 1 illustrates the expression of these genes according to the molecular subtype of the tumors from which the CD10+ cells were isolated. This figure shows that the vast majority of CD10+ cells isolated from tumors show a clear differential expression pattern, with PCOLCE2, GPX3, and ADH1B being overexpressed in normal associated CD10+ cells compared with the tumor-associated CD10+ cells and the remaining genes being overexpressed in the tumor-associated CD10+ cells. For some tumors, the expression pattern of CD10+ cells does not seem to be very different from that of the normal CD10+ cells, as it is clearly the case for sample IJB_CD10_27, suggesting that in some tumors, these cells might still exhibit the same expression pattern as in normal breast tissue.
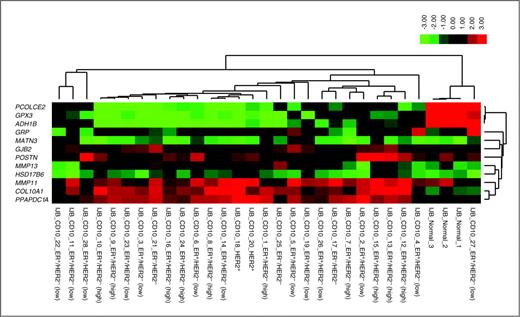
Heat map representing the expression of the genes included in the CD10+ stroma signature in the normal and tumor-associated CD10+ cells (red represents high expression values and green low expression values). The molecular subtypes of the tumor samples are illustrated for each tumor sample. ER and HER2 were both assessed by immunohistochemistry. ER+/HER2− (low) were ER+/HER2− tumors of grade 1 or 2 and ER+/HER2− (high) were ER+/HER2− tumors of grade 3.
Heat map representing the expression of the genes included in the CD10+ stroma signature in the normal and tumor-associated CD10+ cells (red represents high expression values and green low expression values). The molecular subtypes of the tumor samples are illustrated for each tumor sample. ER and HER2 were both assessed by immunohistochemistry. ER+/HER2− (low) were ER+/HER2− tumors of grade 1 or 2 and ER+/HER2− (high) were ER+/HER2− tumors of grade 3.
Because Bauer and colleagues (4) surprisingly reported a higher variability of global gene expression in normal fibroblasts than in fibroblasts present in the tumor, we sought to compare the variance of the genes from our signature between the tumor-associated CD10+ cells and the CD10+ cells from normal breast tissues. We found that in contrast to findings of the study of Bauer and colleagues, the variances for the genes from our signature are nominally higher for the tumor-associated CD10+ cells than for the normal CD10+ cells, although the P value generated by the F test was only significant for half of the genes (Supplementary Table S7). This confirms that the variability of these specific genes is higher in tumor-associated CD10+ than in normal CD10+ cells.
Characterization of the CD10+ stroma signature
To investigate whether our CD10+ stroma signature genes were exclusively expressed in stromal cells, we examined their expression levels in the breast cancer cell line data set made available by Neve and colleagues (13). We observed that for half of the genes included in the signature (ADH1B, COL10A1, GRP, HSD17B6, MATN3, and MMP13), the expression level was below or around the 25th percentile of the expression values of the array and did not show any variation across the different cell lines, suggesting that high expression values of those genes are most probably not derived from the epithelial compartment. However, some exceptions were observed. For example, GPX3 expression levels were superior to the median of the arrays for almost half of the cell lines and we observed significant variation across the cell lines. The expression levels of MMP11 were above the 25th percentile; however, no strong variation was observed across the cell lines. PCOLCE2 showed low expression in all cell lines except in the cell lines characterized by the absence of ER and HER2 expression. POSTN showed low expression in all cell lines except in HCC38, HS578T, and BT549, cell lines also characterized by the negativity of the hormone receptors. Detailed results are available in Supplementary Fig. S2.
Several studies have revealed that some CD10+ stroma cells can be derived from bone marrow–derived progenitor cells, such as MSCs, which can be mobilized into the circulation and incorporated into the tumor microenvironment. To analyze the contribution of the different CD10+ cell types to the CD10+ signature, we conducted coculture analyses of representative breast cancer cell lines (see Materials and Methods) with different stroma cell types expressing CD10+ [(myo)fibroblast and myoepithelial cell lines, as well as MSCs obtained from 1 healthy donor]. We then generated gene expression data of the different CD10+ stromal components which were and were not (controls) cocultured with the different breast cancer cell lines. We first compared the CD10+ stroma signature scores according to the different CD10+ cell types which were or were not cocultured with the different breast cancer cell lines (Fig. 2, top left). We observed significantly different signature scores in the 3 different cell types (P values: fibroblasts/MSCs = 0.002, MSCs/myoepithelial cells = 8 × 10⁻⁹, fibroblasts/myoepithelial cells = 3 × 10⁻⁸), with the highest scores observed in the MSCs followed by the fibroblasts. However, within each CD10+ cell type, we also observed differences in the CD10+ stroma signature scores between the different cocultured and the control cells (Fig. 2).
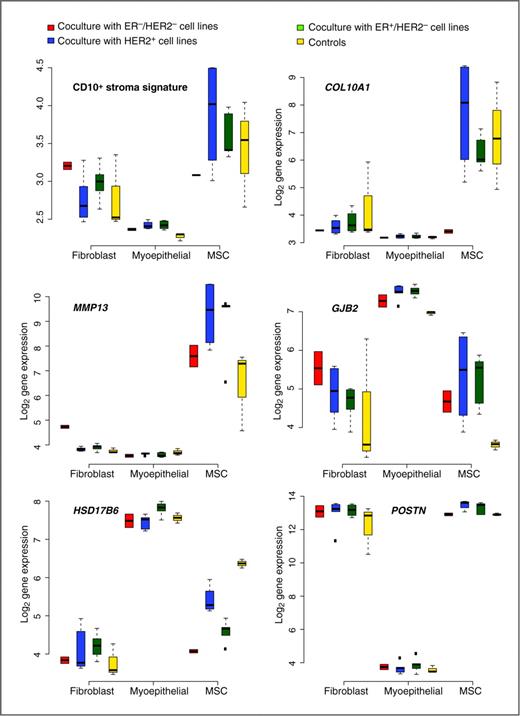
Box plots representing the CD10+ stroma signature and the CD10+ signature genes in the different CD10+ cell types (cocultures with different subtypes of breast cancer cell lines and controls are represented separately).
Box plots representing the CD10+ stroma signature and the CD10+ signature genes in the different CD10+ cell types (cocultures with different subtypes of breast cancer cell lines and controls are represented separately).
Second, we compared the expression levels of the different CD10+ stroma signature genes according to the different CD10+ cell types. We observed significant changes in expression levels of 11 of 12 signature genes, with the myoepithelial cells differing most from the fibroblasts and MSCs (Supplementary Table S8). For 7 of 12 genes, expression levels were significantly different between the MSCs and the fibroblasts. Figure 2 and Supplementary Fig. S3 illustrate the expression values of the CD10+ stroma signature genes for the control and different coculture conditions for each CD10+ cell type. Globally, COL10A1 and MMP13 clearly have higher expression values in MSCs than in the 2 other cell types, with the exception of COL10A1 of MSCs cocultured with ER−/HER2− cell lines. On the contrary, GJB2 and HSD17B6 display higher expression values in myoepithelial cells than in the other cell types, whereas high expression levels of ADH1B and POSTN can clearly be attributed to the fibroblasts and MSCs.
Third, we analyzed the differences in gene expression of the 12 genes from the signature within each CD10+ subtype to see whether the expression of those genes varied among the controls, the cocultures with HER2+, the cocultures with the ER−/HER2−, and the cocultures with the ER+/HER2− breast cancer cell lines. There were significant differences observed for some genes (Fig. 2; Supplementary Fig. S3 and Supplementary Tables S9–S11 for the results regarding the fibroblasts, MSCs, and myoepithelial cells, respectively). Fibroblasts cocultured with ER−/HER2− breast cancer cells expressed higher levels of MMP13 than in the other fibroblasts. In MSCs, we observed lower levels of HSD17B6 in the cocultures than in the control MSCs. Also, higher levels of POSTN were observed in MSCs cocultured with HER2+ and ER+/HER2− breast cancer cells than in the remaining MSCs, with the highest levels observed when cocultured with the HER2+ cells. In the myoepithelial cells, we observed higher levels of GJB2 and MATN3 in the cocultured cells than in the control myoepithelial cells. Also, we observed a slight increase in HSD17B6 expression when cocultured with ER+ breast cancer cells compared with the remaining myoepithelial cells.
Of note, no significant differences in cell proliferation were noticed in the coculture experiments, except that the ER+/HER2− breast cancer cell lines were more proliferative after coculture with fibroblasts than were the other breast cancer cell lines cocultured with fibroblasts (Supplementary Fig. S4).
Clinical relevance of the CD10+ stroma signature
Because it has repeatedly been suggested that the progression of DCIS to invasive breast cancer could be strongly dependent upon changes in the stroma (reviewed in ref. 29), we aimed at investigating whether our CD10+ stroma signature was able to differentiate DCIS samples from their associated invasive counterparts. To this end, we used publicly available gene expression data from DCIS and their associated invasive counterparts isolated by LCM (14).
Interestingly, as illustrated in Fig. 3, our CD10+ stroma signature was able to differentiate DCIS from invasive cancer. This figure also illustrates the different expression levels of the signature genes in DCIS and IDC.

Box plots representing the CD10+ stroma signature score and the individual gene expression values between the IDC and DCIS groups from Schuetz and colleagues (14) originally profiled on the Affymetrix HG U133Plus2.0. *, P < 0.01; **, P < 0.001.
Box plots representing the CD10+ stroma signature score and the individual gene expression values between the IDC and DCIS groups from Schuetz and colleagues (14) originally profiled on the Affymetrix HG U133Plus2.0. *, P < 0.01; **, P < 0.001.
Recently, 3 studies have investigated the clinical relevance of global gene expression signatures describing the stromal compartment in invasive breast cancer (5–7) using gene expression data generated from whole breast tumor tissue comprising both tumor epithelium and stroma. To assess whether our CD10+ stromal signature could predict outcomes from such data, we analyzed available microarray data generated from whole tumors of 1,140 patients who did not receive any systemic treatment (16–24). Elevated values of our CD10+ stromal signature were associated with poor clinical outcome (HR, 2.17; CI, 1.23–3.85; P = 0.008) in the HER2+ subpopulation only (Supplementary Table S12). The Kaplan–Meier curves are illustrated in Fig. 4. In agreement with previous reports, SDPP, PLAU, and DCN also carried prognostic information in this same HER2+ population (Supplementary Table S12). The CD10+ stroma signature was only correlated with PLAU and DCN but not with SDPP (Supplementary Table S13), suggesting that these signatures represent different biologic signals.

Survival curves for untreated patients stratified by the CD10+ stroma signature: all patients (A), ER−/HER2− (B), HER2+ (C), and ER+/HER2− (D).
Survival curves for untreated patients stratified by the CD10+ stroma signature: all patients (A), ER−/HER2− (B), HER2+ (C), and ER+/HER2− (D).
To test whether the clinical relevance of the CD10+ stroma signature was specific for the HER2+ subgroup, we carried out interaction tests. The CD10+ signature was significantly different in the HER2+ subgroup compared with the ER+/HER2− subgroup (P = 0.028) and showed a trend toward significance compared with the ER−/HER2− subgroup (P = 0.051).
We further wanted to evaluate whether our stroma signature was correlated with response/resistance to chemotherapy or whether it was just associated with the natural history of the disease. Collagens, which are part of the transport barrier imposed by the ECM and also part of our signature (COL10A1 and COL11A1), have been shown to be, at least partly, responsible for decreased penetration of therapeutic agents in the tumor (30). We therefore investigated the association of our CD10+ signature with the pathologic complete response status in the well-defined prospective TOP trial (27). Patients in this data set had ER− tumors and were treated with preoperative epirubicin only. Similar to the above results, we observed that the CD10+ stroma signature was only significantly associated with lack of pathologic complete response in patients with HER2+ tumors (Fig. 5). Consistent with the fact that our signature was correlated with PLAU and DCN, these 2 signatures also were associated with pathologic complete response in this subgroup of patients but not SDPP (Supplementary Table S14). However, these results should be interpreted with caution given the small number of patients in this HER2+ subgroup (n = 30).

Receiver operator characteristic curve analysis of the ability of the CD10+ stroma signature and the A-score to discriminate patients with pathologic complete response from patients with residual disease in the TOP trial: all ER− patients (A), ER−/HER2− (B), and ER−/HER2+ (C). AUC, area under the curve.
Receiver operator characteristic curve analysis of the ability of the CD10+ stroma signature and the A-score to discriminate patients with pathologic complete response from patients with residual disease in the TOP trial: all ER− patients (A), ER−/HER2− (B), and ER−/HER2+ (C). AUC, area under the curve.
Discussion
In this article, we compared gene expression profiles from tumor-associated CD10+ cells with CD10+ cells from normal breast tissue. Our hypothesis was that by selecting only CD10+ cells, we investigated a more uniform stromal compartment at the cellular level compared with previous publications, which used LCM to dissect the stroma fraction and which thus considered the stroma as a uniform entity (2, 3, 5). Of note, the recent publication of Bauer and colleagues (4) used a similar approach as the one we used, except that they subjected the isolated cells to short-term culture, with the potential disadvantage that it could mask some of the originally existing differences in gene expression and that they did not investigate their potential clinical relevance.
As in previous descriptive studies, we found many genes associated with the remodeling of the ECM, such as matrix metalloproteases, collagens, and fibronectin. Interestingly, we also observed a certain number of genes linked with skeletal development such as periostin (POSTN). It has been shown that POSTN is undetectable in normal breast tissues, whereas elevated levels are observed in breast cancer tumor samples. It has also been shown that serum POSTN levels are elevated in patients with breast cancer with bone metastases from breast cancer (reviewed in ref. 31). Another recent report showed, using a well-defined animal model, that bone metastases from breast cancer are associated with a marked overexpression of this stroma-derived POSTN (32).
From the comparison between tumor and normal CD10+ cells, we selected those genes with the highest fold change and lowest corrected P value to develop the CD10+ stroma signature. To assess whether the genes included in this signature could also be expressed by breast cancer epithelial cells, we examined the cell line data from the study of Neve and colleagues (13). We observed that half of the genes (ADH1B, COL10A1, GRP, HSD17B6, MATN3, and MMP13) showed a homogeneous low expression in the different breast cancer cell lines, suggesting that these genes are not expressed in cultures of breast cancer cells. Because CD10+ cells encompass different cell types, (myo)fibroblasts, myoepithelial cells, and MSCs, we carried out cell line coculture experiments to understand the contribution of each cell type. Although the cell culture results should be taken with caution as these coculture experiments are just an artificial representation of these CD10+/breast cancer epithelial cell interactions, 3 main messages could be derived from the cell culture analyses. First, in our comparison of the CD10+ stroma signature scores between the 3 CD10+ cell types, we observed that the highest signature scores were observed in MSCs, followed by the fibroblasts. We further also observed changes in the signature score within each cell type following coculture with breast cancer cells. Second, comparison of the expression levels of the different CD10+ stroma signature genes between the 3 CD10+ cell types clearly shows that all 3 cell types contribute to the CD10+ stroma signature. Indeed, some genes are more highly expressed both in fibroblasts and MSCs (POSTN and ADH1B), whereas other genes are more expressed in myoepithelial cells only (such as GJB2, PCOLCE2, and HSD17B6) or MSCs only (MMP13 and COL10A1). Third, by investigating the expression levels of the different CD10+ stroma signature genes within each CD10+ cell type, we observed that the expression of some genes clearly differed in some coculture conditions compared with controls: MMP13 for the fibroblasts; HSD17B6 and POSTN for the MSCs; and GJB2, MATN3, and HSD17B6 for the myoepithelial cells.
We further aimed to investigate the clinical relevance of our CD10+ stroma signature. We first showed that our signature and the majority of its genes were able to discriminate DCIS from associated invasive samples. This finding confirms previous findings that suggested that progression from in situ to invasive breast cancer may not be due to the changes in the epithelial cells but dependent upon the tumor microenvironment (2, 33, 34).
Using gene expression data generated from whole tumor tissue, we further showed that our CD10+ stromal signature carried prognostic value in the HER2+ breast cancer population of patients with untreated breast cancer only. We observed similar results for the previously developed stroma signatures, the PLAU module, and SDPP (6, 7). A moderate but significant correlation was observed between our CD10+ stroma signature and the PLAU module, although it was generated using a completely different approach (CD10+cells isolation vs. in silico development using whole tumor tissue gene expression data). On the contrary, no correlation was observed between our signature and SDPP, although both were developed from the comparison of tumor versus normal stroma. One possible reason for this is that the authors who used SDPP isolated the stroma using LCM and therefore most probably considered additional cell types. Why would this stroma signature be particularly relevant in HER2+ breast cancer? In these HER2+ cancers, the activity of HER2 can be due to its transactivation. Cabioglu and colleagues recently suggested a novel mechanism of HER2 transactivation through CXCL12/SDF1 stimulation of the CXC4R4 chemokine receptor, and this was only in breast cancer cells that express high levels of HER2 (35). In our cell line data, we observed that MSCs and especially fibroblasts cocultured with HER2+ breast cancer cells express very high levels of CXCL12 (data not shown). Alternatively, POSTN could be playing a role in breast cancer progression of HER2+ breast cancer, as increased expression has been correlated with a worse prognosis (32) and as we observed the highest levels of POSTN in our cell culture experiments in MSCs after coculture with HER2+ breast cancer cells. However, the exact tumor–epithelium interactions explaining the specific clinical relevance of the stroma in HER2+ breast cancer still needs to be investigated and will be the focus of future research.
We recognize the limitation of our study, that is, the underrepresentation of the different molecular subgroups of breast cancer in the tumor population used for CD10+ isolation. However, to our knowledge, this is the first study that isolates a specific cellular stromal compartment, in contrast to the majority of the previous studies, which used LCM, analyzed extensively its clinical value, and further characterized it by coculture experiments.
To conclude, we believe that the comprehensive characterization of this well-defined stroma compartment reinforces the importance of tumor epithelial–stroma cell interactions in tumorigenesis. We highlighted that this stroma contribution, defined by the CD10+ stroma signature, seems particularly important in HER2+ breast tumors.
We further showed an important role of this signature in differentiating in situ and invasive cancers, in prognosis of HER2+ patients, and potentially in nonresponse to chemotherapy for those patients. Altogether, we believe that these results may help to better identify those patients for whom the cancer stroma is, at least partly, responsible for their worse prognosis and for whom the stroma should thus be specifically targeted.
Disclosure of Potential Conflicts of Interest
No potential conflicts of interests were disclosed.
Grant Support
This project was supported by the MEDIC Foundation, Les Amis de l'Institut Bordet, the “Fonds National de la Recherche Scientifique,” and the Brussels Region (Impulse Programme 2007).
The costs of publication of this article were defrayed in part by the payment of page charges. This article must therefore be hereby marked advertisement in accordance with 18 U.S.C. Section 1734 solely to indicate this fact.