


Abstract
Background. End-stage renal disease (ESRD) is associated with a markedly increased cardiac calcification burden, as reflected by computed tomography scans of the heart. Nocturnal haemodialysis (NHD) is a novel form of renal replacement therapy which has multiple physiologic effects that may affect vascular calcification, including improvements in phosphate and uraemia control. The objective of the present study is the determination of the natural history of coronary calcification progression in patients converted to NHD, and the examination of the relationships between calcification risk factors and calcification progression in these patients.
Methods. Thirty-eight ESRD patients were converted to NHD, and included in our observational cohort study. Coronary artery calcification scores (CACS) were documented at baseline and post-conversion (mean interscan duration 16±1 months). Other variables of interest included age, dialysis vintage, Framingham risk profile, phosphate binder and vitamin D usage, and plasma levels of calcium, phosphate and parathyroid hormone.
Results. Our cohort was stratified according to baseline calcification burden (minimal calcification: CACS ≤10 vs significant calcification: CACS >10). Twenty-four patients had baseline CACS ≤10. These patients demonstrated no change in coronary calcification after 1 year of NHD (from 0.7±0.5 to 6±3, P = 0.1). Fourteen patients had higher initial CACS at baseline (1874±696), and demonstrated a non-significant 9% increase over 1 year to 2038±740 ( P = 0.1). Plasma phosphate and calcium × phosphate product were significantly reduced, as were calcium-based phosphate binder and antihypertensive usage.
Conclusions. Our study is the first to document CACS progression in a cohort of NHD patients. Further analysis of the effect of NHD on the physiology of cardiovascular calcification is required.
Introduction
End-stage renal disease (ESRD) is associated with a 10–20-fold increased risk of cardiovascular (CV) mortality compared with the general population [ 1 ]. Quantifying an individual patient's CV risk has been difficult, especially with the recognition that traditional Framingham risk factors do not fully assess CV disease burden in the ESRD population [ 2 ]. Recently, non-invasive imaging techniques such as electron-beam computed tomography (EBCT) and multi-slice computed tomography (MSCT) have shown promise as the predictors of CV disease. Multiple reports have noted the value of EBCT and MSCT in the assessment of CV burden, both in the general and in the ESRD populations. In non-ESRD patients, the literature suggests that EBCT coronary calcification scores are an independent predictor of future coronary events [ 3 ]. In ESRD patients, EBCT scores have been linked to a history of myocardial infarction and angina [ 4 ], and in a mathematical model, appear to predict an increased risk of future CV events [ 5 ].
In search of novel risk factors explaining the markedly increased CV risk of the ESRD population, investigators have identified abnormalities in calcium–phosphate balance and homoeostasis as potential contributors to the abnormal vascular physiology that occurs in uraemia. Although somewhat controversial, multiple reports have linked the calcium–phosphate abnormalities of ESRD to both the markedly increased coronary calcification burden [ 4–7 ] and the increased CV mortality in these patients [ 8 , 9 ].
Nocturnal haemodialysis (NHD) is a novel form of renal replacement therapy that delivers a greatly increased dialysis dose and offers multiple clinical advantages over conventional haemodialysis (CHD), including the ability to normalize serum phosphate [ 10 ]. Given the benefits of NHD on phosphate control and uraemia, we studied the natural progression of coronary calcification in a cohort of stable patients after conversion to NHD.
Methods
A prospective cohort study with a before and an after design was performed. All patients enrolled in the NHD programmes of the Toronto General Hospital and Humber River Regional Hospital between 1998 and 2004 were considered eligible. Patients had to be either receiving CHD or peritoneal dialysis, or had to be followed by the pre-dialysis clinics of either centre to be included. The exclusion criterion was the presence of significant arrhythmia precluding ECG gating during MSCT. The protocol was approved by the Research Ethics Boards of the Toronto General Hospital and Humber River Regional Hospital.
MSCT was performed during NHD training (baseline), and at a second time point at least 6 months after conversion to NHD (ranging between 7 and 33 months). Due to the wide variation in interscan duration, the absolute change in coronary artery calcification score (CACS) for each patient was normalized assuming a linear increase in CACS over time to give the CACS standardized for a 1 year follow-up interval as previously published [ 11 ]. Absolute and relative changes in CACS were calculated. Given that the patients with established coronary calcification burden tend to progress more rapidly, patients were subcategorized according to their baseline CACS into two groups as devised by Rumberger et al. [ 12 ]: (1) those with minimal or no calcification (CACS ≤10) and (2) those with CACS >10.
Demographic data, including age at enrollment, gender, aetiology of ESRD, dialysis vintage, dialysis modality pre-conversion to NHD, Framingham risk profile and use of phosphate binders and vitamin D derivatives, was collected at the time of conversion to NHD. Usage of antihypertensives, phosphate binders and vitamin D derivatives was also reassessed at 1 year post-conversion.
Predialysis serum calcium, phosphate and parathyroid hormone (PTH) levels were measured at baseline, and also at 6 and 12 months post-conversion according to standard laboratory protocols.
Dialysis prescriptions
The CHD was performed using F80 polysulfone dialysers (Fresenius Medical Care, Lexington, MA, USA). The dialysate composition was as follows: Na + 140 mM, K + 1–3 mM, Ca 2+ 1.25–1.5 mM and
The NHD was performed using either F80 dialysers or Polyflux dialysers (Gambro Inc., Lund, Sweden). The dialysate composition was similar to that used in CHD, but often required phosphate supplementation to maintain normal plasma phosphate levels. A blood flow rate of 200–300 ml/min and a dialysate flow rate of 350 ml/min were used. For both CHD and NHD, vascular access was achieved through a long-term internal jugular catheter, an arterio-venous fistula or an arterio-venous graft.
Multi-slice computed tomography
Computed tomography (CT) scans were performed with a Toshiba Aquillion 32 multidetector scanner (Toshiba America, New York, NY, USA) with a 3 mm collimation technique. All scans were read by one of the two radiologists. In order to minimize inter-observer variability, it was mandated that the baseline and repeat scans were reviewed by the same radiologist whenever possible. In our cohort, 90% of the baseline and repeat scans were interpreted by the same observer. The inter-reader variability between the two radiologists was 5% (excluding scans with minimal calcification). Of the 10% of our study population who had two different reviews, none of the patients had significant CACS at baseline. The CACS was obtained using the area-based Agatston method [ 13 ].
Statistical analysis
Descriptive analyses are presented as mean±standard error, unless otherwise noted. All statistical tests were performed using the SPSS statistical package (SPSS-10, Chicago, IL). Student's t -test, chi-square test, the Mann–Whitney U-test and repeated measure analysis of variance were used to evaluate changes in demographic, biochemical and CACS parameters. All statistical tests were two-tailed with a P -value less than 0.05 taken to indicate significance.
Results
Thirty-eight patients were initiated on NHD (6–8 h/session, 5–6 sessions/week). 34 patients were previously on CHD, one patient was previously on peritoneal dialysis and three patients were initiated on NHD as their first renal replacement modality. The mean age at study enrolment was 43±2 years. Fifty-five percent of patients were male, and the mean dialysis vintage was 45±10 months. The aetiologies of ESRD were diverse including: glomerulonephritis ( n = 12), diabetic nephropathy ( n = 6), polycystic kidney disease ( n = 3), thrombotic microangiopathy ( n = 2), reflux nephropathy ( n = 2) and one patient each having obstructive nephropathy, drug toxicity, hypertensive nephropathy, medullary cystic disease and amyloid nephropathy, respectively. Of the remainder of our cohort, the ESRD aetiology was unknown ( n = 8). Only 16% of our cohort was known to be smokers and 18% diabetic. Initially, prior to conversion to NHD, the mean antihypertensive requirement was 2.0±0.3 medications. All patients had a baseline and a follow-up cardiac CT scan.
Coronary artery calcification
The CACS are summarized in Table 1 . Mean baseline CACS for the cohort was measured at 691±295. Over 1 year, the CACS increased non-significantly by 64±38 ( P = 0.4), representing a 9% relative increase. Twenty-four patients (63%) had minimal calcification (baseline CACS ≤ 10) at enrollment (mean CACS: 0.7±0.5), and demonstrated minimal progression over 1 year ( P = 0.1). Fourteen patients had non-minimal calcification (baseline CACS >10) at enrollment and demonstrated a non-significant progression in CACS (from 1874±697 to 2038±740, P = 0.1) or a relative increase of 9%.
Changes in CACS before and after conversion to NHD ( n = 38)
| Variables | All Patients | Baseline CACS ≤10 | Baseline CACS >10 |
|---|---|---|---|
| Mean baseline CACS (range) | 691±295 (0–8217) | 0.7±0.5 (0–10) | 1874±697 (112–8217) |
| Mean follow-up CACS (range) | 765±316 (0 to 8356) | 6±4 (0–71) | 2066±739 (179–8356) |
| ▵CACS per year | 64±38 | 5±3 | 164±98 |
| 1 year standardized CACS a | 755±315 | 6±3 | 2038±740 |
| Percentage change in CACS over 1 year | 9% | 762% | 9% |
Results are expressed as mean±SEM, median (range).
a 1 year standardized CACS refers to the change in CACS adjusted for a 1 year interval assuming a linear rate of CACS change (see Methods section).
Dialysis dose
Daily single pool Kt/V(urea) significantly increased from 1.5±0.1 at baseline to 2.4±0.1 at 1 year post-conversion ( P <0.001). Weekly single pool Kt/V(urea) also increased significantly, from 4.8±0.2 at baseline to 12.2±0.8 at 1 year post-conversion ( P <0.001).
Calcium–phosphate balance
Serum calcium levels were unchanged after 1 year of NHD (2.39±0.04 mM at baseline, 2.43±0.03 mM at 1 year, P = 0.8). Serum phosphate levels decreased significantly from 1.56±0.08 mM at baseline to 1.21±0.05 mM 1 year post-conversion ( P = 0.002). Similarly, calcium–phosphate product (3.60±0.21 mM 2 at baseline, 2.76±0.16 mM 2 at 1 year, P = 0.005) and serum PTH levels (46±9 pM at baseline, 22±5 pM at 1 year, P = 0.002) decreased significantly.
Calcium-based phosphate binder (CBPB) usage decreased significantly from 2.0±0.3 g/day to 0.4±0.2 g/day at 1 year ( P <0.007). Vitamin D analogue usage did not differ between the two time points (from 1.9±0.8 mcg/week to 1.1±0.3 mcg/week, P = 0.4). The requirement for antihypertensives decreased significantly, from 2.0±0.3 medications at baseline to 0.8±0.2 at 1 year post-conversion ( P = 0.005). Serum total cholesterol levels did not change (4.31±0.19 mM at baseline, 4.98±0.27 mM at 1 year, P = 0.6).
Effect of calcification progression risk factors
Patients with minimal baseline calcification (CACS ≤10) were compared with patients with significant calcification (CACS >10) with respect to putative calcification risk factors. The results of this comparison are summarized in Table 2 . Patients with minimal baseline CACS had shorter dialysis vintages. At baseline, there were no significant differences in age, use of antihypertensives, diabetes and smoking status. Biochemical parameters (serum calcium, phosphate, PTH and total cholesterol) did not differ between the two groups initially or at the time of follow-up.
Comparison of patients with initial minimal calcification (CACS ≤10) vs those with significant baseline calcification (CACS >10)
| Baseline CACS ≤10 | Baseline CACS >10 | P -value | ||||
|---|---|---|---|---|---|---|
| Age (years) | 41±2 | 48±3 | 0.1 | |||
| Dialysis vintage (months) | 22±5 | 84±22 | 0.01 | |||
| Diabetes status | ||||||
| Diabetic | 3 (12%) | 4 (29%) | NS | |||
| Non-diabetic | 17 (72%) | 9 (64%) | ||||
| Unknown | 4 (16%) | 1 (7%) | ||||
| Smoking status | ||||||
| Smoker (current or former) | 4 (16%) | 2 (14%) | NS | |||
| Non-smoker | 17 (72%) | 10 (71%) | ||||
| Unknown | 3 (12%) | 2 (14%) | ||||
| Total serum cholesterol (mM) | ||||||
| Baseline | 4.51±0.22 | 4.01±0.33 | 0.2 | |||
| 1 year | 5.05±0.32 | 4.87±0.32 | 0.7 | |||
| 1 year change | −0.05±0.40 | 0.85±0.22 | 0.09 | |||
| Antihypertensive use | ||||||
| Baseline | 2.0±0.3 | 2.0±0.5 | 0.9 | |||
| 1 year | 0.6±0.2 | 1.0±0.4 | 0.3 | |||
| 1 year change | −1.4±0.3 | −1.0±0.4 | 0.5 | |||
| Serum calcium (mM) | ||||||
| Baseline | 2.36±0.04 | 2.44±0.07 | 0.3 | |||
| 1 year | 2.41±0.03 | 2.45±0.05 | 0.6 | |||
| 1 year change | 0.05±0.04 | −0.02±0.05 | 0.3 | |||
| Serum phosphate (mM) | ||||||
| Baseline | 1.54±0.09 | 1.59±0.13 | 0.8 | |||
| 1 year | 1.18±0.07 | 1.25±0.07 | 0.5 | |||
| 1 year change | −0.36±0.11 | −0.35±0.17 | 1 | |||
| Serum PTH (pM) | ||||||
| Baseline | 40±7 | 57±21 | 0.5 | |||
| 1 year | 21±6 | 23±6 | 0.9 | |||
| 1 year change | −24±6 | −39±19 | 0.5 | |||
| Daily spKt/V(urea) | ||||||
| Baseline | 1.5±0.1 | 1.6±0.1 | 0.7 | |||
| 1 year | 2.4±0.2 | 2.3±0.2 | 0.8 | |||
mM: millimoles per litre; NS: not significant; pM: picomoles per litre; PTH: parathyroid hormone; spKt/V(urea): single pool Kt/V(urea).
Discussion
The present study is the first, to our knowledge, to report the natural history of coronary artery calcification progression in a cohort of patients converted to NHD. At the time of conversion to NHD, our patients displayed a wide spectrum of CACS, with a mean score of 691±295. After conversion to NHD, our cohort displayed a non-significant 1 year normalized CACS increase of 64±38, representing a 9% increase per year ( P = 0.4). By further subcategorizing our patients according to baseline CACS, we were able to demonstrate that even in patients with a significant calcification burden, a non-significant progression rate of 9% was seen. Although no large, prospective trial data has been published regarding the predictive value of coronary CT scans in ESRD patients, a mathematical model based on the recent treat-to-goal study [ 14 ] has been published that suggests that every 100 unit increase in coronary calcification score is associated with a 20% increased relative risk of a future cardiac event [ 5 ]. Given recent work demonstrating the benefits of NHD on vascular physiology [ 15 , 16 ], and preliminary data that NHD patients have lower CV admission rates when compared to CHD controls [ 17 ], the relatively low rates of coronary calcification progression seen in our study raise an interesting possibility that NHD may have an effect on CV risk as assessed by CACS.
Four studies have examined the progression of coronary artery calcification in other ESRD populations. Three of these studies involved conventional haemodialysis patients [ 11 , 14 , 18 ], while one enrolled peritoneal dialysis patients [ 19 ]. The pertinent results of these studies are summarized in Table 3 . Reported absolute change in 1 year CACS ranged between −46 and 489, while relative rates of progression ranged between −3 and 104%. Unfortunately, significant differences in study design, such as the type of CT scanner used and the scoring system used to quantify CACS, preclude a formal comparison of our results with these four reports. Similarly, study population differences in age, dialysis vintage, diabetes status, and levels of serum phosphate, PTH and total cholesterol also make accurate comparisons between our study and the literature difficult. However, despite these limitations, it is interesting to note that our NHD population, which included 14 patients with high baseline calcification and long dialysis vintages, experienced a relatively favourable rate of coronary calcification progression ( Table 3 ). Importantly, this result was achieved within the context of normalization of calcium phosphate homoeostasis and without the need for phosphate binder usage. Although preliminary, our observations raise important potential hypotheses regarding the possible physiological link between normalization of phosphate, augmentation of uraemia control and vascular calcification.
Comparison of CACS changes with previous reports a
| NHD | NHD (Baseline CACS >10) | Tamashiro et al. [ 18 ] (2001) | Chertow et al. [ 14 ] (2002) Ca salt | Chertow et al. [ 14 ] (2002) sevelamer | Stompor et al. [ 19 ] (2004) | Moe [ 11 ] (2004) | |
|---|---|---|---|---|---|---|---|
| N (follow-up CT) | 38 (38) | 14 (14) | 35 (24) | 101 (70) | 99 (62) | 61 (47) | 33 (17) |
| Age (years) | 44±12 | 48±12 | 53±14 | 56±16 | 57±14 | 53±13 | 55±11 |
| Dialysis vintage (months) | 45±61 | 84±81 | 64±69 | 43 (median) | 35 (median) | 17 (median) | 77±68 |
| % diabetics | 18% | 29% | 25% | 33% | 32% | 15% | 43% |
| Type of CT | MSCT | MSCT | EBCT | EBCT | EBCT | MSCT | MSCT |
| CACS scoring | Agatston | Agatston | Agatston | Agatston | Agatston | Agatston | Volume |
| Baseline mean CACS | 691±1796 | 1874±2607 | 449±605 | 1125±1583 | 1712±2901 | 356±877 | 482±1089 |
| Standardized 1 year mean ▵CACS | 64±231 | 164±367 | 155 | 151±471 * | −46±692 | 80±307 * | 489±697 * |
| % 1 year mean ▵CACS | 9 | 9 | 34 | 13 | −3 | 22 | 104% |
* P <0.05 comparing 1 year CACS vs baseline CACS.
a All values in this table are presented as mean±SD for comparison purposes.
CACS: coronary artery calcification scores; CT: computed tomography; NHD: nocturnal haemodialysis; SD: standard deviation; SEM: standard error of the mean.
In the present study, serum phosphate, as demonstrated in prior studies of NHD, was significantly decreased into the normal range after 1 year of NHD ( Figure 1 ). While serum calcium levels were not significantly changed over the course of 1 year, both the calcium–phosphate product and oral CBPB use were significantly decreased. Given the previously published data, suggesting a possible pathophysiologic role of phosphate in the abnormal vascular calcification seen in ESRD [ 20–23 ], the observation that the dose of CBPB is linked with the degree of calcification [ 24 ], and the results of the Treat-to-Goal study [ 14 ], it is tempting to speculate that the phosphate control achieved through NHD and the consequent ability to discontinue CBPB, may alter the abnormal coronary calcification process that occurs in ESRD.
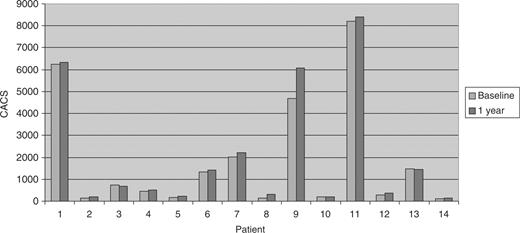
Individual CACS before and after conversion to NHD in patients with significant baseline CACS >10.
The results of our study should be interpreted within the limitations of its observational design. We did not compare our NHD cohort with a control conventional dialysis group as this pilot project, given the lack of published CACS data in NHD patients, was designed as a first step to characterize the natural progression of coronary artery calcification in patients switched to NHD. As a result, we cannot rule out the possibility that confounding factors apart from NHD conversion might have affected our observed CACS progression rate. One possibility to explain our observation is that the majority of our patients were healthier and had low baseline calcification, and as such were less likely to progress rapidly. While this may be true, our cohort had similar baseline degrees of coronary calcification when compared with the ESRD populations studied in the four other previously published studies, and even in a subpopulation of calcified patients, we were able to demonstrate a non-significant rate of coronary calcification progression. We also did not examine, in depth, the possible mechanisms by which coronary calcification progression might be altered by conversion to NHD. Multiple mechanisms, including improvements in phosphate and uraemia control, could contribute to a potential benefit of NHD on the coronary calcification process. Indeed, NHD has been shown to have multiple physiologic advantages, some of which are known or suspected to alter parameters that have been implicated in promoting vascular disease, including effects on inflammation [ 25 ] and blood pressure [ 26 ]. Other limitations of this study include: the relatively small number of patients enrolled, the short period of observation and our calculation of a standardized 1 year CACS change. Such a calculation assumes that coronary calcification progresses at a linear rate, an assumption that has been made by previous authors [ 11 ], and in the absence of data to the contrary seems reasonable.
In summary, this study is the first to document the natural history of coronary calcification progression in a cohort of NHD patients. Progression rates appear to be low, even in patients with very high baseline CACS and long dialysis vintages. Despite the limitations of this small observational cohort study, our results, when taken in the context of previous data suggesting decreased CV admission rates on NHD when compared to CHD, provide sufficient evidence to warrant the development of large, randomized, prospective trials comparing the effects of NHD to those of other renal replacement modalities on coronary calcification progression and clinical CV outcomes. Further studies of the mechanisms underlying the abnormal vascular calcification seen in ESRD are also clearly needed.
The authors would like to thank Dr Yves Provost and Dr Tae Bong Chung for their interpretation of the CT scans, and the staff of the Nocturnal Haemodialysis Clinic.
Conflict of interest statement . None declared.
References
Foley RN. Clinical epidemiology of cardiac disease in dialysis patients: left ventricular hypertrophy, ischemic heart disease, and cardiac failure.
Cheung AK, Sarnak MJ, Yan G et al . Atherosclerotic cardiovascular disease risks in chronic hemodialysis patients.
Pletcher MJ, Tice JA, Pignone M, Browner WS. Using the coronary artery calcium score to predict coronary heart disease events: a systematic review and meta-analysis.
Raggi P, Boulay A, Chasan-Taber S et al . Cardiac calcification in adult hemodialysis patients. A link between end-stage renal disease and cardiovascular disease?
Huybrechts KF, Caro JJ, London GM. Modeling the implications of changes in vascular calcification in patients on hemodialysis.
Splendiani G, Morosetti M, Manni M et al . Cardiac calcium evaluation in hemodialysis patients with multisection spiral computed tomography.
Chertow GM, Raggi P, Chasan-Taber S, Bommer J, Holzer H, Burke SK. Determinants of progressive vascular calcification in haemodialysis patients.
Ganesh SK, Stack AG, Levin NW, Hulbert-Shearon T, Port FK. Association of elevated serum PO(4), Ca × PO(4) product, and parathyroid hormone with cardiac mortality risk in chronic hemodialysis patients.
Block GA, Hulbert-Shearon TE, Levin NW, Port FK. Association of serum phosphorus and calcium × phosphate product with mortality risk in chronic hemodialysis patients: a national study.
Moe SM, O’Neill KD, Reslerova M, Fineberg N, Persohn S, Meyer CA. Natural history of vascular calcification in dialysis and transplant patients.
Rumberger JA, Brundage BH, Rader DJ, Kondos G. Electron beam computed tomographic coronary calcium scanning: a review and guidelines for use in asymptomatic persons.
Agatston AS, Janowitz WR, Hildner FJ, Zusmer NR, Viamonte M,Jr, Detrano R. Quantification of coronary artery calcium using ultrafast computed tomography.
Chertow GM, Burke SK, Raggi P. Sevelamer attenuates the progression of coronary and aortic calcification in hemodialysis patients.
Chan CT, Harvey PJ, Picton P, Pierratos A, Miller JA, Floras JS. Short-term blood pressure, noradrenergic, and vascular effects of nocturnal home hemodialysis.
Chan CT, Li SH, Verma S. Nocturnal hemodialysis is associated with restoration of impaired endothelial progenitor cell biology in end-stage renal disease.
Bergman A, Fenton SSA, Chan CT. Reduction in hospitalizations with nocturnal hemodialysis.
Tamashiro M, Iseki K, Sunagawa O et al . Significant association between the progression of coronary artery calcification and dyslipidemia in patients on chronic hemodialysis.
Stompor TP, Pasowicz M, Sulowicz W et al . Trends and dynamics of changes in calcification score over the 1-year observation period in patients on peritoneal dialysis.
Jono S, McKee MD, Murry CE et al . Phosphate regulation of vascular smooth muscle cell calcification.
Chen NX, O’Neill KD, Duan D, Moe SM. Phosphorus and uremic serum up-regulate osteopontin expression in vascular smooth muscle cells.
Nadra I, Mason JC, Philippidis P et al . Proinflammatory activation of macrophages by basic calcium phosphate crystals via protein kinase C and MAP kinase pathways: a vicious cycle of inflammation and arterial calcification?
Goodman WG, Goldin J, Kuizon BD et al . Coronary-artery calcification in young adults with end-stage renal disease who are undergoing dialysis.
Yuen D, Richardson RM, Fenton SS, McGrath-Chong ME, Chan CT. Quotidian nocturnal hemodialysis improves cytokine profile and enhances erythropoietin responsiveness.
Author notes
1Department of Medicine, Division of Nephrology, Toronto General Hospital – University Health Network, University of Toronto and 2Division of Nephrology, Humber River Regional Hospital, University of Toronto, Canada


Comments