


Abstract
Background. A growing number of patients are returning to dialysis after renal transplant failure. The aim of this study is to determine whether peritoneal dialysis (PD) is a safe and good treatment option for these patients.
Methods. All patients returning to PD or haemodialysis (HD) after renal transplant failure before 1 October 2002 at the University Hospital Gasthuisberg, Leuven, Belgium, were evaluated. Data were collected until death, retransplantation (reTx), transfer to HD or PD or until 1 January 2003.
Results. Twenty-one patients starting PD (PDpostTx-group) and 39 patients starting HD (HDpostTx-group) after renal transplant failure were included in the study. There were no significant differences in age, sex, serum albumin- and CRP-levels at baseline. The total time on renal replacement therapy at transplant failure and time to transplant failure did not differ between the two groups either. Furthermore, the baseline comorbidity was similar in both groups. During follow-up, the outcome did not differ significantly between the two groups. However, there was a tendency towards higher patient survival and reTx tended to be more frequent in the PDpostTx-group. Moreover, patients in the HDpostTx-group tended to accrue more new comorbidity. The incidence of peritonitis and the evolution of dialysis adequacy (renal and peritoneal Kt/V and creatinine clearances) with time in the PDpostTx-group was similar to that seen in our centre's PD patients who had never undergone transplantation before.
Conclusions. This study suggests that the outcome in patients starting PD after renal transplant failure is at least as good as the outcome in those starting HD. Although these observational findings warrant further confirmation, PD therefore can be regarded as a safe and good treatment option for patients returning to dialysis after renal transplant failure.
Introduction
In the past few decades, there has been a large increase in the number of renal transplant patients. Although long-term graft survival has increased over the years, a single transplantation (Tx) is unlikely to meet the needs of lifelong renal replacement therapy (RRT) for many patients, particularly for the younger patients. Hence, a growing number of patients are returning to dialysis after renal transplant failure.
Little is known about the best treatment option for these patients. They have experienced an episode of great freedom and increased quality of life during their renal transplant period and, therefore, might prefer peritoneal dialysis (PD) at home instead of haemodialysis (HD) in a hospital. On the other hand, increased comorbidity is likely, due to a longer period of renal failure, a history of major abdominal surgery and the chronic use of immunosuppressive therapy.
Sasal et al. [1] found that patients starting PD after renal transplant failure were at increased risk for complications and showed significantly higher morbidity and mortality rates than never-transplanted PD patients. They concluded that a previously failed kidney Tx can be considered an adverse prognostic factor for patients commencing PD. On the other hand, Davies [2] showed no significant difference in survival between patients with failed allografts and new patients starting PD, once corrected for age and comorbidity. Moreover, patients starting PD after renal transplant failure tended to have better outcomes than those starting HD. The author concluded that the principal risk factor for patients returning to dialysis is accrued comorbidity and not the specific treatment modality and that PD is a suitable treatment for patients returning to dialysis after renal transplant failure. However, one should be aware of possible drawbacks such as an increased risk of infection and a more rapid decline of the residual renal function (RRF) in these patients [2]. The aim of the present retrospective single-centre study was to complement the above mentioned data by comparing baseline characteristics and outcomes of patients starting PD (PDpostTx-group) and patients starting HD (HDpostTx-group) after renal transplant failure in our centre.
Methods
In this retrospective single-centre study, all patients starting PD or HD after renal transplant failure at the University Hospital Gasthuisberg, Leuven, Belgium until 1 October 2002 were identified from our database (PDpostTx- and HDpostTx-group). Data were collected until death, retransplantation (reTx), transfer to HD or PD (for the PD- and the HD-group, respectively) or until 1 January 2003. The cause of end-stage renal disease (ESRD), age, sex, comorbidity data and serum albumin- and CRP-levels at the initiation of PD or HD were determined, as were the time on RRT at transplant failure and the duration of renal Tx prior to the start of PD or HD. Data concerning the use of immunosuppressive medication in both groups were also collected. Furthermore, the duration of PD or HD, patient- and technique-survival data, reTx data, cause of death and data concerning the evolution of comorbidity during PD or HD were collected. Comorbidity was assessed using the Stoke study scoring system (Davies score) [3,4]. In the PDpostTx-group, data on peritonitis incidence and the evolution of dialysis adequacy and RRF were registered.
Statistical analysis
Continuous variables were compared with the non-parametric Mann–Whitney–Wilcoxon test. Chi-square frequency analysis was used to analyse categorized variables. Patient survival and reTx were analysed using the Kaplan–Meier method and Wilcoxon and log-rank statistics. In both cases, data were censored at transfer to another dialysis modality (as-treated analysis) or at the end of the observation period (1 January 2003). Additional censoring was performed at reTx or death for the analysis of patient survival or reTx, respectively. McNemar test was applied to assess the evolution of comorbidity during the follow-up period. P-values of less than 0.05 were considered significant.
Results
Sixty patients returning to dialysis after renal transplant failure were identified from the database. Twenty-one of these patients commenced PD (PDpostTx-group) and 39 commenced HD (HDpostTx-group).
Baseline characteristics
Table 1 summarizes the baseline characteristics of the two different groups. There were no significant differences in age (P = 0.82) and sex (P = 0.17). The time on RRT at transplant failure (P = 0.18), total duration of renal Tx (P = 0.13) and the duration of renal Tx directly prior to the start of PD or HD (P = 0.09) tended to be longer in the PDpostTx-group, but these differences were not significant. There was no significant difference in serum albumin- (P = 0.39) and CRP-levels (P = 0.86) at the start. The cause of ESRD did not differ significantly between the two groups (P = 0.66). Baseline comorbidity is shown in Table 2. The Davies score did not differ significantly between the groups. However, when different constituents of the score were analysed separately, a significantly higher frequency of peripheral vascular disease in the PDpostTx-group was noted and this was due to a higher number of cerebrovascular accidents in this group. Furthermore, there was a, albeit not significant, tendency towards a higher frequency of ischaemic heart disease and left ventricular dysfunction in the HDpostTx-group.
Baseline characteristics of the PDpostTx- and the HDpostTx-group
| PDpostTx | HDpostTx | |
|---|---|---|
| Patients (n) | 21 | 39 |
| Age (years) [median (Q1–Q3)] | 46.3 (36.5–57.1) | 48.9 (34.1–59.6) |
| Male sex (%) | 42.9 | 61.8 |
| Duration RRT (months) [median (Q1–Q3)] | 161.9 (56.9–222.0) | 74.5 (40.4–156.2) |
| Duration Tx dir (months) [median (Q1–Q3)] | 144.0 (26.8–161.9) | 53.1 (9.0–114) |
| Duration Tx tot (months) [median (Q1–Q3)] | 144.0 (26.8–175.7) | 59.1 (9.0–131.1) |
| Serum albumin (g/l) [median (Q1–Q3)] | 35.3 (32.5–38.2) | 34.8 (28.3–38.5) |
| CRP (mg/l) [median (Q1–Q3)] | 14.3 (10.5–38.8) | 20.4 (5.7–38.2) |
Q1–Q3 = inter-quartile range; Duration RRT = time on renal replacement therapy at Tx-failure/start of PD/HD; Duration Tx dir = duration of renal Tx directly prior to Tx-failure/start of PD/HD; Duration Tx tot = total duration of renal Tx prior to Tx-failure/start of PD/HD.
Comorbidity in the PDpostTx- and the HDpostTx-group
| Start PD/HD | Stop PD/HD | |||||||
|---|---|---|---|---|---|---|---|---|
| PDpostTx (1) | HDpostTx (2) | (1) vs (2) | PDpostTx (3) | HDpostTx (4) | (3) vs (4) | |||
| P-value | P-value | |||||||
| Malignancy (%) | 0.0 | 0.0 | NS | 0.0 | 5.1 | NS | ||
| IHD (%) | 9.5 | 25.6 | NS | 9.5 | 33.3 | 0.04 | ||
| PVD (%) | 47.6 | 18.0 | 0.03 | 47.6 | 28.2 | NS | ||
| LVD (%) | 4.8 | 23.1 | NS | 4.8 | 33.3 | 0.02 | ||
| DM (%) | 19.0 | 25.6 | NS | 19.0 | 25.6 | NS | ||
| SCVD (%) | 0.0 | 5.1 | NS | 0.0 | 7.7 | NS | ||
| Other (%) | 33.3 | 41.0 | NS | 38.1 | 53.9 | NS | ||
| Davies-score | ||||||||
| Low risk = 0 (%) | 28.6 | 30.8 | 28.6 | 15.4 | ||||
| Medium risk = 1 or 2 (%) | 66.7 | 51.3 | NS | 66.7 | 59.0 | NS | ||
| High risk ≥ 2 (%) | 4.8 | 18.0 | 4.8 | 25.6 | ||||
IHD = ischaemic heart disease; PVD = peripheral vascular disease; LVD = left ventricular dysfunction (pulmonary oedema not due to errors in fluid balance and/or moderate to severe left ventricular dysfunction on echocardiography); DM = diabetes mellitus; SCVD = systemic collagen vascular disease; NS = not significant.
Immunosuppressive therapy
Table 3 shows the use of immunosuppressive drugs in the PDpostTx- and the HDpostTx-group. There were no significant differences between the two groups, apart from a significantly longer intake of cyclosporin A in the PDpostTx-group (P = 0.0091).
Immunosuppressive drugs in the PDpostTx- and the HDpostTx-group
| PDpostTx | HDpostTx | |
|---|---|---|
| Methylprednisolone | ||
| Number of patients (%) | 86% | 95% |
| Duration (months) [median (Q1–Q3)] | 1.5 (0–9) | 3 (0–12) |
| Dose (mg/day) [median (Q1–Q3)] | 3.4 (3–4) | 4.4 (3.2–6.5) |
| Cyclosporin A | ||
| Number of patients (%) | 38% | 41% |
| Duration (months) [median (Q1–Q3)] | 9.0 (2.3–15.0) | discontinued |
| Dose (mg/day) [median (Q1–Q3)] | 126.0 (116.4–233.4) | within 3 months |
| Concentration (µg/l) [median (Q1–Q3)] | 120.7 (86.4–152.3) | in all but three patients |
| Tacrolimus | ||
| Number of patients (%) | 24% | 23% |
| Duration (months) [median (Q1–Q3)] | 12.0 (3.0–24.0) | discontinued |
| Dose (mg/day) [median (Q1–Q3)] | 3.9 (1.7–5.6) | within 3 months |
| Concentration (µg/l) [median (Q1–Q3)] | 9.3 (7.6–11.0) | in all but one patient |
| Azathioprine | ||
| Number of patients (%) | discontinued | discontinued |
| Duration (months) [median (Q1–Q3)] | immediately | immediately |
| Dose (mg/day) [median (Q1–Q3)] | in all patients | in all but one patient |
| Mycophenolate Mofetil | ||
| Number of patients (%) | 33% | 15% |
| Duration (months) [median (Q1–Q3)] | discontinued within 3 months | discontinued within 3 months |
| Dose (mg/day) [median (Q1–Q3)] | in all but one patient | in all but one patient |
Q1–Q3 = inter-quartile range.
Outcome variables
Table 4 shows the total duration of PD/HD, for the PDpostTx-group and the HDpostTx-group, respectively, the outcome and the cause of death. The total duration of PD/HD did not differ significantly (P = 0.26). However, the patients in the HDpostTx-group tended to be longer on HD than the patients on PD in the PDpostTx-group. The percentage of people dying while in PD/HD was significantly higher in the HDpostTx-group in comparison with the PDpostTx-group (P = 0.0136). Moreover, there was one death every 82.9 patient months in the HDpostTx-group and only one death every 132.6 patient months in the PDpostTx-group, but this difference was not significant (P = 0.45). The Kaplan–Meier survival curves (Figure 1) did not differ significantly between the PDpostTx-group and the HDpostTx-group (Wilcoxon P = 0.27; log-rank P = 0.24). The cause of death did not differ significantly between the two groups (P = 0.72).
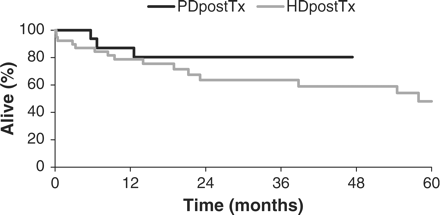
Patient survival in the PDpostTx- and the HDpostTx-group (Kaplan–Meier analysis).
Total duration of PD/HD, outcome and cause of death in the PDpostTx- and the HDpostTx-group
| PDpostTx | HDpostTx | |
|---|---|---|
| Duration of PD/HD (months) [median (Q1–Q3)] | 14.3 (5.7–26.8) | 17.9 (8.4–57.9) |
| Death [% (n/N)] | 14.3 (3/21) | 46.2 (18/39) |
| Transfer to HD/PD [% (n/N)] | 9.5 (2/21) | 0.0 (0/39) |
| PD/HD continued [% (n/N)] | 38.1 (8/21) | 30.8 (12/39) |
| Retransplantation [% (n/N)] | 38.1 (8/21) | 20.5 (8/39) |
| Recovered diuresis [% (n/N)] | 0.0 (0/21) | 2.6 (1/39) |
| Technique failure [% (n/N)] | 23.8 (5/21) | 46.2 (18/39) |
| Cause of death [% (n/N)] | ||
| Cardiac | 16.6 (3/18) | |
| Vascular | 33.3 (1/3) | 11.1 (2/18) |
| Sudden death | 66.6 (2/3) | 38.9 (7/18) |
| Malignancy | ||
| Infection | 22.2 (4/18) | |
| Other | 5.6 (1/18) | |
| Not known | 5.6 (1/18) |
Q1–Q3 = inter-quartile range; Technique failure = death + transfer to HD/PD.
The percentage of patients getting a reTx tended to be lower in the HDpostTx-group than in the PDpostTx-group, but this difference was not significant (P = 0.14). However, from the Kaplan–Meier curves (Figure 2) it can be appreciated that reTx started to differ from the 27th month after the start of follow-up. This is in agreement with the Wilcoxon (P = 0.2269) and log-rank (P = 0.0036) statistic analysis. The comorbidity at the end of follow-up (death, transfer to HD/PD, reTx, end of study) is shown in Table 2. The significant difference in the frequency of ischaemic heart disease and left ventricular dysfunction at the end of the observation period, the disappearance of the significant difference in the frequency of peripheral vascular disease during follow-up and the fact that there was a change in the Davies score in the HDpostTx-group but not in the PDpostTx-group suggest a tendency towards a larger increase in comorbidity in the HDpostTx-group. However, when the McNemar test was applied to compare comorbidity at baseline with comorbidity at the end of the observation period in the two groups, only non-significant P-values were noted.
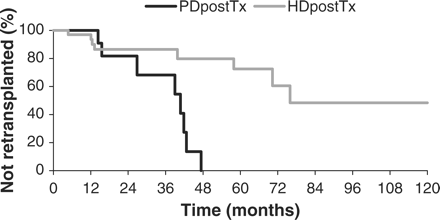
Retransplantation in the PDpostTx- and the HDpostTx-group (Kaplan–Meier analysis). (Percentage of not retransplanted patients is given).
Peritonitis incidence in the PDpostTx-group
In the patients treated with PD after renal transplant failure, the incidence of peritonitis was one peritonitis every 20.9 patient months.
Discussion
There is an ever-growing number of patients returning to dialysis after renal transplant failure, but little is known about the best treatment option for these patients. Sasal et al. [1] compared 42 patients starting PD after renal transplant failure with 43 randomly selected PD patients who had never been transplanted before. Although the baseline characteristics were similar, mortality was significantly higher in the post-transplant group. Furthermore, they found an increased risk for complications in the group with the failing allograft. They concluded that a previously failed kidney Tx can be considered an adverse prognostic factor for patients commencing PD. On the other hand, the study of Davies comparing 28 patients starting PD after renal transplant failure with 469 never-transplanted patients starting PD, showed no difference in survival, once corrected for age and comorbidity [2]. They concluded that the principal risk factor for patients starting PD is accrued comorbidity and not a failed renal Tx as such.
Although, comparing patients starting PD after renal transplant failure with never-transplanted patients starting PD provides some useful information, it is even more important to compare the outcome of patients starting PD with those starting HD after renal transplant failure. Previous studies comparing mortality rates of patients on HD with that of patients on PD have been inconsistent [5–12]. Moreover, other risk factors, such as comorbidity or nutritional status, might have accounted for different outcomes in patients on PD and patients on HD, rather than the dialysis modality of choice itself [7,9–11]. To date, only one study comparing PD and HD post-transplant failure has been published [2]. Davies identified 28 patients returning to PD and 17 patients returning to HD. There was no significant difference in survival between the two groups, although the median survival tended to be shorter in the HD group. Davies concluded that there is no difference in outcome between patients returning to PD or to HD after renal transplant failure and that the principal risk factor for patients returning to dialysis is accrued comorbidity and not the specific dialysis modality. The findings of our study, involving 21 PD patients and 39 HD patients, support and complement these data. As in the Davies study, we found no inferiority of PD as compared to HD with regard to the outcome post-transplant failure. Survival did not differ significantly between the two groups as was shown in a Kaplan–Meier analysis and related statistics. Moreover, there was one death every 82.9 patient months in the HDpostTx-group and only one death every 132.6 patient months in the PDpostTx-group, which might suggest a survival benefit in the PDpostTx-group. This difference, however, was not significant. Furthermore, reTx tended to be more frequent in the PDpostTx-group. This might be explained by the fact that PD patients tended to accrue less new comorbidity and hence were considered more often ‘fit for Tx’ during follow-up.
Unavoidably, this retrospective analysis has some limitations. First of all, it is unclear whether the mentioned tendency towards less new comorbidity in the PDpostTx-group is the consequence of the specific dialysis modality or rather the consequence of the fact that the exposition to PD in the PDpostTx-group tended to be shorter than the exposition to HD in the HDpostTx-group. Second, it is impossible to exclude a potential selection bias in this retrospective study. Indeed, as can be appreciated from Tables 1 and 2, there were some differences in baseline characteristics and baseline comorbidity that might have played a role in orientation towards PD or HD. However, besides the higher number of patients with peripheral vascular disease in the PDpostTx-group, none of these differences were statistically significant. Moreover, our centre has no strict protocol to determine whether a patient should start PD or HD when the transplanted kidney fails. Hence, the choice of a specific dialysis modality is mainly patient driven. A third possible bias is the continuation of immunosuppressive therapy, which was longer in the PDpostTx-group than in the HDpostTx-group. This difference is a reflection of our policy to keep patients returning to PD on steroids and cyclosporin A or tacrolimus to preserve RRF, since the latter has been demonstrated to contribute substantially to the quality of life and outcome in PD patients [3,4,13]. However, the issue of tapering immunosuppression or not after restarting PD is still a matter of intense debate since the evidence of the beneficial effects of preserved RRF stems from observations in non-transplanted patients [3,4,13]. Moreover, the continuation of immunosuppressive therapy implies an increased risk of infections [14,15] and malignancies. This is of particular interest in PD patients, since an increased incidence of peritonitis may completely offset any beneficial effect of prolonged preservation of RRF [16]. It is noteworthy, however, that the incidence of peritonitis in the PDpostTx-group was not statistically different from the peritonitis rate in our centre's PD patients who had not undergone transplantation before (one peritonitis every 21.4 patient months, n = 136, P = 0.93). Furthermore, there was no significant difference in the decline of RRF between patients starting PD after renal transplant failure and never-transplanted patients starting PD (data not shown), which is another encouraging finding.
In summary, our study suggests that the outcome in patients commencing PD after renal transplant failure is at least as good as the outcome in patients commencing HD after renal transplant failure. Despite the inherent selection bias in this kind of retrospective study, PD seems a safe and good treatment option for patients returning to dialysis after renal transplant failure.
Conflict of interest statement. None declared.
References
Sasal J, Naimark D, Klassen J, Shea J, Bargman JM. Late renal transplant failure: an adverse prognostic factor at initiation of peritoneal dialysis.
Davies SJ. Peritoneal dialysis in the patient with a failing renal allograft.
Davies SJ, Russell L, Bryan J, Phillips L, Russell GI. Comorbidity, urea kinetics, and appetite in continuous ambulatory peritoneal dialysis patients: their interrelationship and prediction of survival.
Davies SJ, Phillips L, Naish PF, Russell GI. Quantifying comorbidity in peritoneal dialysis patients and its relationship to other predictors of survival.
Bloembergen WE, Port FK, Mauger EA, Wolfe RA. A comparison of mortality between patients treated with hemodialysis and peritoneal dialysis.
Fenton SS, Schaubel DE, Desmeules M et al. Hemodialysis versus peritoneal dialysis: a comparison of adjusted mortality rates.
Schaubel DE, Morrison HI, Fenton SS. Comparing mortality rates on CAPD/CCPD and hemodialysis. The Canadian experience: fact or fiction?
Collins AJ, Hao W, Xia H et al. Mortality risks of peritoneal dialysis and hemodialysis.
Vonesh EF, Moran J. Mortality in end-stage renal disease: a reassessment of differences between patients treated with hemodialysis and peritoneal dialysis.
Murphy SW, Foley RN, Barrett BJ et al. Comparative mortality of hemodialysis and peritoneal dialysis in Canada.
Heaf JG, Lokkegaard H, Madsen M. Initial survival advantage of peritoneal dialysis relative to haemodialysis.
Korevaar JC, Feith GW, Dekker FW et al. Effects of starting with hemodialysis compared with peritoneal dialysis in patients new on dialysis treatment: a randomized controlled trial.
Davies SJ, Phillips L, Russell GI. Peritoneal solute transport predicts survival on CAPD independently of residual renal function.
Gregoor PJ, Kramer P, Weimar W, van Saase JL. Infections after renal allograft failure in patients with or without low-dose maintenance immunosuppression.
Smak Gregoor PJ, Zietse R, van Saase JL et al. Immunosuppression should be stopped in patients with renal allograft failure.


Comments