


Abstract
Background. Nephropathia epidemica (NE) is the Scandinavian type of haemorrhagic fever with renal syndrome. Usually heavy transient proteinuria is present at the onset of the disease.
Methods. We investigated glomerular permeability in eight patients with acute NE and in eight healthy controls. Six patients were followed for 1 year. The glomerular filtration rate (GFR) was determined by inulin clearance and effective renal plasma flow (ERPF) by para‐aminohippurate clearance.
Results. GFR and ERPF were significantly reduced in NE patients during the acute phase compared with those in controls (P<0.001 and P<0.001, respectively). The filtration fraction (FF) was thus high, 0.37. The fractional clearances of albumin, IgG, and IgG4 were markedly increased. As a sign of tubular dysfunction, increased urinary excretion of α1‐microglobulin was observed in all patients. After 1 year, the GFR of the patients no longer differed from that of the controls. ERPF was lower and FF higher than those in controls (P=0.014 and P=0.009, respectively). The fractional clearances of albumin, IgG, and IgG4 remained increased. The high‐molecular fractional dextran clearances in the patients were significantly increased compared with controls during the acute phase. Computed analysis of glomerular membrane‐pore structure showed that the ‘shunt‐flow’ was increased in the patients during the acute phase compared with the controls. There was a positive correlation between the FF and the shunt (r=0.768, P=0.026). In addition, fractional clearances of albumin and IgG correlated significantly with the shunt (r=0.810, P=0.015 and r=0.762, P=0.028, respectively).
Conclusions. Renal involvement in the acute phase of NE is characterized by a markedly decreased GFR and ERPF. Increased glomerular permeability is associated with impairment of both the size‐ and charge‐selectivity properties of the glomerular filter.
Introduction
Nephropathia epidemica (NE) belongs to a group of viral infections referred to as haemorrhagic fevers with renal syndrome [1]. The disease varies greatly in severity [2,3]. It is characterized by increased universal capillary leakage of protein‐rich fluid from the vascular bed, which may lead to an acute shock syndrome [4]. The renal involvement results in transient massive proteinuria, haematuria, and impairment of renal function [2]. Glomerular filtration rate (GFR) and renal blood flow has been shown to be greatly reduced in the acute phase [5,6]. A typical renal biopsy finding is acute tubulointerstitial nephritis with mild glomerular histologic lesions [7]. It is interesting, as we know that the transient and often heavy proteinuria is non‐selective [4] indicating a defective glomerular barrier. This may be associated with the increased capillary permeability found in various hantavirus infections including NE [4].
To our knowledge, no glomerular permeability studies have previously been made of patients with NE. The aim of this study was to investigate the functional characteristics of the glomerular barrier in patients with NE by measuring fractional clearances with different macromolecules in the acute phase, after 3 months and after 1 year of follow‐up and to compare the findings of the patients to those of healthy controls.
Subjects and methods
Subjects
Glomerular permeability was studied in eight patients in whom the diagnosis of acute NE was based on the presence of specific serum antibodies to Puumala virus [1]. The clinical data are shown in Table 1. The patients were admitted to Tampere University Hospital during the years 1992–1994. No patient was known to have previous chronic diseases except one male who had suffered from mild asthma. The first symptoms of acute NE had lasted 8–21 days before the first examination. Two patients were haemodialysed in the acute phase. The patients with oliguria were studied as soon as possible after the oliguric phase. During the study day, the acute‐phase urine volumes of the patients varied from 1900 to 3600 ml. The patients did not receive diuretics, ACE‐inhibitors or any other additional treatments that might have affected the results.
Eight healthy normotensive males with no medication (median age 40 years, range 25–53, body mass index 25 kg/m2, range 22–28) served as controls. Voluntary controls were collected by an open advertisement and they were enrolled in the same period as the patients. All subjects gave signed informed consent and the Ethics Committee of Tampere University Hospital approved the study protocol.
Clinical data on patients with NE
| Patient no. | Age (years) | Body mass index (kg/m2) | Sex (F/M) | Delaya (days) | Maximum creatinineb (μmol/l) |
| 1 | 45 | 28 | M | 16 | 1443 |
| 2 | 40 | 26 | M | 13 | 973 |
| 3 | 28 | 23 | M | 9 | 841 |
| 4 | 46 | 25 | M | 11 | 347 |
| 5 | 32 | 23 | F | 10 | 323 |
| 6 | 31 | 24 | M | 8 | 181 |
| 7 | 62 | 24 | F | 21 | 164 |
| 8 | 44 | 29 | M | 11 | 121 |
aDelay, days between onset of symptoms and first examination.
bHighest creatinine concentration in serum observed during hospital care.
Study protocol
All patients were studied in the acute phase of NE. In six patients, the studies were repeated after 3 months and after 1 year. In the morning the subjects voided their urine and rested in sitting position for 1 h while drinking water (15 ml/kg) to increase urine output. A priming dose of inulin (0.04 g×kg weight) and para‐aminohippurate (0.004 g×kg weight) were administered intravenously. Subsequently, a sustaining solution of inulin (7–27 mg/min, depending on the estimated GFR) and para‐aminohippurate (3.5–15 mg/min, depending on the estimated level of effective renal plasma flow (ERPF)) was delivered by an infusion pump. All subjects were injected with 20 ml dextran‐1 immediately following the inulin and para‐aminohippurate prime to prevent anaphylactic reactions to dextran, whereafter a mixture of dextran‐40 (60 mg/kg) and dextran‐70 (60 mg/kg) (Rheomacrodex and Macrodex, respectively, Pharmacia, Uppsala, Sweden) was administered by slow intravenous injection.
At the end of a 40‐min equilibration period the bladder was emptied by voiding, after which three carefully timed 30‐min urine collections were made. Venous blood was collected at the beginning and at the end of each urine collection. Blood pressure was measured by auscultation with a standard mercury manometer, in the supine position. Three measures were taken and the mean of these was used.
The GFR was estimated by inulin clearance and the ERPF by para‐aminohippurate clearance. Fractional macromolecule clearances (Θ) were determined using the equation ΘM=(U/P)M/(U/P)In, where (U/P)M and (U/P)In refer to the urine/plasma concentration ratio for each macromolecule and inulin. Polydisperse neutral dextran was used to define the size‐selective properties of the glomerular capillary wall. Charge‐selective properties of the glomerular capillary wall were elucidated on fractional clearances of albumin (mol. wt. 66000 Da, radius 3.6 nm, isoelectric point (pI) 4.8 nm), IgG (mol. wt. 150000 Da, radius 5.0 nm, pI 5.8–7.2) and IgG4 (mol. wt. 150000 Da, radius 5.0 nm, pI 5.5–6.0).
Laboratory methods
The separation of dextran in plasma and urine samples into narrow fractions was accomplished by high‐performance size‐exclusion chromatography and the dextran concentration was assayed by the anthrone method, as described previously [8].
αl‐Microglobulin was measured from urine using a Behring Nephelometer 100 (Behringwerke AG, Marburg, Germany) after concentrating urine by Minicon‐CS15 concentrators (Amico Inc., Beverly, MA, USA) according to the manufacturers' recommendations. For albumin and IgG determinations, enzyme‐linked immunosorbent assays were carried out [9,10]. The IgG4 concentration in urine and plasma samples was measured by a biotin–streptovidin enzyme‐linked immunosorbent assay [11]. The assay was calibrated using appropriate dilutions (1–300 μg/l) of a human IgG subclass preparation (CLB, Amsterdam, The Netherlands: code HOO1234).
Plasma and urinary concentrations of inulin and para‐aminohippurate were determined using techniques that have been described in detail previously [8].
Analysis of glomerular membrane‐pore structure
Glomerular function was described with a heteroporous model, where the pore size is normally distributed around the mean value. Furthermore, a small fraction of macromolecules is assumed to shunt through large channels. This model has been described in detail by Deen et al. [12]. The parameters of the model were: mean value of pore radius r0, the standard deviation of Gaussian distribution s and shunting fraction ω. The main quantities in the model also included transmural hydrostatic pressure difference Δp and protein concentration Cp in the glomerular plasma. The mathematical model of fractional clearance includes non‐linear differential equations, which can be solved by numerical integration only.
The residual between computed and measured values of fractional clearance was estimated by sum of squared errors (SSE) [12]. The problem is to find parameter values r0, s, and ω which minimize the SSE. The optimization has been solved using the Simplex algorithm ‘Amoeba’ [13]. Simplex is a computationally robust but relatively slow method, this however constituting no essential problem when using proper computers.
For the analysis, we developed an interactive computer program in Visual Basic language for a Windows environment. The program gives information on parameter values and SSE during the long iterative computing process. When the pre‐set maximal number of iterations is reached, the operator can restart the optimizing process from the actual best parameter values.
The volume flux through pores depends on the driving pressure, which is the difference between the hydrostatic pressure difference Δp and the colloid osmotic pressure caused by the plasma proteins. The latter can be estimated by a second‐order polynomial of protein concentration [12]. The value of Δp is not measurable in humans, but values of 35–45 mmHg have been used in the literature. We used 45 mmHg, because lower values will for some measured data set give negative values for the net driving pressure.
It was sufficient to divide the capillary length into five parts and use steps of 2 Å of pore sizes in the computing sequence. The optimization sequence of 30 iterations took about 60 s with a 330 MHz Pentium microcomputer.
Statistical analysis
Differences between the parameters were tested by Mann–Whitney U‐test (two‐tailed). Correlations were determined by Spearman rank correlation coefficient. Probablities <0.05 were considered statistically significant. All tests were performed using the SPSS (version 7.0) statistical software package for Windows.
Results
Renal function in the acute phase
The clinical data of the patients are shown in Table 1. The median interval between the onset of symptoms and the first permeability study was 11 days. In the acute phase, renal function was seriously impaired in all patients. The maximum serum creatinine levels varied from 121–1443 μmol/l (Table 1). Four patients had oliguria (<400 ml/24 h) during the first days of hospitalization. Two patients were haemodialysed in the acute phase. Patient no. 1 required haemodialysis treatment four times and the patient no. 2 twice.
Table 2 shows that GFR (median 32 ml/min/1.73 m2, range 6–87) and ERPF (152 ml/min/1.73 m2, range 11–368) were significantly reduced and the filtration fraction (FF) thus markedly increased (0.37, 0.13–0.55) compared with those in controls (109 ml/min/1.73 m2, range 87–127, P<0.001; 495 ml/min/1.73 m2, range 438–571, P<0.001; and 0.20, range 0.17–0.24, P=0.057, respectively). The urinary excretion rates and fractional clearances of the proteins are shown in Tables 3 and 4. Compared with the healthy controls, the fractional clearances and urinary excretions of albumin, IgG, and IgG4 were significantly increased in the patients. The IgG/IgG4 index in patients was significantly lower than that in healthy controls (Table 4). The overnight excretion of α1‐microglobulin exceeded 7 μg/min (upper reference limit for healthy subjects) in all patients (data not shown).
Renal function in patients with NE compared with healthy controls
| Controls | Patients | |||
| Acute phase | After 3 months | After 1 year | ||
| GFR (ml/min/1.73 m2) | 109 | 32*** | 84 | 85 |
| 87–127 | 6–87 | 71–121 | 73–127 | |
| ERPF (ml/min/1.73 m2) | 495 | 152*** | 342** | 365* |
| 438–571 | 11–368 | 163–489 | 271–552 | |
| FF | 0.20 | 0.37 | 0.27** | 0.25** |
| 0.17–0.24 | 0.13–0.55 | 0.22–0.39 | 0.21–0.33 |
Values represent median and range. *P<0.001, **P<0.01, *P<0.05 vs values of the controls.
Excretion of urinary proteins in patients with NE compared with healthy controls
| Controls | Patients | |||
| Acute phase | After 3 months | After 1 year | ||
| Total protein (g/day) | 0.09 | 1.25*** | 0.15* | 0.13 |
| (0.06–0.18) | (0.29–2.28) | (0.10–0.18) | (0.09–0.14) | |
| Albumin (μg/min) | 5.1 | 208.1*** | 22.6** | 11.3 |
| (2.0–20.1) | (17.7–5490.0) | (8.8–160.8) | (3.5–24.8) | |
| IgG (μg/min) | 1.16 | 33.51*** | 6.46* | 1.76 |
| (0.47–1.47) | (6.29–109.25) | (1.60–66.65) | (0.79–8.68) | |
| IgG4 (μg/min) | 0.04 | 3.29*** | 0.38** | 0.06 |
| (0.02–0.07) | (0.09–24.4) | (0.29–5.68) | (0.02–0.29) |
Values represent median and range. ***P<0.001, **P<0.01, *P<0.05 vs values of the controls.
Fractional protein clearances and charge selectivity indices in patients with NE compared with healthy controls
| Controls | Patients | |||
| Acute phase | After 3 months | After 1 year | ||
| Θ‐alb (×10−6) | 1.96 | 370.10*** | 6.27* | 2.52 |
| (0.50–4.58) | (5.80–1925.80) | (2.71–57.24) | (1.21–5.94) | |
| Θ‐IgG (×10−6) | 1.80 | 151.10*** | 7.62* | 2.05 |
| (0.48–2.00) | (4.40–1223.60) | (0.82–102.70) | (1.02–6.18) | |
| Θ‐IgG4 (×10−6) | 0.52 | 323.40*** | 3.30* | 1.32* |
| (0.17–0.66) | (3.06–915.90) | (0.48–96.60) | (0.37–2.34) | |
| Θ‐IgG/Θ‐IgG4 | 2.01 | 0.91* | 1.44* | 2.09 |
| (1.76–3.04) | (0.16–2.48) | (0.31–2.59) | (0.48–4.11) |
Values represent median and range. ***P<0.001, **P<0.01, *P<0.05 vs values of the controls.
Renal function during convalescence
Six patients (nos 1, 3, 4, 6–8) were followed for 1 year after discharge from hospital. Three months after discharge, GFR did not differ significantly from control (Table 2). ERPF (342 ml/min/1.73 m2, range 163–489) was significantly lower and FF (0.27, range 0.22–0.39) higher in the patients (P=0.009 and P=0.006, respectively). All protein excretion rates were significantly increased and IgG/IgG4 index decreased (Tables 3 and 4). Individual data of the patients on the evolution of proteinuria and blood pressure are shown in Table 5.
After 1 year, the GFR in patients was at the same level as at 3 months but not statistically different from the controls. ERPF (365 ml/min/1.73 m2, range 271–552) was significantly lower and FF (0.25, 0.21–0.33) higher in patients than controls (P=0.014 and P=0.009). As shown in Tables 3 and 4, urinary excretions and fractional clearances of proteins in the patients remained slightly increased. The fractional clearances of albumin and IgG did not differ significantly from those of the controls. The fractional clearance of IgG4 was higher (1.32×10⁻⁶, range 0.37–2.34) than that of the controls (0.52×10⁻⁶, range 0.17–0.66, P=0.022). The IgG/IgG4 indices were not different between the groups. Urinary excretion of α1‐microglobulin was increased in four out of six patients after 3 months and in two out of six patients after 1 year (Table 5).
Individual data of the six patients with NE on the evolution of proteinuria and blood pressure at 3 months and at 1 year
| Patient no. | Urinary albumin (μg/min) | Urinary α1‐microglobulin (μg/min) | Blood pressure (mmHg) | ||||||
| At 3 months | At 1 year | At 3 months | At 1 year | At 3 months | At 1 year | ||||
| 1 | 26 | 15 | 21 | 12 | 152/90 | 156/90 | |||
| 3 | 19 | 9 | 14 | <7 | 122/78 | 112/80 | |||
| 4 | 9 | 3 | <7 | <7 | 142/88 | 136/84 | |||
| 6 | 13 | 14 | <7 | <7 | 128/86 | 120/82 | |||
| 7 | 161 | 25 | 26 | <7 | 170/92 | 132/80 | |||
| 8 | 35 | 4 | 71 | 44 | 142/84 | 110/76 | |||
Glomerular pore‐membrane structure
The high‐molecular fractional dextran clearances in the patient group were significantly enhanced during the acute phase (Figure 1). The heteroporous membrane model was used to compute representative membrane parameters from the mean dextran sieving profiles. The computed membrane parameters are summarized in Table 6. Compared with the values in healthy controls, the ultrafiltration coefficient (Kf) was significantly lowered during the acute phase, but returned to normal during follow‐up. The pore size was slightly increased, but the difference between patients and controls was not significant. The ‘shunt‐flow’ showed a pronounced 2‐fold rise during the acute phase, and there was a positive correlation between FF and shunt (r=0.768, P=0.026). In addition, both fractional clearances of albumin and IgG correlated significantly with shunt (r=0.810, P=0.015 and r=0.762, P=0.028, respectively) in patients in the acute phase. During follow‐up the patients showed hardly any shunt.
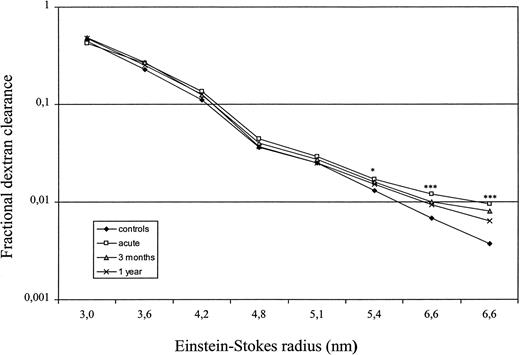
Fractional dextran clearances in patients with NE and controls. ***P<0.001, *P<0.05 vs values of the controls.
Glomerular permeability measured by fractional dextran clearances in patients with NE compared with healthy controls
| Controls | Patients | |||
| Acute phase | After 3 months | After 1 year | ||
| Kf, ml/min/mmHg | 5.2 | 1.5** | 5.3 | 6.1 |
| 3.8–6.7 | 0.4–5.4 | 3.1–10.5 | 3.8–7.4 | |
| Median pore size, Å | 53.4 | 56.6 | 55.7 | 52.6 |
| 35.0–61.0 | 50.1–58.2 | 53.5–57.5 | 51.3–57.6 | |
| Shunting fraction, ω×10−3 | 1.97 | 6.15** | 3.58 | 2.77 |
| 0.71–3.94 | 2.39–10.21 | 1.56–6.53 | 1.72–6.04 |
Kf, ultrafiltration coefficient. Values represent median and range. **P<0.01 vs values of the controls.
Discussion
In the present study, renal function was seriously impaired in NE patients during the acute phase. Both GFR and ERPF were significantly reduced and FF was markedly high. The long‐term prognosis of NE is usually considered favourable. However, it has been reported that haemorrhagic fever with renal syndrome could lead to permanent abnormalities and impairment of renal function [6,14]. In our study the GFR did not differ notably from that in controls after 1 year but ERPF remained significantly depressed. It is noteworthy that the control group was slightly younger and covered a smaller age range.
Proteinuria is particularly common in NE, being found in 94–100% of cases [2,3]. It suddenly appears on the third to fifth day and peaks on day eight on average [1]. Proteinuria of nephrotic range (>3.5 g/day) has been found in 25% of patients [2]. Our patients were studied as soon as possible, but the delay between the onset of the symptoms and the first examination varied from 8 to 21 days. Marked proteinuria was found in all cases (Table 3). An increment in capillary permeability is characteristic for various types of hantavirus infections, but the mechanism underlying vascular leakage is unclear. Cytokines may play an important role in the pathogenesis of proteinuria and increased vascular permeability in NE [1]. Tumour necrosis factor‐α is known to induce vascular permeability and to increase the expression of endothelial adhesion molecules [1]. Increased signals for tumour necrosis factor‐α, and also slightly increased signal for transforming growth factor‐β and platelet‐derived growth factor have been detected around the distal nephron in patients with NE [15].
Transient and often heavy proteinuria in NE patients is typically non‐selective, containing albumin and even larger proteins that leak from the glomeruli [1]. Urinary loss of low molecular weight proteins such as β2‐microglobulin indicates that tubular injury may also contribute to proteinuria [1,6]. Massive albuminuria per se may decrease low molecular‐mass proteins reabsorption at the tubular level either through competition or through a toxic effect [16]. Urinary excretion of α1‐microglobulin in our patients was increased in all cases during the acute phase and remained so in four out of six patients for up to 3 months of follow‐up, although the urinary excretion of albumin had reduced significantly. Our study suggests a role for proximal tubular dysfunction in the pathogenesis of NE.
The descriptions of macromolecule transport across the glomerular capillaries most widely used are based on a hydrodynamic theory of hindered solute transport through a heteroporous membrane as postulated by Deen et al. [12]. Changes in the size and charge selectivity of the glomerular filter have been reported in diabetic nephropathy and in different primary glomerulopathies [8,17,18]. It has moreover, recently been suggested that the high‐capacity retrieval pathway for albumin is most likely associated with transtubular transport, and albuminuric states could be accounted for by malfunctioning of this pathway [19]. Although the pathogenesis of proteinuria has not yet been fully elucidated, it is widely accepted that haemodynamic alterations, the size and charge selectivities of the glomerular capillary filtration barrier and tubular reabsorption are implicated [17,18].
Little is known regarding the porosity of the glomerular capillary wall in acute nephritis. Neugarten et al. [20] demonstrated that fractional clearances of neutral dextrans with molecular radii exceeding 40 Å were elevated in rats with acute nephrotoxic serum nephritis. The present study revealed that in the acute phase of NE the renal involvement results in pronouncedly increased glomerular permeability and impairment of renal function. In our patient group we could clearly show important changes in permeability studies. According to our results, the high‐molecular fractional dextran clearances were significantly increased in the patient group compared with the controls. Furthermore, computed analysis of the glomerular pore‐membrane structure revealed a 2‐fold rise in the shunt pathway during the acute phase. Our application of the pore theory through a heteroporous membrane suggested that glomerular pores in patients with acute NE were shifted towards larger size than in controls. Our finding reflects the development in the glomerular barrier of a subset of enlarged, non‐discriminatory pores. During a convalescence of 1 year, the changes in the effective pores had diminished or disappeared. The shunt correlated significantly with FF and the fractional clearances of both albumin and IgG, confirming that impairment of the barrier in size selectivity contributes to proteinuria in acute NE. It is possible that the increased glomerular permeablity could be, partially at least, a consequence of an increased FF. On the other hand, such a relationship between the shunt and fractional albumin and IgG clearances has also been demonstrated in patients with diabetic nephropathy [18].
The relation between total IgG and IgG4 has been used to establish a selectivity index as a measure of loss of negative large‐pore charge selectivity [17]. By evaluating renal charge selectivity by this IgG/IgG4 index it was possible to demonstrate that during the acute phase and after 3 months the indices were significantly decreased. However, one of the drawbacks in the use of this index is the fact that tubular reabsorption is charge‐dependent [17]. As we do not exactly know the proximal tubular reabsorption of IgG under normal conditions and in albuminuric patients, the exact extent to which this increment has occurred cannot be evaluated. On the other hand, both the urinary excretions and fractional clearances of the anionic proteins, albumin and IgG4, were significantly enhanced during the acute phase and even 3 months later. Thus, we have good reason to believe that the depletion of negative charges also plays some role in the transiently increased glomerular permeability during the early phase of the disease.
In conclusion, renal involvement in the acute phase of NE is characterized by a markedly lowered GFR and ERPF. The increased glomerular permeability is associated with impairment of both the size‐ and charge‐selectivity properties of the glomerular filter.
Correspondence and offprint requests to: Ilpo Ala‐Houhala, MD, Medical School, University of Tampere, FIN‐33014 Tampere, Finland. Email: llilal@uta.fi
The skilful technical assistance of Ms Mirja Ikonen is greatly appreciated. The study was financially supported by the Medical Research Fund of Tampere University Hospital. Some of the results were presented in abstract form at the 37th Annual Meeting of EDTA (Nice, September 2000).
References
Kanerva M, Mustonen J, Vaheri A. Pathogenesis of Puumala and other hantavirus infections.
Mustonen J, Brummer‐Korvenkontio M, Hedman K, Pasternack A, Pietilä K, Vaheri A. Nephropathia epidemica in Finland: a retrospective study of 126 cases.
Settergren B, Juto P, Trollfors B, Wadell G, Norrby, SR. Clinical characteristics of nephropathia epidemica in Sweden: prospective study of 74 cases.
Cosgriff TM. Mechanisms of disease in hantavirus infection: pathophysiology of hemorrhagic fever with renal syndrome.
Lingårdh G, Lundström B, Nyström K. Renal blood flow in acute epidemic nephritis.
Settergren B, Trollfors B, Fasth A, Hultberg B, Norrby SR. Glomerular filtration rate and tubular involvement during acute disease and convalescence in patients with nephropathia epidemica.
Mustonen J, Helin H, Pietilä K, Brummer‐Korvenkontio M, Hedman K, Vaheri A, Pasternack A. Renal biopsy findings and clinicopathologic correlations in nephropathia epidemica.
Ala‐Houhala I, Pasternack A. Fractional dextran and protein clearances in glomerulonephritis and in diabetic nephropathy.
Feldt‐Rasmussen B, Dinesen B, Deckert M. Enzyme immunoassay: an improved determination of urinary albumin in diabetics with incipient nephropathy.
Fomsgaard A, Feldt‐Rasmussen B, Deckert M, Dinesen B. Micro‐ELISA for the quantitation of human urinary IgG.
Kofoed‐Enevoldsen A, Jensen K, Beck TC. Measuring urinary IgG and IgG4 excretion.
Deen WM, Bridges CR, Brenner BM, Myers BD. Heteroporous model of glomerular size selectivity: application to normal and nephrotic humans.
Press WH, Flannery BP, Teukolsky SA, Vetterling WT.
Lähdevirta J, Collan Y, Jokinen EJ, Hiltunen R. Renal sequelae to nephropathia epidemica.
Temonen M, Mustonen J, Helin H, Pasternack A, Vaheri A, Holthöfer H. Cytokines, adhesion molecules and cellular infiltration in nephropathia epidemica kidneys: an immunohistochemical study.
Thielemans N, Lauwerys R, Bernard A. Competition between albumin and low‐molecular‐weight proteins for renal tubular uptake in experimental nephropathies.
Torffvit O, Rippe B. Size and charge selectivity of the glomerular filter in patients with insulin‐dependent diabetes mellitus: urinary immunoglobulins and glycosaminoglycans.
Andersen S, Blouch K, Bialek J, Deckert M, Parving HH, Myers BD. Glomerular permselectivity in early stages of overt diabetic nephropathy.
Eppel GA, Osicka TM, Pratt LM, Jablonski P, Howden BO, Glasgow EF, Comper WD. The return of glomerular‐filtered albumin to the rat renal vein.


Comments