


Abstract
Background. The influence of dialysis modality on prognosis is controversial. In the absence of randomized trials, epidemiological investigations present the best method for studying the problem.
Methods. 4568 haemodialysis (HD) and 2443 peritoneal dialysis (PD) records in 4921 dialysis patients treated between 1990 and 1999 were retrieved from the Danish Terminal Uremia register in order to determine the influence of dialysis form on prognosis. The register is national, comprehensive, and incident.
Results. Factors reducing survival included age, cardiovascular disease, malignancy, lung disease, diabetes, alcoholism, haematological disease, but not sex or hypertension. Transplant non‐candidacy was associated with an adjusted relative risk of 4.7 (CI 4.0–5.6). PD mortality relative to HD (after correction for comorbidity and transplant candidacy) was 0.65 (CI 0.59–0.72, P<0.001) on an ‘as treated’ and ‘history’ analysis and 0.86 (CI 0.78–0.95, P<0.01) on an intention‐to‐treat (ITT) analysis. The difference was confined to the first 2 years of dialysis. Change in dialysis modality was associated with increased mortality, and change from PD to HD with an accelerated mortality for the first 6 months. This was presumably due to the transfer of sick PD patients, but did not explain the difference. The relative advantage of PD was lower for diabetic patients, where it was not significant on ITT analysis. Dialysis prognosis improved by 14% during the period, with similar results for HD and PD patients. PD patients who were subsequently transplanted had a significantly shorter time to onset of graft function (3.5 vs 5.1 days, P<0.05).
Conclusions. These results show a survival advantage for PD during the first 2 years of dialysis treatment. This may be due to unregistered differences in comorbidity at the start of treatment, or may be causal, possibly due to better preservation of residual renal function. The study lends credence to the ‘integrative care’ approach to uraemia, where patients are started on PD and transferred to HD when PD related mortality increases.
Introduction
The relative merits of peritoneal dialysis (PD) and haemodialysis (HD) in the preservation of life of patients with terminal renal failure is still controversial. As randomized trials are probably impossible to perform, conclusions must be drawn from registry data. These data should preferably be recent, large, incident, and be adjusted for available comorbidity data. Two recent large studies [1,2] have suggested a survival advantage for PD during the first 2 years of dialysis. The existence of a national Danish registry describing incident active treatment for terminal uraemia enables further information to be gathered on this important subject. We performed an epidemiological study of all patients treated in Denmark between 1990 and 1999 in order to investigate the effect of dialysis modality on prognosis.
Patients and methods
Patients
The Danish Society of Nephrology Terminal Uremia Register (TUR) contains data concerning every patient in Denmark receiving active treatment for terminal uraemia, and forms the basis of the Danish EDTA register. The register contains the patient age, sex and renal diagnosis using standard EDTA terminology, and the start‐date, end‐date and location of every active treatment. Active treatment is classified as transplantation, HD, CAPD, continuous cycling PD (CCPD, generally synonymous with use of the night cycler), or intermittent PD (H‐IPD, a hospital‐based therapy consisting of 20 l thrice weekly or 60 l once a week). The register became comprehensive on January 1, 1990, and full treatment data on all patients under treatment on that day are available. Active treatment of diabetic patients and patients aged 70–80 years increased substantially during the period of observation. All dialysis treatments starting from January 1, 1990 to December 31, 1999 were included in the study.
Methods
Data from the TUR was combined with data from two other registers. (i) The National Patient Register (LPR) contains all national hospital admission data since 1977: date of admission, date of discharge, and WHO ICD discharge diagnoses. The first occurrence of the following chronic diseases was noted: malignancy excluding myeloma, multiple myeloma, thyroid disease, diabetes mellitus types 1 and 2, diabetic retinopathy, diabetes with multiple complications, blood dyscrasias, psykosis, neurosis, alcoholism, neurological disorders, hypertension, myocardial infarction, ischaemic heart disease, cerebrovascular disease, peripheral vascular disease, chronic obstructive lung disease (COLD) (including emphysema), cirrhosis. (ii) The Scandiatransplant register contains the data of all patients entering the waiting list for transplant and all patients receiving a renal transplant. The date of final removal from the waiting list was noted, patients being assumed to be transplant candidates prior to this date.
The registers were combined using the individual national identity number, which is unique, and common to the three registers.
Statistical analysis
Variables were compared using Student's t‐test, logarithmic transformation being performed where indicated. Categorical variables were compared using χ2 analysis. Survival analysis was performed using Kaplan–Meier and Cox proportional hazards analysis. The primary analysis was performed ‘career’‐wise (as treated). Each dialysis ‘career’ was treated individually, with each ‘career’ being censored for change of therapy or loss to follow‐up (LTF). For certain analyses the ‘history’ and intention to treat (ITT) methods were used. The history method is similar to the ‘as treated’ method, but includes only first dialysis ‘careers’, censored for change of therapy or LTF. The ITT method includes only first ‘careers’, censored for transplantation or LTF, but not change of dialysis modality. For the ‘history’ and ITT analyses, only patients beginning their first dialysis ‘careers’ after January 1, 1990 were included, defined as ‘complete patients’. Diagnoses were included as comorbid risk factors if they were present before the start of the dialysis ‘career’ (‘as treated’ analysis) or start of first dialysis ‘career’ (‘history’ and ITT analyses). Switches from one PD modality to another were ignored, apart from the PD modality analysis as such. The Statistica (Tulsa, AZ, USA) statistical package was used. The confidence interval was defined as twice the standard error of the mean.
Results
A total of 4921 patients were included. There were 4568 HD ‘careers’ and 2443 PD ‘careers’ registered. There were 4490 ‘complete’ patients, with 4020 HD and 2208 PD ‘careers’. The initial ‘career’ was HD in 3281 patients and PD in 1640 patients (complete 2956 and 1534). Patient characteristics are shown in Table 1. PD patients had a generally more favourable comorbidity profile than HD patients: they were slightly younger, had less cancer, cerebrovascular disease, blood dyscrasia, alcoholism, COLD, and were more likely to be transplant candidates. However, significantly more were diabetics and had diabetic complications. The relative risks (RRs) for individual variables, adjusted for age and sex are shown in Table 1. All variables with significant RRs were also significant on a proportional hazards analysis. Primary renal diseases were associated with a lower mortality, while diabetic and renovascular nephropathy had a poorer prognosis.
A total of 2184 patients died during the period of observation. The cause of death is shown in Table 2. There was no significant difference in cause of death between HD and PD, but a trend to a higher relative cardiac mortality for PD patients was noted.
A proportional hazards analysis was performed to investigate the relative influence of PD and HD on mortality and is shown in Table 3. PD had a 35% better prognosis using ‘as treated’ and ‘history’ analyses, and a 14% better prognosis using ITT analysis. The survival of non‐diabetic PD patients was 90% during the first year, and of diabetic patients, 87%. This improved prognosis was confined to the first 2 years of the first dialysis ‘career’ (Table 3 Figures 1 and 2). The difference was less marked for older patients and diabetics, where it was not significant on an ITT analysis, but for no group could a detrimental effect of PD be demonstrated.
Change of dialysis modality was associated with an excess mortality (RR 1.11 per change of modality (CI 1.06–1.18, P<0.001)), independent of comorbidity and age. 465 patients aged 20–70 years changing from initial PD to HD, and 378 changing from HD to PD were compared with 2027 and 1286 patients, matched for age and diabetes, starting on HD and PD, respectively (Figure 2). There was a significantly increased mortality of second ‘career’ compared with first for both modalities. HD patients had an accelerated mortality during the first 6 months of the second dialysis ‘career’ amounting to 37.2±4.6 (SEM) %/year. These patients were sicker on transfer with a 9 and 3% (HD and PD patients, respectively) increased prevalence of atherosclerosis.
PD prevalence in the 13 major dialysis centres varied between 28 and 48%, there being no effect of PD prevalence on prognosis. HD patients treated at large centres had a poorer prognosis of 11%/100 ‘careers’/year (CI 2–26, P<0.02), while PD patients had a 25%/100 ‘careers’/year (CI 62–89, P<0.01) better prognosis.
H‐IPD was mainly used as an introductory treatment to CAPD, only 18% of H‐IPD ‘careers’ being long term (>3 months). CCPD prevalence increased from 3 to 16% during the period, while long‐term H‐IPD fell from 14 to 0%. CCPD and CAPD had the same prognosis (Figure 3), while H‐IPD had a significantly increased mortality (age and sex‐adjusted RR 1.69, CI 1.22–2.35, P<0.01) relative to CAPD.
Patients treated between 1996 and 1999 had an overall 22% better adjusted prognosis (P<0.001) than previous cohorts, which was similar on ‘history’ and ITT analysis. This was, however, related to an excess of PD patients with short, and correspondingly favourable, ‘careers’. If only the first 2 years of dialysis were included, the cohort had a 14% (CI 0–26, P=0.05) better prognosis; this was similar both for PD (16%) and HD (13%) patients.
1397 patients (877 HD, 520 PD) were subsequently transplanted. There was no difference in incidence of delayed graft function (HD 41%, PD 38%) or permanent graft non‐function (7 vs 5%), but 5‐ and 10‐day delayed function was significantly higher after HD than PD (26 vs 19%, P<0.01; 17 vs 11%, P<0.01) and time to onset of function was significantly longer (5.1±9.7 vs 3.5±7.0 days, P<0.05). No significant influence on graft survival was seen (5‐year graft survival 67 vs 72%).
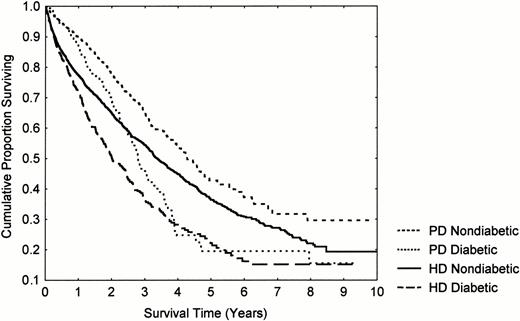
Influence of dialysis modality and diabetes on patient survival.
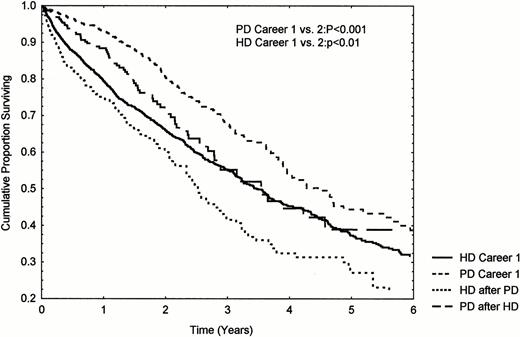
Influence of change of dialysis modality on survival. Patient groups aged 20–70 years, matched for age and diabetes.
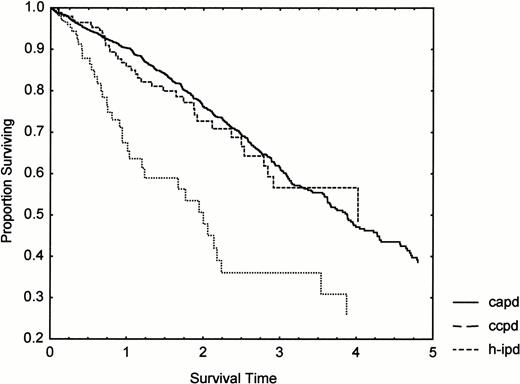
Influence of PD modality on mortality.
Clinical details and age‐ and sex‐adjusted relative mortality RRs for each morbidity factor compared to all other patients
| HD | PD | RR (CI) | ||||
| Age (years) (RR: per decade) | 55.1±16.8 | 53.5±15.2*** | 1.48 (1.43–1.53)*** | |||
| Sex (% female) | 38.7 | 40.2 | 0.99 (0.91–1.08) | |||
| Renal diagnosis (%) | ||||||
| Unknown | 17.3 | 17.2 | 0.84 (0.74–0.94)** | |||
| Glomerulonephritis | 17.8 | 18.8 | 0.73 (0.64–0.84)*** | |||
| Chronic interstitial nephritis | 14.5 | 12.0** | 0.85 (0.75–0.96)** | |||
| Polycystic kidneys | 8.5 | 9.8a | 0.63 (0.53–0.75)*** | |||
| Renovascular | 13.3 | 11.7* | 1.25 (1.11–1.41)*** | |||
| Diabetic nephropathy | 18.4 | 21.7*** | 1.80 (1.62–2.01)*** | |||
| Transplant candidate (%) | 34.3 | 42.9*** | 0.21 (0.18–0.25)*** | |||
| Comorbidity (%) | ||||||
| Cancer (excluding myeloma) | 9.3 | 7.0*** | 1.23 (1.08–1.41)*** | |||
| Myeloma | 0.8 | 0.5 | 2.90 (1.99–4.23)*** | |||
| Thyroid disease | 1.5 | 1.6 | 0.86 (0.61–1.21) | |||
| Diabetic retinopathy | 5.7 | 7.6*** | 1.91 (1.61–2.27)*** | |||
| Multiple diabetic complications | 10.2 | 12.4***a | 2.02 (1.76–2.32)*** | |||
| Hyperparathyroidism | 2.3 | 2.4 | 0.93 (0.68–1.26) | |||
| Blood dyscrasia | 11.3 | 8.7*** | 1.14 (1.00–1.31)* | |||
| Psykosis | 1.0 | 0.5* | 1.25 (0.821.90) | |||
| Neurosis | 1.0 | 0.6 | 0.74 (0.42–1.29) | |||
| Alcoholism | 1.8 | 1.2* | 1.86 (1.36–2.56)*** | |||
| Neurological disease | 5.8 | 6.2 | 1.15 (0.95–1.31) | |||
| Hypertension | 20.6 | 22.3a | 1.02 (0.92–1.13) | |||
| Cirrhosis | 1.1 | 0.8 | 1.31 (0.88–1.86) | |||
| Previous myocardial infarct | 1.2 | 1.4 | 2.21 (1.67–2.93)*** | |||
| Atherosclerotic heart disease | 6.7 | 6.8 | 1.61 (1.39–1.88)*** | |||
| Cerebrovascular disease | 6.0 | 4.6* | 1.75 (1.50–2.05)*** | |||
| Peripheral atherosclerosis | 3.2 | 2.7 | 1.79 (1.45–2.22)*** | |||
| Chronic obstructive lung disease | 1.0 | 0.5* | 3.02 (2.14–4.25)*** | |||
‘As treated’ analysis. A ‘history’ analysis of the clinical details revealed similar figures, and, except where stated, identical significance values. *P<0.05; **P<0.01; ***P<0.001. aP<0.01 using the ‘history’ analysis.
Cause of death in 2184 patients who died during the period of observation (%)
| ITT | As treated | |||||
| HD | PD | HD | PD | |||
| Number of patients | 1271 | 598 | 1651 | 533 | ||
| Cardiac | 45.8 | 49.0 | 45.5 | 49.7 | ||
| Vascular | 10.2 | 9.4 | 10.8 | 9.9 | ||
| Infection | 13.9 | 16.6 | 15.4 | 15.8 | ||
| Cancer | 7.2 | 5.9 | 6.2 | 5.6 | ||
| Treatment cessation | 8.7 | 5.0 | 7.5 | 5.3 | ||
| Uraemia | 6.1 | 6.0 | 6.2 | 5.8 | ||
| Other | 8.1 | 8.2 | 8.3 | 7.9 | ||
Patient total for the as treated analysis is slightly larger than the ITT analysis, as dialysis patients dying after a failed transplant are included in the former.
Age‐, sex‐ and comorbidity‐adjusted RR of mortality for PD patients compared with HD patients: subgroup and time interval analysis
| As treated | History | ITT | ||||
| All | 0.65 (0.59–0.72)*** | 0.65 (0.57–0.74)*** | 0.86 (0.78–0.95)** | |||
| <55 years | 0.57 (0.45–0.72)*** | 0.59 (0.44–0.80)*** | 0.90 (0.72–1.13) | |||
| >55 years | 0.66 (0.58–0.74)*** | 0.66 (0.57–0.76)*** | 0.85 (0.76–0.94)** | |||
| Non‐diabetic | 0.61 (0.54–0.70)*** | 0.62 (0.53–0.72)*** | 0.84 (0.75–0.94)** | |||
| Non‐diabetic <55 years | 0.46 (0.32–0.65)*** | 0.41 (0.24–0.68)*** | 0.83 (0.59–1.15) | |||
| Non‐diabetic >55 years | 0.64 (0.56–0.73)*** | 0.65 (0.55–0.76)*** | 0.84 (0.74–0.95)** | |||
| Diabetic | 0.69 (0.57–0.85)*** | 0.72 (0.57–0.90)*** | 0.93 (0.76–1.14) | |||
| Diabetic <55 years | 0.66 (0.48–0.90)** | 0.74 (0.50–1.10) | 0.91 (0.70–1.19) | |||
| Diabetic >55 years | 0.75 (0.57–0.99)* | 0.72 (0.53–0.99)* | 1.04 (0.75–1.43) | |||
| Time intervals (year) | ||||||
| 0–0.5 | 0.38 (0.31–0.46)*** | |||||
| 0.5–1.0 | 0.60 (0.47–0.78)*** | |||||
| 1.0–1.5 | 0.72 (0.55–0.95)* | |||||
| 1.5–2.0 | 0.89 (0.66–1.21) | |||||
| 2.0–3.0 | 1.10 (0.71–1.16) | |||||
| 3.0–4.0 | 1.15 (0.83–1.60) | |||||
| >4.0 | 0.78 (0.54–1.13) | |||||
*P<0.05; **P<0.01; ***P<0.001.
Discussion
As randomized studies of different dialysis modalities are almost impossible to perform, conclusions about their relative merits must rely on epidemiological data, with corrections being made for different case mix. This method is not infallible, with a number of statistical problems recently reviewed by Schaubel et al. [3]. Conventional morbidity variables may miss subtle differences in somatic and psychological health. There may be insufficient allowance for comorbidity, particularly in the present study where comorbidity was registered as in‐patient diagnoses only. Thus, 26% of patients in this material had registered cardiovascular disease compared with 46% in the study by Fenton et al. [2]; the true figure, based on echocardiographic studies is probably even higher [4]. Our model, however, has the advantage that it includes transplant candidate status, a powerful predictor of mortality in that transplant non‐candidates were five times more likely to die than age‐ and sex‐matched candidates. The population studied was nation‐wide and comprehensive and all dialysis data was incident. Other well‐known risk factors included in this model were age, cancer, myeloma, diabetes, diabetic complications, renovascular disease, cardiac disease, cerebrovascular disease, peripheral atherosclerosis, and COLD. Alcoholism and blood dyscrasias were also risk factors. The RR for cancer excluding myeloma was surprisingly low at 1.23; presumably, patients with disseminated malignant disease are less likely to be selected for active treatment of terminal uraemia. Another surprising finding was that hypertension was not an adverse factor. This is, however, in accordance with other recent epidemiological studies of dialysis patients [5], the implication being that systolic dysfunction with consequent hypotension and poor prognosis, is common in the dialysis population.
The present study shows a substantial advantage of PD over HD during the first 1–2 years of dialysis, after which results were approximately similar, except for diabetic patients where the advantage for PD patients was reversed after 2.5 years. Several studies have investigated the effect of dialysis modality. Most found no significant difference, although many of these studies do not have the statistical strength to detect a difference. Some [1,2,6,7] found a better prognosis for PD, others a poorer prognosis [8–10]. Our findings are very similar to the findings of Fenton et al. [2], using Canadian data, and Collins et al. using USA data [1], although the survival advantage in the Collins study was shorter. The advantage was, as found by others [1,2,11] lower for diabetics, where it was insignificant on ITT analysis. In contrast to others [1,11], we did not, however, find a detrimental effect of PD in this subgroup. The advantage was lower for older patients on ‘as treated’ and ‘history’ analysis, but not ITT analysis.
These data lend support to the hypothesis that, except for elderly diabetic patients, PD has a therapeutic advantage in the first 2 years of treatment of terminal renal failure, but, as stated above, do not exclude the possibility that the difference is due to unregistered selection bias. If the relationship is causal, one possible explanation is the fact that residual renal function (RRF), a major determinant of survival in PD, is better preserved in PD than HD [12,13]. Support for this possibility can be seen in Figure 2 where the initial low mortality on PD was not seen during second PD ‘careers’, where RRF presumably is minimal. Emergency referrals have a poorer prognosis than planned dialysis ‘careers’ [14]. It is probable that these patients are preferentially referred to HD, but it is unlikely that this is the explanation as censoring the data for early death does not remove the difference. Another possible explanation is that PD patients who die after transfer to HD due to increasing morbidity will be registered as HD deaths. This does indeed seem to be the case in this study: patients suffered an accelerated mortality for up to 6 months after transfer to HD (switches from HD to PD and repeated modality changes were also associated with increased mortality). Other reports have shown similarly increased mortality and morbidity after transfer, though Van Biesen et al. [15] found unchanged mortality. Patients in this study were probably being maintained on their original modality for too long, and the findings emphasize the need for timely modality transfer when dialysis related morbidity is observed. The relative advantage of PD was therefore reduced on the ITT analysis, but was still significant. This study, therefore, lends support to the ‘integrative care’ approach to dialysis therapy [15–17], where it is postulated that optimal outcomes will be achieved by an initial PD ‘career’ followed by transfer to HD when PD related morbidity increases.
The relative prognosis of PD became progressively poorer over time [1,2]. This may be due to loss of RRF, with consequent underdialysis of PD patients (who are often critically dependent on RRF), or to increased mortality related to PD complications, such as recurrent peritonitis and damage to the peritoneal membrane. The period under study was characterized by increasing attention to dialysis quantification (from virtually non‐existent to near‐universal). H‐IPD, with theoretical maximum clearances of 2–3 ml/min is clearly an inadequate therapy, resulting in excess mortality. The treatment is now obsolete, except as a short‐term introduction to other forms of PD. Increasing quantification may be one of the causes of a significant 14% improvement in prognosis during this period, similar for both dialysis modalities. Further improvements in long‐term HD and PD prognosis may be achieved in the future by the use of more biocompatible membranes and dialysis solutions.
As found by others [18,19], PD patients experienced a more rapid onset of graft function after transplantation than HD patients. The most likely cause of this is that PD patients will be better hydrated prior to transplantation. Pedantic attention to preoperative hydration may reduce this difference [20].
In contrast to Fenton's study [2], no beneficial effect of large centre size was seen. Large centres had a higher HD and a lower PD mortality, suggesting a preferential referral of high‐risk patients to HD at these centres. Dialysis treatment appears to be uniform in Denmark.
Correspondence and offprint requests to: Dr James Heaf, Graevlingestien 9, DK‐2880 Bagsvaerd, Denmark. Email: heaf@dadlnet.dk
References
Collins AJ, Wenli Hao MS, Ebben JP, Everson SE, Constantini EG, Ma JZ. Mortality risks of peritoneal dialysis and hemodialysis.
Fenton SSA, Schaubel DE, Desmeules M et al. Hemodialysis versus peritoneal dialysis: a comparison of adjusted mortality rates.
Schaubel DE, Morrison HI, Fenton SSA. Comparing mortality rates on CAPD/CCPD and hemodialysis. The Canadian experience: fact or fiction?
Foley RN, Parfrey PS, Harnett JD et al. Clinical and echocardiographic disease in patients starting end‐stage renal disease therapy.
Salem MM. Hypertension in the haemodialysis population: any relationship to 2‐years survival?
Maiorca R, Vonesh E, Cancarini GC et al. A six‐year comparison of patient and technique survivals in CAPD and HD.
Nelson CB, Port FK, Wolfe RA, Guire KE. Comparison of CAPD and hemodialysis patient survival with evaluation trends during the 1980s.
Bloembergen WE, Port KF, Mauger A, Wolfe RA. A comparison of mortality between patients treated with hemodialysis and peritoneal dialysis.
Locatelli F, Marcelli D, Conte F et al. Report on regular dialysis and transplantation in Lombardy.
Disney APS. Demography and survival of patients receiving treatment for chronic renal failure in Australia and New Zealand.
Held PJ, Port FK, Turenne MN, Gaylin DS, Hamburger RJ, Wolfe RA. Continuous ambulatory peritoneal dialysis and hemodialysis: comparison of patient mortality with adjustment for comorbid conditions.
Lysaght MJ, Vonesh EF, Gotch F et al. The influence of dialysis treatment modality on the decline of remaining renal function.
Moist LM, Port FK, Orzol SM et al. Predictors of loss of residual renal function among new dialysis patients.
Khan IH, Catto GRD, Edward N, Macleod AM. Death during the first ninety days of dialysis: a case control study.
Van Biesen W, Vanholder RC, Veys N, Dhont A, Lameire NH. An evaluation of an integrative care approach for end‐stage renal disease patients.
Coles GA, Williams JD. What is the place of peritoneal dialysis in the integrated treatment of renal failure?
Lameire N, Van Biesen W, Vanholder R. The role of peritoneal dialysis as first modality in an integrative approach to patients with end‐stage renal disease.
Van Biesen W, Vanholder R, Van Loo A, Van Der Vennet M, Lameire N. Peritoneal dialysis favorably influences early graft function after renal transplantation compared to hemodialysis.
Vanholder R, Heering P, Loo AV et al. Reduced incidence of acute renal graft failure in patients treated with peritoneal dialysis compared with hemodialysis.


Comments