


Abstract
Background. It has been suggested that urinary excretion of the vasopressin‐dependent water channel of the kidney collecting duct, aquaporin‐2 (AQP2), reflects renal vasopressin action and might be used clinically. It is unclear, however, what relation exists between urine osmolality and urinary excretion of AQP2 (UAQP2) and it is unknown whether UAQP2 is influenced by hyperosmolality of urine or tubular flow rates.
Methods. We measured urine osmolality and UAQP2 in healthy volunteers in various conditions: (i) overnight dehydration continued during the day, (ii) after infusion of 700 ml hypertonic saline (NaCl 2.5%), and (iii) after intranasal administration of 40 μg 1‐desamino‐8‐d‐arginine vasopressin (DDAVP). The last two tests were performed after water loading. In addition, a DDAVP test was performed, after administration of frusemide.
Results. After overnight dehydration, the urine osmolality increased from 888±18 to 1004±17 mosmol/kg during additional hours of thirsting, whereas UAQP2 doubled from 140±45 to 285±63 fmol AQP2/μmol creatinine. Infusion of hypertonic saline increased urine osmolality from 70±3 to 451±68 mosmol/kg, while UAQP2 remained almost zero. Urine osmolality increased from 101±17 to 860±30 mosmol/kg after administration of DDAVP, with a parallel increase in UAQP2 from 32±14 to 394±81 fmol AQP2/μmol creatinine. Pre‐treatment with frusemide attenuated the increase in urine osmolality, but had no effect on UAQP2 after DDAVP.
Conclusions. Our data demonstrate that a simple relationship between urine osmolality and UAQP2 does not exist. Therefore, random or once‐only measurements of UAQP2 as an index of renal vasopressin action are not useful. In contrast, intranasal application of DDAVP resulted in a parallel rise in urine osmolality and UAQP2. Therefore this test might be useful in studying patients with urine concentration defects. The DDAVP–frusemide test revealed that the release of AQP2 into urine is not caused by hypertonicity of tubular fluid.
Introduction
Homeostasis of the body osmolality is partly governed by water reabsorption through aquaporin‐2 (AQP2), the vasopressin (AVP)‐dependent water channel, present in cells of the cortical and medullary collecting ducts [1,2]. Binding of AVP to the basolaterally located AVP receptor (V‐2) of these cells leads to formation of 3′,5′‐cyclic adenosine monophosphate (cAMP), which triggers the fusion of subapically located AQP2‐containing vesicles with the apical membrane, resulting in water reabsorption through the cell [3] if a favourable osmotic gradient is present. Patients with inactivating mutations in either the V‐2 receptor or the AQP2 gene present with severe nephrogenic diabetes insipidus (NDI), which reflects the importance of the V‐2 receptor and AQP2 in the water balance of humans [4,5]. In addition, acquired forms of NDI can be caused by various drugs. Lithium, for instance, a widely used treatment for bipolar affective disorders, often causes NDI after prolonged use. It has been demonstrated previously that AQP2 is detectable in urine and that its excretion increases in response to AVP [6–8]. Two possible explanations for the release of AQP2 into urine have been postulated: first, osmotic stress on collecting duct cells during antidiuresis could cause lysis of these cells, thus releasing AQP2 into the urine; second, secretion or exocytosis of AQP2 molecules with or without apical membrane fragments upon AVP action could explain urinary excretion of AQP2. Although the mechanism of AQP2 excretion in urine remains to be identified, it has been suggested that urinary excretion of AQP2 (UAQP2) can be used as a diagnostic tool in studying patients with urinary concentration defects [7,9].
In order to ascertain that UAQP2 is a relevant parameter in the study of patients with urine concentration defects, it is necessary to study if UAQP2 indeed reflects urine concentration kinetics in humans. Therefore we measured UAQP2 in healthy volunteers during different conditions: an overnight dehydration test, infusion with hypertonic saline, and intranasal administration of the AVP analogue 1‐desamino‐8‐d arginine vasopressin (DDAVP). Prolonged dehydration clarifies the long‐term effects of AVP stimulation on urine osmolality and UAQP2. The infusion of hypertonic saline allows the analysis of short‐term effects of AVP stimulation, triggered by the rise in serum osmolarity upon saline infusion. Data of supraphysiological stimulation are provided by the DDAVP test. In addition, in a separate set of experiments we have measured UAQP2 after administration of DDAVP, with and without pre‐treatment with the loop diuretic frusemide. Administration of frusemide will impair the urinary concentration process by reducing the medullary osmotic gradient. In this setting, the influences of urine osmolality and urine flow on the release of AQP2 into urine are addressed.
Subjects and methods
Volunteers
Six healthy volunteers (age 21–25 years; four females (weight 55–70 kg), two males (weight 70 and 87 kg)), with no history of kidney disease or hypertension participated in the dehydration, saline infusion, and DDAVP tests. Five other healthy volunteers (age 21–27 years; three females (weight 53–66 kg), two males (weight 68 and 83 kg)) participated in the DDAVP–frusemide and control DDAVP tests. During the tests, the volunteers were seated and only allowed to stand during voiding. The minimal time interval between the tests was 3 days. All volunteers were allowed to have a light, fluid‐restricted meal before and during the tests. The protocols were approved by the Committee for Experimental Research on Humans of the University of Nijmegen, The Netherlands. All volunteers gave written informed consent.
Dehydration test
The participants refrained from drinking for up to 20 h, starting with an overnight dehydration period. Urine samples were taken at 2‐h intervals, starting at arrival in the ward (t=0 h), approximately 12 h after the start of the thirsting period.
Hypertonic saline infusion test
The subjects were asked to drink water until a constant urine flow of 150–200 ml per 15 min was reached. Subsequently, hypertonic saline (700 ml NaCl 2.5%) was infused in a period of 45 min, while oral water intake was kept constant (approximately 150 ml/10 min). When urine flow returned to 150–200 ml per 15 min, after the saline infusion, the test was considered complete. Blood and urine samples were obtained at indicated time intervals before and after the saline infusion.
DDAVP test
The participants were asked to refrain from drinking from 10.00 p.m. the night before the test. After urination at 8.00 a.m., water was given until a constant urine flow was obtained of approximately 150 ml per 15 min. Subsequently, 40 μg DDAVP was administered intranasally. Urine samples were obtained at 2‐h intervals until 5 h after administration of the drug.
DDAVP–frusemide test
This test was similar to the DDAVP test, except that 40 mg frusemide was injected intravenously, 15 min prior to DDAVP administration. Urine samples were collected every 15–20 min during the first hour after the frusemide injection, with subsequent collection at 2, 2.5 and 5 h after administration of DDAVP. For control experiments, a DDAVP test was also performed without pre‐treatment with frusemide.
Urine samples
A small aliquot of urine was taken for measurement of osmolality and creatinine concentration by standard automated techniques. Aliquots of urine obtained during the saline infusion test were also analysed for vasopressin levels by a radioimmunosorbent assay adjusted from the method described by Tausch et al. [10]. Since pilot experiments had shown that AQP2 is stable at −80°C for several months, we stored the remaining urine samples at −80°C until analysis for AQP2 content was performed. Urine samples were centrifuged at 200 g to remove cellular debris. The supernatant was initially concentrated by ultrafiltration using Amicon stirred cells with YM10 membranes (Amicon Inc., Beverly, USA) according to the protocol provided by the manufacturer. Subsequently, further concentration of the samples was achieved by using a Centriprep 10 (Amicon Inc.), according to the manufacturer's instructions, until the final volume was 0.5–1.0 ml. Concentrated urine samples were stored at −80°C in the presence of a protease inhibitor mix containing 1 mmol/l phenylmethylsulphonyl fluoride, 5 μg/ml leupeptin and 5 μg/ml pepstatin. Pilot experiments showed that the recovery rate of total AQP2 was approximately 90%.
Quantification of AQP2
Urine equivalents of 4 μmol creatinine were dissolved in Laemmli sample buffer containing 100 mmol/l dithiothreitol (DTT) and denatured for 30 min at 37°C. After SDS–PAGE the gel was immunoblotted onto immobilon polyvinyl membranes (Millipore, Bedford, USA) as described [11]. The efficiency of protein transfer was checked by staining the membranes with ponceau red.
Subsequently, the blots were blocked for 1 h with 5% non‐fat dried milk in Tris‐buffered saline (20 mmol/l Tris, 73 mmol/l NaCl; pH 7.6), containing 0.2% Tween (v/v) and incubated with a 1 : 3000 or a 1 : 500 (saline infusion tests) dilution of affinity‐purified rabbit anti‐AQP2 immunoglobulins, which have been raised against the 15 C‐terminal amino‐acids of rat AQP2 [12]. As secondary antibodies, we used a 1 : 5000 dilution of affinity‐purified goat anti‐rabbit antibodies (whole molecule; Sigma, St Louis, USA), coupled to horseradish peroxidase. Sites of antigen–antibody reactions were visualized with enhanced chemiluminescence (ECL, Boehringer Mannheim, Mannheim, Germany), according to the protocol provided by the manufacturer.
In order to quantitate the amounts of AQP2 in a urine sample, a synthetic peptide corresponding to the last 15 amino‐acids of rat AQP2 and an additional nor‐leucine was conjugated to bovine serum albumin (BSA) as described [13]. The nor‐leucine was used to determine the number of AQP2 peptides per BSA molecule. Amino‐acid analysis of the obtained conjugate revealed that 17.7 molecules of AQP2 were coupled to 1 molecule of BSA, from which it could be calculated that 1 ng BSA–AQP2 corresponds to 180 fmol AQP2. A twofold dilution series of this conjugate was used during every immunoblot analysis to standardize for the amount of AQP2 in the samples. The bands of the standards and the unglycosylated (29 kDa) form of the samples on X‐ray film were scanned with a densitometer and quantified using software provided by the manufacturer (Biorad, München, Germany). A curve was constructed of known conjugate amounts vs densitometric units. Subsequently the densities of the samples were converted to numerical values calculated from the linear part of the standard curve (Figure 1). No correction for the amount of glycosylated AQP2 was performed in the present study, but we have shown previously that 35–45% of AQP2 in urine is glycosylated [13]. In addition, it has previously been demonstrated that 40% of AQP2 in urine is membrane bound and 60% is free [11], but it can be assumed that both fractions are determined in our assay, since samples are prepared in the presence of the detergent SDS. To correct for incomplete or variable urine sampling, UAQP2 is expressed per μmol creatinine, because it can be expected that in periods of low urine flow, errors in sampling can easily occur.
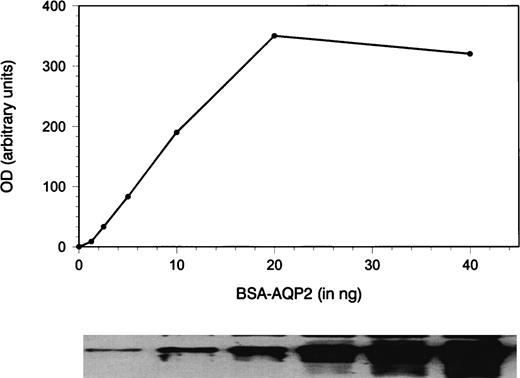
Quantification of AQP2 by immunoblotting and densitometric scanning. A dilution series of a synthetic peptide corresponding to the last 15 amino acids of rat AQP2 conjugated to BSA was used as standard and immunoblotted. The band densities were quantitated by densitometric scanning (OD, arbitrary units). A standard curve was constructed and the linear part of the curve was used to quantitate the unglycosylated amount of AQP2 in the urine samples. Amino‐acid analysis revealed that 1 ng conjugate corresponds to 180 fmol AQP2.
Blood samples
Blood samples drawn by venepuncture were collected at the same time‐points indicated for the urine specimens. Plasma osmolality and sodium concentrations were determined using standard laboratory techniques.
Statistical analysis
Pearson correlation was determined by regression analysis. Significance of correlation was determined by Z‐ transformation. Comparisons between groups were done by ANOVA. Statistical comparison between mean urine osmolality or UAQP2 values within a test was performed by the Wilcoxon test. A value of P<0.05 is considered significant. Unless otherwise mentioned, values are given as means±SEM.
Results
Dehydration test
It has previously been found, that the urinary excretion of AQP2 is high after overnight dehydration [6], but it is unknown whether it remains constant during prolonged dehydration in humans. We therefore determined urine osmolality and UAQP2 in six individuals for 8 h after overnight dehydration. Urine flow decreased from 1.0–0.2 ml/min after overnight dehydration to 0.6±0.1 ml/min at the end of the dehydration period. In this period urine osmolality increased from 888±18 to 1004±17 mosmol/kg, while UAQP2 doubled from 140±45 fmol AQP2/μmol creatinine to 285±63 fmol AQP2/μmol creatinine, which is a statistically significant rise in both parameters (P<0.05) (Figure 2).
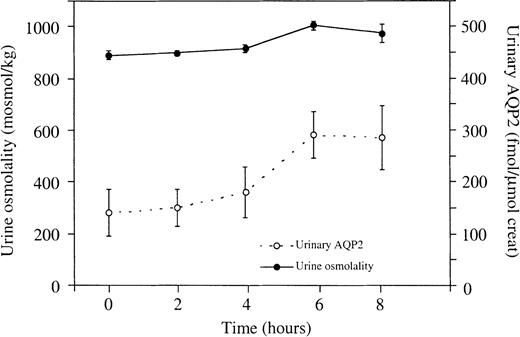
Effects of prolonged dehydration on urine osmolality and UAQP2. The first urine samples were collected after 12 h of thirsting (t=0 h). Both urine osmolality and UAQP2 increased significantly (P<0.05). There was no statistical relationship between urine osmolality and UAQP2 (P>0.05). Values are given as means±SEM.
Saline infusion test
To study subtle effects of AVP modulation on UAQP2, water‐loaded healthy volunteers were subjected to a hypertonic saline infusion test, which augmented plasma osmolality from 282±2.0 before to 290±1.5 mosmol/kg H2O directly after saline infusion. Urinary AVP excretion increased from 2.6±1.8 pmol/min at baseline to 34±7.0 pmol/min directly after saline infusion (P<0.05) and the calculated free water clearance decreased from 1.7±0.6 ml/min directly before infusion to −1.9±0.8 ml/min (P<0.05), indicating free water reabsorption after saline infusion. Urine flow levels were 12.8±2.9 ml/min directly before infusion and minimized to 2.5±0.6 ml/min after infusion. Mean urine osmolality rose from 70±3 to 451±68 mosmol/kg after saline infusion (P<0.05). However, during the test no major change in UAQP2 was observed, with maximum excretion of 8±2 fmol AQP2/μmol creatinine (Figure 3).
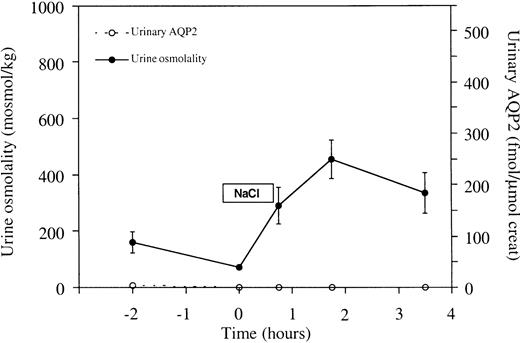
Effects of hypertonic saline infusion on urine osmolality and UAQP2. From t=0 to t=45 min, 700 ml NaCl 2.5% was infused. Urine osmolality rose significantly upon saline infusion (P<0.05). However, during the test no major change in UAQP2 was observed. No statistically significant relationship was found between urine osmolality and UAQP2 (P>0.05). Values are given as means±SEM.
DDAVP test
To investigate whether a relationship between urine osmolality and UAQP2 exists after a supraphysiological stimulus, 40 μg of DDAVP was administered to water‐loaded healthy volunteers. Within 4 h after intranasal administration of DDAVP, urine osmolality increased more than 8‐fold from 101±17 to 860±30 mosmol/kg (P<0.05). A parallel increase in UAQP2 was found from 32±14 to 394±81 fmol AQP2/μmol creatinine (Figure 4). Urine flow decreased from 9.0±1.9 ml/min just before application of DDAVP to 0.6±0.2 ml/min at the end of the test.
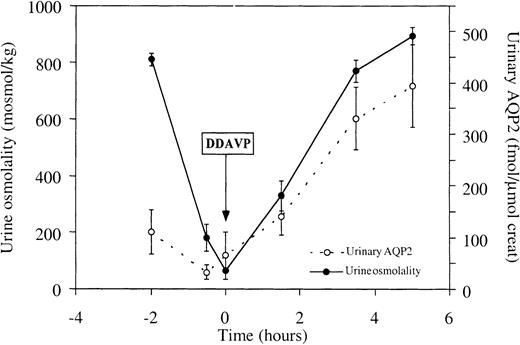
Effects of the administration of DDAVP on urine osmolality and UAQP2. DDAVP was administered at t=0. Urine osmolality increased more than eightfold (P<0.05), with a parallel increase in UAQP2 (P<0.05). Values are given as means±SEM.
Combined data
When plotting the data from the three above‐mentioned tests together, it is clear, that no statistically significant correlation between UAQP2 and urine osmolality exists for the dehydration or saline infusion tests (Figure 5). However, the data of the DDAVP test reveal a significant correlation between UAQP2 and urine osmolality (R=0.57, P<0.05).
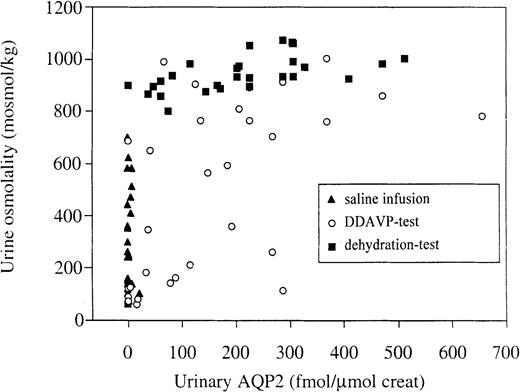
Relationship between urine osmolality and UAQP2. The data of the three tests are plotted together. Analysis of the data per test condition showed no correlation between osmolality and UAQP2, except for the DDAVP test (R=0.57, P<0.05).
DDAVP–frusemide test
Additional DDAVP tests, performed with and without pre‐treatment with 40 mg frusemide 15 min prior to DDAVP administration, were carried out to study whether hyperosmolality of urine is a cause for release of AQP2 into urine. Frusemide pre‐treatment attenuated the increase in urine osmolality after administration of DDAVP (Figure 6a). In contrast, frusemide pre‐treatment did not inhibit the rise in UAQP2 excretion after DDAVP administration (Figure 6b). Similar UAQP2 excretion was found at t=1 and t=5 h after administration of DDAVP, while urine flow rates were 4.2±1.1 and 0.7±0.2 ml/min, respectively. Although both urine osmolality and UAQP2 increased significantly during the test (P<0.05), no statistically significant correlation between urine osmolality and UAQP2 could be found during the DDAVP–frusemide test.
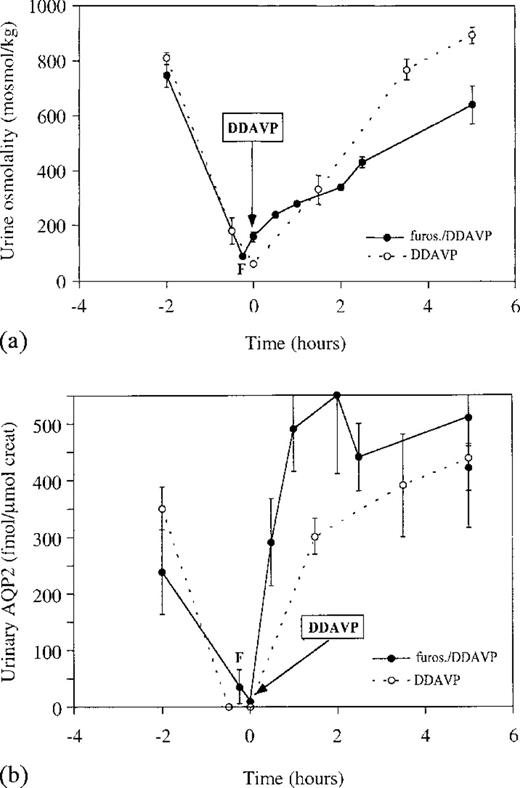
Effects of the administration of DDAVP on (a) urine osmolality and (b) UAQP2, with and without pre‐treatment with frusemide. DDAVP was administered at t=0 min, (○) without and (•) after treatment with frusemide. Although urine osmolality and UAQP2 increased significantly during both tests (P<0.05), the previously described relationship between urine osmolality and UAQP2 seen during the DDAVP test (Figure 4), was lost upon pre‐treatment with frusemide (P>0.05).
Discussion
It has previously been proposed, also in a recent editorial in this journal, that measurements of UAQP2 could provide a clinically important diagnostic tool for diagnosis and follow‐up of patients with urinary concentration defects [–9,14]. However, a critical review of the published data on this subject suggests that such conclusions are not justified. Most data are derived from once‐only measurements under uncontrolled conditions and at relatively high levels of AVP. Detailed information about the relationship between UAQP2 and urinary concentrating ability under various conditions is missing, limiting its introduction in a clinical setting. Furthermore, it is unclear whether hypertonicity of the urine is an important determinant for release of AQP2 into urine of humans, and if this release is influenced by urine flow. We have therefore measured UAQP2 in healthy volunteers subjected to different stimuli for urinary concentration, i.e. an 20‐h dehydration test, the infusion of hypertonic saline, and the administration of DDAVP. In addition, a DDAVP–frusemide test was performed to study whether hypertonicity of tubular fluid or urinary flow rate determine the release of AQP2 into urine.
In order to quantify AQP2, a quantitative immunoblot assay was set up, according to the method described by Elliot et al. [7]. The minimal detectable amount of AQP2 using this method was 7 fmol AQP2, while previous studies using a radioimmunoassay (RIA) revealed a minimal detectable amount of 0.86 pmol AQP2 [9], illustrating a more than 100‐fold gain in sensitivity for minimal amounts of AQP2, to the benefit of the immunoblot technique. Excretion of UAQP2 by the volunteers in the present study is approximately 1.5 times the excretion of UAQP2 reported by other investigators using a RIA [8]. This could be explained by variations in methodologies and standards, but might also be explained by inability of a RIA to detect membrane‐associated AQP2, which constitutes 40% of total urinary AQP2 [11]. We would like to emphasize that no data are currently available to indicate that the separate fractions respond differently to AVP. Because UAQP2 excretion was measured in volume equivalents of 4 μmol creatinine, our results could have been biased by changes in creatinine excretion. However, throughout all the tests, overall creatinine excretion was quite stable and the conclusions remain similar when UAQP2 is expressed per μmol creatinine or time. Data of the present dehydration test show high UAQP2 excretion after overnight dehydration, followed by a doubling in UAQP2 excretion during prolonged dehydration with only a modest increase in urine osmolality. This clearly demonstrates a dissociation between UAQP2 and urine osmolality during prolonged AVP action. High excretion of UAQP2, measured once only directly after overnight dehydration, has been reported by several investigators [6,8,9], and a weak correlation between urine osmolality and UAQP2 was reported in a study by Rai et al. [8]. In another study by Saito et al. [9], a correlation between urine osmolality and UAQP2 was not found, which is in accordance with the data provided by our prolonged dehydration test.
During our hypertonic saline infusion test, subtle effects of rapid AVP modulation on UAQP2 were studied. UAQP2 excretion remained low and almost zero during the test, despite a significant rise in AVP excretion upon saline infusion. An increase in AVP action is also indicated by the fact that urine osmolality was higher than serum osmolality due to proven free‐water reabsorption. Careful observation of the data of the saline infusion test in Figure 5 further illustrates that a substantial number of urine specimens have osmolality levels far above serum osmolality, while UAQP2 remains zero. Two other investigators have previously studied the effects of hypertonic saline infusion on UAQP2 [7,9]. First, Elliot et al. [7] infused NaCl 3% at a rate of 0.1 ml/kg/min for 90 min in healthy volunteers after overnight dehydration. Consequently, baseline urine osmolality values were rather high (on average 645 mosmol/kg). After infusion, UAQP2 increased sevenfold, while urine osmolality augmented slightly in their study [7], further illustrating a dissociation between urine osmolality and UAQP2. Later, Saito et al. [9] infused NaCl 5% at a rate of 0.05 ml/kg/min for 120 min in healthy, water‐loaded volunteers. Urine osmolality rose from around 100 mosmol/kg to 700 mosmol/kg during the saline infusion period. However, the 12‐fold rise in UAQP2 upon saline infusion occurred 60 min after the rise in urine osmolality and was not apparent until 120 min after the start of the saline infusion [9], further illustrating the dissociation between urine osmolality and UAQP2 at a given point of time. The data of the previous and our study indicate that prolonged and sustained AVP action is essential for a significant detectable rise of UAQP2.
In our study, intranasal administration of DDAVP to healthy volunteers resulted in a rapid and sustained increase in urine osmolality coinciding with a rise in UAQP2, already apparent at urine osmolality values below 300 mosmol/kg. This effect is in sharp contrast to the data of our hypertonic saline infusion test, in which UAQP2 excretion was zero at urine osmolality levels of approximately 300 mosmol/kg. Apparently there are clear differences in the response of UAQP2 to endogenous AVP and the specific V‐2 agonist DDAVP.
A significant correlation between urine osmolality and UAQP2 after administration of DDAVP was found in the present study. However, it is likely that this relationship is dependent on the mode of AVP administration, because intravenous bolus injection of DDAVP was previously shown to give a rapid increase in UAQP2 with peak excretion within 1 h, while urine osmolality increased more slowly, reaching maximum levels 3 h after the drug was given [6,9]. Variations in pharmacokinetics between intravenous and intranasal administration of DDAVP are thus likely to explain the difference between previous published data and our findings [15].
The mechanisms responsible for the release of AQP2 into urine in humans are still unknown. It is thought, for instance, that increased shuttling of AQP2 towards the apical membrane upon stimulation with AVP could result in subsequent loss of AQP2 with or without apical membrane fragments, thus making detection of AQP2 protein in urine possible. It could furthermore be thought that hypertonicity of tubular fluid upon AVP stimulation could result in lysis of collecting duct cells, through which AQP2 could be released into the urine. The data of the DDAVP–frusemide test clearly show, however, that hypertonicity of tubular fluid is not a factor in the release of AQP2 into urine. Therefore, it is unlikely that excretion of AQP2 into urine is induced through hypertonicity‐induced lysis of collecting duct cells. Our findings are in accordance with recent data provided by Wen et al. [17], who demonstrated in rat that the urinary excretion of the basolaterally located aquaporin‐3 is lower than that of AQP2, and they furthermore revealed that the urinary excretion of AQP2 in rat takes place via a selective apical pathway.
The data of the DDAVP–frusemide test additionally showed high AQP2 excretion during both high and low urine flow phases of the test, demonstrating that excretion of AQP2 into urine is not dependent on urine flow. It is surprising to find that AQP2 excretion is higher with combined frusemide–DDAVP treatment than with DDAVP administration alone. Osmotic water transport through AQP2 is mediated through hypertonicity of the renal medulla and the osmotic gradient could be a factor in preventing loss of AQP2 molecules from collecting duct cells. Elaborating on this hypothesis, it could be that frusemide influences this AQP2 retention factor, through interference with the build‐up of the osmotic gradient in the renal medulla.
Studies at the cellular and molecular level have revealed that AVP‐dependent osmotic water transport by AQP2 is regulated by long‐ and short‐term processes. The short‐term upregulation of osmotic water transport, probably seen in the initial phase of (DD)AVP application, is regulated by an AVP‐induced rise in cAMP, triggering a redistribution of water channels from intracellular vesicles to the apical membrane [18]. Long‐term upregulation of osmotic water transport, for instance during prolonged dehydration, is due to increased expression of AQP2 mRNA and protein by AVP [19]. Downregulation of AQP2 expression has been shown to be a relatively rapid process, since removal of AVP from the V‐2 receptor in dehydrated rats results in downregulation of AQP2‐mRNA within minutes, concomitant with a reduction in AQP2 expression [20]. The sharp decrease in UAQP2 found in individuals who were water‐loaded after overnight dehydration in our study, seems to demonstrate this latter pattern.
In conclusion, excretion of AQP2 into urine is independent of urine flow and not caused by hypertonicity of renal tubular fluid. In addition, UAQP2 does not quantitatively reflect AVP‐dependent water transport in the kidney collecting duct in humans. Therefore, random and once‐only measurements of UAQP2, also after thirsting or hypertonic saline infusion, cannot be used as an index of AVP action on the kidney. In contrast, UAQP2 increased in parallel with urine osmolality after intranasal administration of DDAVP. It seems worthwhile to study whether such a test could be useful to assess patients with urinary concentration defects.
Correspondence and offprint requests to: R. Baumgarten, University of Nijmegen, 162, Department of Cell Physiology, Trigon Building, PO Box 9101, NL‐6500 HB Nijmegen, The Netherlands.
We acknowledge the technical advice of Jaap van den Born, Gerard Pesman, and Fred Sweep. We thank the technicians of the Central Clinical Chemical Laboratory, University Hospital Nijmegen, The Netherlands (Head, Professor Dr J. Willems), for determining urine and plasma chemical values. This study was supported by the Dutch Science Foundation (NWO‐SMW‐920–03–009) to RB, the Dutch Kidney Foundation (C95–5001) to CH v. O, and the Netherlands Royal Society of Arts and Sciences to PMTD.
References
Fushimi K, Uchida S, Hara Y, Hirata Y, Marumo F, Sasaki S. Cloning and expression of apical membrane water channel of rat kidney collecting duct.
Nielsen S, Chou CL, Marples D, Christensen EI, Kishore BK, Knepper MA. Vasopressin increases water permeability of kidney collecting duct by inducing translocation of aquaporin‐CD water channels to plasma membrane.
Nielsen S, Marples D, Frøkiaer J, Knepper MA, Agre P. The aquaporin family of water channels in kidney: An update on physiology and pathophysiology of aquaporin‐2.
Deen PMT, Verdijk MA, Knoers NVAM et al. Requirement of human renal water channel aquaporin‐2 for vasopressin‐dependent concentration of urine.
Van den Ouweland AM, Dreesen JC, Verdijk M, Knoers NV. Mutations in the vasopressin type 2 receptor gene (AVPR2) associated with nephrogenic diabetes insipidus.
Kanno K, Sasaki S, Hirata Y et al. Urinary excretion of aquaporin‐2 in patients with diabetes insipidus.
Elliot S, Goldsmith P, Knepper M, Haughey M, Olson B. Urinary excretion of aquaporin‐2: A potential marker of collecting duct responsiveness to vasopressin.
Rai T, Sekine K, Kanno K et al. Urinary excretion of aquaporin‐2 water channel protein in human and rat.
Saito T, Ishikawa S, Sasaki S et al. Urinary excretion of aquaporin‐2 in the diagnosis of central diabetes insipidus.
Tausch A, Stegner H, Leake RD, Artman HG, Fisher DA. Radioimmunoassay of arginine vasopressin in urine: Development and application.
Deen PMT, Van Aubel RA, Van Lieburg AF, Van Os CH. Urinary content of aquaporin 1 and 2 in nephrogenic diabetes insipidus.
Deen PMT, Croes H, Van Aubel RA, Ginsel LA, Van Os CH. Water channels encoded by mutant aquaporin‐2 genes in nephrogenic diabetes insipidus are impaired in their cellular routing.
Baumgarten R, Van de Pol MHJ, Wetzels JFM, Van Os CH, Deen PMT. Glycosylation is not essential for vasopressin‐dependent routing of aquaporin‐2 in transfected Madin–Darby canine kidney cells.
Ishikawa S, Sasaki S, Saito T, Saito T. Urinary excretion of aquaporin‐2 in disorders of water metabolism.
Andersson KE, Bengtsson B, Paulsen O. Desamino‐8‐D‐arginine vasopressin (dDAVP): Pharmacology and clinical use.
Knepper MA, Inoue T. Regulation of aquaporin‐2 water channel trafficking by vasopressin.
Wen H, Frøkiœr J, Kwon T, Nielsen S. Urinary excretion of aquaporin‐2 in rat is mediated by a vasopressin‐dependent apical pathway.
Yamamoto N, Sasaki S, Fushimi K et al. Vasopressin increases AQP‐CD water channel in the apical membrane of collecting duct cells without affecting AQP3 distribution in Brattleboro rat.
Matsumura Y, Uchida S, Rai T, Sasaki S, Marumo F. Transcriptional regulation of aquaporin‐2 gene by cAMP.


Comments