


Abstract
Background: Studies have shown that chronic stress or UV radiation independently suppress immunity. Given their increasing prevalence, it is important to understand whether and how chronic stress and UV radiation may act together to increase susceptibility to disease. Therefore, we investigated potential mediators of a stress-induced increase in emergence and progression of UV-induced squamous cell carcinoma. Methods: SKH1 mice susceptible to UV-induced tumors were unexposed (naïve, n = 4) or exposed ( n = 16) to 2240 J/m 2 of UVB radiation three times a week for 10 weeks. Half of the UVB-exposed mice were left nonstressed (i.e., they remained in their home cages) and the other half were chronically stressed (i.e., restrained during weeks 4–6). UV-induced tumors were measured weekly from week 11 through week 34, blood was collected at week 34, and tissues were collected at week 35. mRNA expression of interleukin (IL)-12p40, interferon (IFN)-γ, IL-4, IL-10, CD3ϵ, and CCL27/CTACK, the skin T cell–homing chemokine, in dorsal skin was quantified using real-time polymerase chain reaction. CD4 + , CD8 + , and CD25 + leukocytes were counted using immunohistochemistry and flow cytometry. All statistical tests were two-sided. Results: Stressed mice had a shorter median time to first tumor (15 versus 16.5 weeks, difference = 1.5 weeks, 95% confidence interval [CI] = −3.0 to 3.3 weeks; P = .03) and reached 50% incidence earlier than controls (15 weeks versus 21 weeks). Stressed mice also had lower IFN-γ ( mean = 0.03 versus mean = 0.07, difference = 0.04, 95% CI = 0.004 to 0.073; P = .02), CCL27/CTACK (mean = 101 versus mean = 142, difference = 41, 95% CI = 8.1 to 74.4; P = .03), and CD3ϵ (mean = 0.18 versus mean = 0.36, difference = 0.18, 95% CI = 0.06 to 0.30; P = .007) gene expression and lower numbers of infiltrating CD4 + cells (mean = 9.40 versus mean = 13.7, difference = 4.3, 95% CI = 2.36 to 6.32; P = .008) than nonstressed mice. In addition, stressed mice had more regulatory/suppressor CD25 + cells infiltrating tumors and more CD4 + CD25 + cells in circulation (mean = 0.36 versus mean = 0.17, difference = 0.19, 95% CI = 0.005 to 0.38; P = .03) than nonstressed mice. Conclusions: Chronic stress increased susceptibility to UV-induced squamous cell carcinoma in this mouse model by suppressing type 1 cytokines and protective T cells and increasing regulatory/suppressor T cell numbers.
Stress and sunlight and are two factors that affect many people's daily lives. Both can be beneficial in moderation, but long-term exposure to either can be detrimental in that both may contribute to the development and/or exacerbation of disease. It is estimated that over 2–3 million new cases of nonmelanoma skin cancer occur each year ( 1 ) . Because of a host of psychosociopolitical factors, stress has become an increasing and inevitable part of people's lives. Chronic stress has been shown to dysregulate immune function ( 2 ) and is thought to play a role in the etiology of many diseases. Given the increasing prevalence of exposure to chronic stress and UV radiation and their ability to independently induce pathologic effects, it becomes important to understand whether and how these factors may act together to increase susceptibility to disease.
Stress is defined as a constellation of events—a stimulus (stressor) that precipitates a reaction in the brain (stress perception) and activates physiologic fight/flight systems in the body (stress response) ( 3 , 4 ) . Chronic stress, defined as stress that persists for several hours a day for weeks, months, or years ( 3 , 4 ) , has been shown to have immunosuppressive effects ( 2 ) that include suppression of skin cell–mediated immunity ( 3 ) .
The UVB component of sunlight is a complete carcinogen and is responsible for most nonmelanoma skin cancers ( 5 ) . Immediate effects of UVB radiation include DNA damage, epidermal hyperplasia, and inflammation ( 6 ) . UVB also suppresses lymphocyte trafficking, T cells, natural killer cell function ( 7 ) , and immune responses that are directed against squamous cell carcinoma ( 8 , 9 ) .
Here we test the hypothesis that chronic stress accelerates the emergence and progression of UVB-induced squamous cell carcinoma and inhibits its regression. We examined the effects of moderate chronic stress on the emergence, progression, and regression of squamous cell carcinoma induced by low-level (minimal erythemal dose [MED], i.e., without blistering) exposure to UVB radiation in a mouse model. Our goal was to identify potential molecular and cellular immunologic mediators of the exacerbating effects of chronic stress on the emergence and progression of squamous cell carcinoma. Because both squamous cell carcinoma and basal cell carcinoma are immunogenic nonmelanoma skin cancers, our findings may also be applicable to basal cell carcinoma, which is the most common form of skin cancer in the United States ( 10 ) .
M ATERIALS AND M ETHODS
Mice
Young adult (7–8 weeks) female SKH1 mice (Charles River, Wilmington, MA) were housed in the accredited (Association for Assessment and Accreditation of Laboratory Animal Care International) animal facilities of The Ohio State University. SKH1 hairless mice are widely used in studies involving UVB exposure and skin cancer, and UVB-induced lesions in this strain resemble human squamous cell carcinoma ( 11 – 13 ) . Experiments were conducted according to the protocol approved by the Institutional Laboratory Animal Care and Use Committee. The animal room was maintained on a 12-hour light–dark cycle (lights on at 6 AM ). Mice were given food and water ad libitum.
Experimental Design
Data presented here are from a single experiment. Similar results were reproduced in two additional independent experiments (data not shown). The nonstressed control group remained in their home cages whereas the chronically stressed group ( n = 8 mice per group) was moved to restraining cages. Chronic stress was administered during weeks 4–6 of 10 weeks of UVB exposure. Both the nonstressed and chronic stress groups were exposed to UVB as described below. The “naive” control group ( n = 4) was not exposed either to stress or to UVB. Mice were monitored for tumor development (number and size) from weeks 11 through 34. Naïve control animals did not develop tumors at any point during the study. At week 35 mice were killed by CO 2 euthanasia. Tissues were dissected and stored at −70 °C.
UVB Radiation
Mice were irradiated three times per week (on Monday, Wednesday, and Friday) for 10 consecutive weeks. Mice were placed in plastic cages during each irradiation session that were rotated between sessions with respect to their location under the light banks to ensure homogeneous UVB distribution. Mice were exposed to UVB from sunlamps (American Ultraviolet Company, Murray Hill, NJ) fitted with Kodacel filters (Eastman Kodak, Rochester, NY) that allow UVB light to pass through (290–320 nm). A UVB dose of 2240 J/m 2 (MED, approximately a 10-minute exposure), as measured by a UVX digital radiometer (UVP, Inc., San Gabriel, CA), was administered. This MED was previously determined and was recently validated by T.M.O. (unpublished data).
Stress Exposure
Mice were stressed 6 hours per day for 21 days during weeks 4–6 of UVB exposure. On days of UV exposure, the stress session preceded UV exposure. Stress was administered by placing each mouse in an adequately ventilated restrainer while ensuring that the mouse was not squeezed or compressed. This procedure mimics stress that is largely psychological in nature because of the perception of confinement experienced by the mice ( 14 , 15 ) . It activates the sympathetic nervous system ( 16 ) and the hypothalamic-pituitary-adrenal axis ( 17 , 18 ) and results in the activation of adrenal steroid receptors in tissues throughout the body ( 17 , 18 ) . Importantly, as shown later, this model of moderate chronic stress does not decrease body, spleen, or thymus weight and does not impair the overall health of the mice.
Blood Collection for Corticosterone Analysis
Blood was collected (at approximately 9:00 AM ) during week 34. Mice were lightly anesthetized using isoflurane, and approximately 60 μL of blood was collected from the retro-orbital sinus into heparinized tubes. Plasma aliquots were obtained immediately and stored at −70 °C.
Corticosterone Radioimmunoassay
Plasma corticosterone was determined using the ImmuChem Double Antibody Corticosterone I 125 RIA Kit (MP Biomedicals, Inc., Costa Mesa, CA) according to the manufacturer's instructions. Samples were counted on a Packard Cobra II Gamma Counter (Packard Instrument Co., Meridian, CT). All corticosterone values are reported in μg/100 mL of plasma.
Tumor Counts and Measurements
None of the mice had tumors at baseline. Beginning at week 11, mice were monitored for tumor development. No tumors were observed for naïve (no UV exposure and no chronic stress) mice at any time point during the study. Moreover, in our previous experience, we have not observed skin tumors in mice that have only been chronically stressed in the absence of UVB exposure. Any tumor that was observed in the UVB-exposed nonstressed and chronically stressed mice was defined as a mass having a diameter of at least 1 mm. Tumors were counted and measured weekly. The two longest measurements (mm) in perpendicular directions were made using a Cen-Tech digital caliper (Harbor Freight Tools, Camarillo, CA) and were multiplied to obtain a representation of tumor area (expressed in mm 2 ). Tumor regression was measured as the percent change in tumor number at week 34 relative to week 33. A negative percentage indicates no tumor regression and an increase in tumor number. A positive percentage indicates regression of tumors from the previous week.
Tumor Histology
Tumors were excised, placed in 10% neutral-buffered formalin for 2 hours, washed in phosphate-buffered saline, processed, and embedded in paraffin blocks. Sections (5 μm) were mounted onto Superfrost Plus microscope slides (Fisher Scientific, Pittsburgh, PA) and stained with hematoxylin and eosin, and histopathologic examination was performed on the largest tumor from each mouse (diameter >3 mm). Tumors were classified as papilloma, microinvasive squamous cell carcinoma, or invasive squamous cell carcinoma by a veterinary pathologist (D.K.).
Measurement of Gene Expression
Gene expression of naive mice was measured in normal dorsal skin because these mice had not been exposed to stress or UVB. Gene expression for the UVB-treated groups (nonstressed and chronic stress) was measured in dorsal skin that included thickened areas of epidermis-containing lesions (diameter <2 mm) that represent a transition from focal epidermal hyperplasia to true papilloma and are part of the spectrum of lesions leading ultimately to squamous cell carcinoma ( 19 – 21 ) . Total RNA from frozen dorsal skin was extracted by homogenization in Trizol (Invitrogen, Carlsbad, CA). One sample was analyzed from each mouse in each treatment group. Absorbance measurements at 260 and 280 nm were used to determine the concentration and purity of the RNA. mRNA was then isolated from 20 μg of total RNA from each sample using Dynabeads oligo(dT) 25 (Dynal Biotech, Lake Success, NY). Reverse transcription of the mRNA was carried out at 42 °C for 60 minutes, 90 °C for 5 minutes in a total volume of 25 μL using AMV Reverse Transcriptase Reaction Buffer (Promega, Madison, WI), 1 m M concentrations of each dNTP (Invitrogen), 25 U of RNase Inhibitor (Roche Applied Science, Indianapolis, IN), 0.6 μg of oligo(dT) 12–18 primer (Invitrogen), and 15 U of any reverse transcriptase (Promega).
Sequences from GenBank and the Primer Express 1.5a software (Applied Biosystems, Foster City, CA) were used to design primers and probes. If possible, either the probe or one of the primers was placed over an intron–exon junction to avoid amplification of contaminating genomic DNA. Probes were labeled at the 5′ end with FAM and at the 3′ end with TAMRA (Biosearch Technologies, Novato, CA). Primers were synthesized by Invitrogen. TaqMan Rodent glyceraldehyde-3-phosphate dehydrogenase (GADPH) Control Reagents were obtained from Applied Biosystems. The ABI Prism 7500 Sequence Detection System (Applied Biosystems) was used to quantify gene expression. For each gene measurement, 3 μL of cDNA diluted 1 : 15 were used in a final volume of 25 μL containing TaqMan Universal polymerase chain reaction (PCR) Master Mix (Applied Biosystems), gene-specific primers and probe, and TaqMan Rodent GAPDH Control Reagents. Thermal cycling parameters were 50 °C for 2 minutes (activation of AmpErase uracil-N-glycosylase, 95 °C for 10 minutes (activation of AmpliTaq Gold DNA Polymerase) and 40 cycles of 95 °C for 15 seconds (melt) and 60 °C for 1 minute (anneal/extend). Threshold cycles (C T values) were determined using the 7500 Sequence Detection Software (Applied Biosystems). Real-time PCR results were normalized across samples using GAPDH as an internal standard. ΔC T values were calculated for each sample by subtracting the GAPDH C T value from the cytokine or chemokine C T value. ΔC T values were converted from exponential to linear by using the formula
Immunohistochemistry
Leukocyte subtypes were analyzed in dorsal skin that included thickened areas of epidermis containing lesions (diameter <2 mm) that represent a transition from focal epidermal hyperplasia to true papilloma and are part of the spectrum of lesions leading ultimately to squamous cell carcinoma. Skin samples were embedded in TBS Tissue Freezing Medium (Triangle Biomedical Sciences, Durham, NC), sectioned (10 μm), and mounted on Superfrost Plus microscope slides (Fisher Scientific). Sections were quenched for endogenous peroxidase, blocked in 10% normal goat serum, and incubated with primary antibodies (BD PharMingen, San Diego, CA), rat anti-mouse CD4 (1 : 25), rat anti-mouse CD8 (1 : 50), or biotin rat anti-mouse CD25 (1 : 25), biotin blocked for 40 min (Biotin Blocking System, Dako, Carpinteria, CA), and incubated with mouse-adsorbed biotinylated rabbit anti-rat immunoglobulin (1 : 200) (Vector, Burlingame, CA). 3,3-Diaminobenzidine-tetrahydrochloride (Dako) was used as substrate chromogen and hematoxylin as counterstain. Murine spleen tissue was used as a positive control, and no primary antibody was the negative control. The number of positive cells per standardized field (16 085 μm 2 ) were counted by an observer who was blinded to the treatment groups. Ten fields at ×60 magnification were analyzed per skin section; n = 5 mice per treatment group.
Detection of T Regulatory Cells (CD4 + CD25 + ) in Peripheral Blood
Numbers of regulatory/suppressor T cells (i.e., CD4 + and CD25 + cells) were measured in peripheral blood using flow cytometry (FACSCalibur, Becton Dickinson, San Jose, CA). Directly conjugated rat anti-mouse allophycocyanin-labeled anti-CD4 and phycoerythrin-labeled anti-CD25 (BD PharMingen) antibodies were used to double-label cells. Leukocytes were stained and analyzed as described previously ( 22 ) .
Statistical Analysis
Data are expressed as means and 95% confidence intervals (CIs). Nonparametric Wilcoxon rank sum tests were used for all group comparisons (with nonmodel outcomes) at the primary endpoints (week 34 or week 35). To estimate both the changes in tumor counts as well as in tumor size over time (weeks 11–34), separate linear mixed-effects models were applied. The Kaplan–Meier estimates of the survival function in both treatment groups were calculated, and the log-rank test was used to assess differences between the groups. Fisher's exact test was used to test for differences in tumor stages between the treatment groups. To compare the differences in body weights over time, a repeated-measures analysis of variance was used. P <.05 was considered as statistically significant. All statistical analyses were two-sided and were performed using SAS version 9.1 (SAS Institute, Cary, NC).
R ESULTS
Effects of Chronic Stress on Tumor Emergence, Progression, and Regression
Using the linear mixed-effects model, we found that the estimated weekly increase in the number of tumors was higher in the chronically stressed mice than in the nonstressed mice (0.5 tumor/wk versus 0.2 tumor/wk; difference = 0.3 tumor/wk, 95% CI = 0.03 to 0.49; P = .02) ( Table 1 ). From this model we also estimated that, at week 34, the stressed mice had more tumors on average than the nonstressed mice (84 tumors versus 32 tumors, difference = 52 tumors, 95% CI = 0.9 to 10.3; P = .02). Using a longitudinal model fit to the data, we found that there were no statistically significant differences in tumor size over time between the groups ( Table 1 ). Kaplan–Meier estimates of the survival function indicate that the median time to the first tumor was shorter in the chronically stressed group compared with that in the nonstressed group (15 weeks versus 16.5 weeks, difference = 1.5 weeks, 95% CI = −3.0 to 3.3; P = .03) ( Table 1 ). The stressed group also reached 50% (15 weeks versus 21 weeks) and 100% (31 weeks versus 34 weeks) tumor incidence earlier than the nonstressed group ( Table 1 ). Furthermore, by week 34 the nonstressed group showed 30% tumor regression and no new tumors compared with the previous week ( Table 1 ). In contrast, the stressed group did not show any tumor regression from the previous week, but instead showed a 16% increase in tumor numbers ( P = .02).
Effects of chronic stress on emergence, progression, and regression of squamous cell carcinoma *
| Parameter | No stress | Chronic stress | P |
|---|---|---|---|
| Total tumor number † | 32 | 84 | .02 ‡ |
| Weekly tumor increase § | 0.20 | 0.50 | .02 ‡ |
| Tumor density ∥ | 4.00 (1.84 to 6.16) | 10.5 (6.23 to 14.8) | .09 ¶ |
| Tumor area, mm 2# | 5.03 (4.22 to 5.84) | 7.29 (6.54 to 8.04) | .02 ¶ |
| Median week to first tumor ** | 16.5 | 15 | .03 †† |
| Week of 50% incidence ‡‡ | 21 | 15 | NA |
| Week of 100% incidence §§ | 34 | 31 | NA |
| Tumor regression at week 34, % ∥∥ | 31.9 | −16. 7 | .02 § |
A tumor was defined as a mass having a diameter of at least 1 mm. Tumors were counted and measured weekly from weeks 11 to 34. Two measurements (mm) in perpendicular directions were made using a digital caliper and were multiplied to obtain a representation of tumor area (expressed in mm 2 ). NA, not applicable.
Total number of tumors at week 34.
P value (two-sided) calculated using the linear mixed-effects model.
Estimated by linear mixed-effects model; 95% confidence interval on the difference = 0.03 to 0.49.
Mean number of tumors per animal at week 34.
P value (two-sided) calculated using the Wilcoxon rank sum test.
Mean tumor area at week 34.
Median week to first tumor, estimated by Kaplan–Meier survival analysis; 95% confidence interval on the difference = −3.0 to 3.3.
P value (two-sided) calculated from log-rank test.
Week at which 50% of the animals in each group expressed tumors.
Week at which 100% of the animals in each group expressed tumors.
Percent decrease in tumor number at week 34 relative to week 33. A positive percentage indicates regression of tumors from the previous week. A negative percentage indicates no tumor regression and an increase in tumor number. The chronic stress group did not show regression but instead showed a 16% increase in tumor number.
Chronic stress accelerated tumor emergence, enhanced tumor progression, and suppressed tumor regression. The largest tumor (diameter >3 mm) from each mouse was histologically classified as benign papilloma, microinvasive squamous cell carcinoma, or invasive squamous cell carcinoma (by D.K.). The only invasive squamous cell carcinoma was seen in a chronically stressed mouse. Most tumors were microinvasive squamous cell carcinoma (four of six tumors in nonstressed mice and five of eight in stressed mice) and benign papillomas (two of six in nonstressed mice and two of eight in stressed mice).
Despite the administration of chronic stress, body weights in the two groups were similar across the entire study period ( Fig. 1 ). Moreover, weights of spleen (nonstressed versus chronic stress, mean = 0.287 g versus 0.385 g, difference = 0.098 g), thymus (nonstressed versus chronic stress, mean = 0.036 g versus 0.044 g, difference = 0.008 g), and adrenal gland (nonstressed versus chronic stress, mean = 0.008 g versus 0.011 g, difference = 0.003 g) were also similar between the two groups.
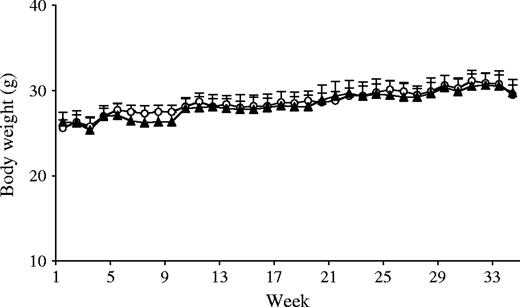
Weekly average body weights. Body weights of UVB-treated nonstressed ( n = 8, open circles ) and chronically stressed ( n = 8, closed triangles ) mice were measured weekly to monitor overall health status. No statistically significant differences in body weight were observed between the two groups across time. Data are expressed as means and upper 95% confidence intervals; P = .86, two-sided, repeated measures analysis of variance.
Effects of Chronic Stress and UV Exposure on the Circadian Corticosterone Rhythm
Circadian cortisol rhythm disruption has been associated with cancer progression. We measured plasma corticosterone to examine whether the chronic stress–induced increase in tumor burden was associated with circadian rhythm dysregulation. Such dysregulation would be indicated by elevated plasma corticosterone at the beginning of the inactive period of the diurnal cycle, a time of day when the lowest corticosterone levels are normally observed. Chronically stressed mice had higher but statistically non-significant corticosterone levels than nonstressed controls (mean = 16.9 μg/100 mL versus 6.45 μg/100 mL, difference = 10.5, 95% CI = −0.65 to 22.5; P = .09).
Effects of Chronic Stress and UV Exposure on Cytokine and Chemokine Gene Expression
Levels of gene expression for interleukin (IL)-12p40, interferon (IFN)-γ, IL-10, IL-4, cutaneous T cell–attracting chemokine [CCL27/CTACK, a chemokine that mediates T-cell homing to skin ( 20 ) ], and CD3ϵ (an index of T cell infiltration) were measured for the naive (no stress and no UVB), nonstressed, and chronically stressed groups ( Table 2 ). For all genes examined, gene expression levels in the skin of naïve mice were lower than those in UVB-treated mice ( Table 2 ). Among the UVB-treated mice, chronically stressed mice had statistically significantly lower gene expression of IFN-γ (mean = 0.03 versus mean = 0.07, difference = 0.04, 95% CI = 0.004 to 0.073; P = .02) and lower IL-12p40 gene expression than nonstressed mice. In contrast, levels of IL-10 and IL-4 gene expression were similar. Chronically stressed mice also had considerably lower expression of CCL27/CTACK (mean = 101 versus mean = 142, difference = 41, 95% CI =8.1 to 74.4; P = .03) and CD3ϵ (mean = 0.18 versus mean = 0.36, difference = 0.18, 95% CI = 0.06 to 0.30; P = .007) gene expression than nonstressed mice.
Effects of chronic stress on cytokine, chemokine, and CD3ϵ gene expression *
| Mean (95% CI) | ||||||
|---|---|---|---|---|---|---|
| Gene | Naive | No stress | Chronic stress | P† | ||
| IL-12p40 | 0.008 (0.003 to 0.013) | 0.11 (0.078 to 0.15) | 0.054 (0.033 to 0.075) † | .06 | ||
| IFN-γ | 0.002 (−0.001 to 0.005) | 0.07 (0.038 to 0.094) | 0.03 (0.013 to 0.041) | .02 | ||
| IL-10 | 0.013 (0.001 to 0.025) | 0.18 (0.11 to 0.25) | 0.13 (0.044 to 0.21) | .10 | ||
| IL-4 | 0.003 (0.000 to 0.006) | 0.073 (0.038 to 0.11) | 0.093 (−0.039 to 0.22) | .28 | ||
| CTACK | 58.9 (36.9 to 81.0) | 142 (123 to 162) | 101 (79.5 to 123) | .03 | ||
| CD3ϵ | 0.16 (0.06 to 0.25) | 0.36 (0.29 to 0.43) | 0.18 (0.10 to 0.26) | .007 | ||
In naive animals ( n = 4, no exposure to UVB or chronic stress), gene expression was measured in normal dorsal skin. Both the no stress ( n = 8) and the chronic stress groups ( n = 8) were exposed to UVB as described under “Materials and Methods.” Gene expression was measured in areas of dorsal skin that included thickened areas of epidermis containing lesions (diameter <2 mm), which represent a transition from focal epidermal hyperplasia to true papilloma and are part of the spectrum of lesions leading ultimately to squamous cell carcinoma. Levels of mRNA expression relative to glyceraldehyde-3-phosphate dehydrogenase are shown. CI = confidence interval.
P values (two-sided) comparing nonstressed mice with chronically stressed mice were calculated using the Wilcoxon rank sum test.
Effects of Chronic Stress on T-Cell Infiltration
Because we observed associations between chronic stress and the expression of genes involved in stimulating protective T-cell responses, we sought to determine whether chronic stress induces a decrease in T cell infiltration and cell-mediated immunity. To do so, we measured and compared T cell numbers in the skin of nonstressed and chronically stressed mice. Photomicrographs of representative sections and graphs of cell numbers are shown in Fig. 2 . Chronically stressed mice had considerably lower skin CD4 + T cell infiltration (mean = 9.40 cells/field versus mean = 13.7 cells/field, difference = 4.3 cells/field, 95% CI = 2.36 to 6.32; P = .008) compared with nonstressed mice. The number of CD8 + cells was also lower in the skin of stressed mice; however, this difference was statistically non-significant. Numbers of circulating CD4 + and CD8 + T cells were similar between nonstressed and chronically stressed mice.
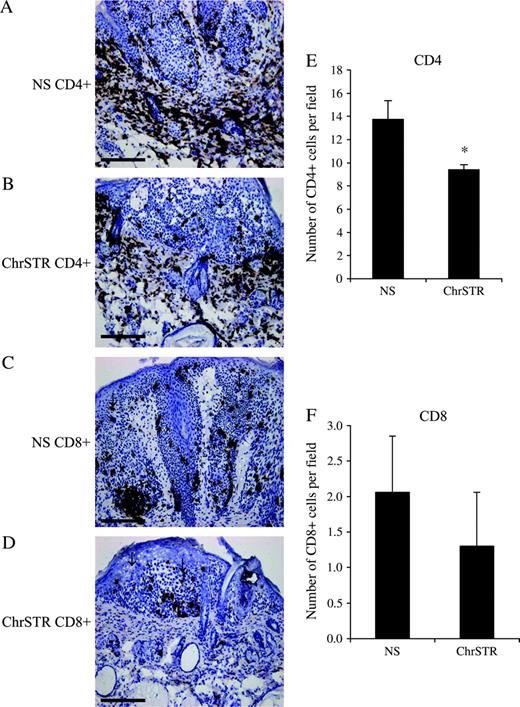
CD4 + and CD8 + T-cell infiltration around tumors. Immunohistochemical staining for CD4 and CD8 was used to assess the extent of T-cell infiltration around tumors from the nonstress (NS) and chronic stress (ChrSTR) groups as mentioned under “Materials and Methods.” Representative photomicrographs at ×10 magnification from each group are shown for A ) CD4 + NS, B ) CD4 + ChrSTR, C ) CD8 + NS, and D ) CD8 + ChrSTR groups. Scale bar = 200 μm. Cell counts for E ) CD4 + cells and F ) CD8 + cells from each treatment group are shown. Arrows point to areas of papilloma formation. Data are expressed as means and upper 95% confidence intervals; * P = .008, two-sided Wilcoxon rank sum test.
Effects of Chronic Stress on Regulatory/Suppressor Cells in Tumors and in Circulation
Recent clinical studies have shown that regulatory/suppressor T cells are involved in inhibiting antitumor responses and suppressing effector cell function within tumors and are associated with increased mortality ( 23 , 24 ) . Therefore, we investigated the hypothesis that chronic stress will increase susceptibility to squamous cell carcinoma by promoting or enhancing the function of immune “suppressor” mechanisms. To do so, we examined the effects of chronic stress on numbers of regulatory/suppressor cells within tumors and in peripheral blood. Photomicrographs of representative sections and cell numbers are shown in Fig. 3 . Chronically stressed mice showed greater CD25 + cell infiltration into tumors than nonstressed mice ( Fig. 3, C ), but the difference was not statistically significant. In addition, stressed mice also had considerably higher numbers of CD4 + CD25 + T cells in the peripheral blood (mean = 0.36 versus mean = 0.17, difference = 0.19, 95% CI = 0.005 to 0.38; P = .03) ( Fig. 3, D ).
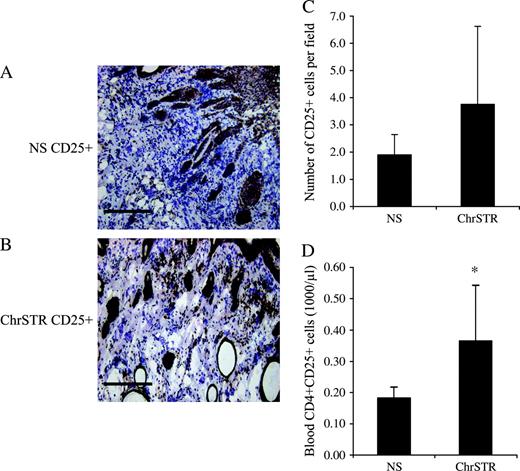
Distribution of CD25 + cells in tumors and CD4 + CD25 + regulatory/suppressor cells in peripheral blood. Immunohistochemical staining was used to assess the extent of CD25 + leukocyte infiltration within tumors from the nonstress (NS) and chronic stress (ChrSTR) groups as mentioned under “Materials and Methods.” A , B ) Representative photomicrographs at ×10 magnification from each group. Scale bar = 200 μm. C, D ) CD4 + CD25 + cell counts from each treatment group in skin tumors and in blood. Flow cytometry was used to count CD4 + CD25 + T regulatory cells in the peripheral blood of the NS and ChrSTR groups as mentioned under “Materials and Methods.” Data are expressed as means and upper 95% confidence intervals; * P = .03, two-sided Wilcoxon rank sum test.
D ISCUSSION
In this study, we demonstrated that chronic stress profoundly accelerates the emergence and development of squamous cell carcinomas and their precursors while suppressing tumor regression in a mouse model. To our knowledge, this is the first study to elucidate the cellular and molecular mechanisms mediating a chronic stress–induced increase in susceptibility to skin cancer. Chronic stress administered during the middle 3 weeks of mild, nonblistering UVB exposure caused more mice to develop tumors and to develop them faster than nonstressed mice ( Table 1 ). These chronically stressed mice had an earlier onset of the first tumor and also reached 50% and 100% incidence earlier than the nonstressed mice ( Table 1 ). Although median time to first tumor and time of 50% incidence were the same for the chronically stressed group, the 4.5-week gap between median time to first tumor and time of 50% incidence in the nonstressed mice indicates greater spontaneous regression of tumors during this period in the nonstressed group. In addition, chronically stressed mice showed no tumor regression at week 34 whereas nonstressed mice did ( Table 1 ).
Our results suggest that suppressed immune function and increased tumor promotion during chronic stress exposure have long-lasting effects. Support for this finding also comes from studies showing that chronic stress suppresses skin cell-mediated immunity ( 3 ) and that cell-mediated immunity is critical for elimination of squamous cell carcinomas because these tumors are known to be immunogenic tumors ( 8 , 9 ) . Stress has also been shown to suppress natural killer cell activity and enhance experimental tumor metastasis after intravenous injection of a tumor cell line ( 25 , 26 ) . Parker et al. ( 27 ) have used an extended model of chronic stress that was initiated 2 weeks before and administered during a more prolonged period of UV exposure to show accelerated formation of cutaneous neoplasms. It is important to appreciate that, in the current study, chronic stress was administered for only 3 weeks during the period of UV-induced tumor promotion and yet had effects on critical molecular and cellular mediators of antitumor immunity that were observed 8 months later. This result suggests that a relatively moderate chronic stressor can be a potent immunosuppressor during critical periods of immune response development and can set the stage for suppression of antitumor immunity long after stress has ended.
Stressed mice had higher basal corticosterone levels nearly 28 weeks after the cessation of stress. A salubrious corticosterone rhythm is one that shows low levels of plasma corticosterone at the beginning of the inactive period of the diurnal cycle (morning for nocturnal rodents) and higher levels at the beginning of the active period (evening) ( 28 ) . The higher morning corticosterone levels observed in the stressed group indicate dysregulation of the circadian rhythm. Circadian rhythm dysregulation may negatively affect immune function and health ( 29 ) and has been associated with increased cancer progression ( 30 – 32 ) and mortality ( 33 ) . In addition, a dysregulated cortisol rhythm may induce immune dysregulation ( 28 , 34 ) and accelerate tumor growth because the host circadian clock is an important control point in tumor progression ( 31 , 32 ) . Future studies using additional sampling time points will be required to elucidate the kinetics and magnitude of circadian rhythm dysregulation during skin cancer and to determine whether the dysregulated rhythm was a cause or effect of increased tumor burden.
We used real-time PCR to quantify differences in gene expression between naïve, nonstressed, and chronically stressed animals. IL-12p40 and IFN-γ gene expression was suppressed in chronically stressed animals. IL-12 has been shown to promote Th1 responses that drive cell-mediated immunity ( 35 ) . IL-12 therapy has been shown to slow the growth of murine mammary tumors by preventing neovascularization and by increasing the number of infiltrating leukocytes ( 36 ) and intratumoral administration of IL-12 has been shown to elicit a Th1 response profile in sentinel lymph nodes ( 37 ) . Although measurement of IL-12p40 gene expression may not be entirely indicative of the biologically active IL-12p70 heterodimer, IL-12p40 does appear to be an important representation of IL-12 activity in vivo ( 38 , 39 ) . It has also been shown that the p19 subunit of IL-23 forms a heterodimer with the p40 subunit of IL-12 to form IL-23 ( 40 ) . Therefore, it is possible that the level of IL-12p40 gene expression may indicate IL-23 activity. Although further analyses of cytokine proteins are required to determine the exact cytokine involved, both IL-12 and IL-23 are important mediators of cellular immunity ( 41 ) , and IL-23 also promotes antitumor immunity ( 42 ) . IFN-γ promotes tumor recognition and elimination ( 43 ) , is a critical mediator of the antitumor effects of IL-12 ( 44 ) , and enables immune system suppression of tumors ( 45 ) . Therefore, stress-induced decreases in IL-12 and IFN-γ gene expression suggest suppression of critical protective immune mechanisms. In contrast, IL-4 and IL-10 gene expression was not different between groups. Based on these studies, it appears that stress-induced immunosuppression of anti–squamous cell carcinoma responses may be mediated by suppression of type 1 versus type 2 cytokines that would in turn suppress antitumor immunity.
CCL27/CTACK and CD3ϵ gene expression was also suppressed in chronically stressed animals. CTACK is predominantly expressed in the skin and is critical for attracting skin-homing T cells ( 46 ) . CD3ϵ gene expression can be considered an index of T-cell infiltration. Importantly, T cells have been implicated in both the regression ( 47 ) and rejection ( 48 ) of UV-induced squamous cell carcinoma. Therefore, down-regulation of CTACK gene expression may contribute to suppression of T cell infiltration and T cell–driven antitumor immune responses. With the exception of the effects of stress on CD3ϵ gene expression (which are confirmed by the observed effects on T cell infiltration), we did not examine changes in protein expression for the genes measured in this study. Further studies are required to confirm that the observed effects on gene expression translate to the level of protein expression.
Our observation that chronic stress decreased the numbers of infiltrating CD4 and CD8 T cells around tumors further supports the hypothesis that increased susceptibility to squamous cell carcinoma may be mediated by stress-induced suppression of protective T cell–mediated immunity. Both helper and cytolytic T cell responses are likely to be important in controlling tumor growth, and T cells have been shown to mediate regression of nonmelanoma skin cancers ( 47 – 49 ) . CD4 + T cells have also been found to be crucial for controlling tumor growth by cytolytic T lymphocyte–independent mechanisms ( 50 ) . Interestingly, IFN-γ, shown here to be suppressed by chronic stress, appears to be involved in CD4 + T cell–mediated elimination of tumors ( 51 ) .
Regulatory/suppressor T cells are a subset of cells expressing both CD25 (the IL-2 receptor α chain) and CD4 ( 52 ) . High levels of these cells have been detected in human cancers ( 23 , 24 ) . CD25 + T cells impair effector cell function by suppressing IFN-γ secretion ( 53 ) and may suppress antitumor immune responses ( 23 ) . Given these findings, it is likely that the CD25 + cell populations that we detected in skin tumors were of the T regulatory/suppressor subset although further studies using dual staining are required to specifically identify this leukocyte subset. Chronic stress increased the numbers of CD25 + cells within tumors ( Fig. 3 ) while decreasing the numbers of CD4 + and CD8 + cells around tumors ( Fig. 2 ). It is possible that the increased number of CD25 + cells within tumors of chronically stressed animals suppressed the recruitment of protective T cells and prevented them from mounting effective antitumor immune responses. The increased numbers of CD4 + CD25 + cells in peripheral blood ( Fig. 3, D ) show that chronic stress also increased regulatory/suppressor cell numbers in the circulation. Taken together, these results suggest that regulatory/suppressor T cells play an important role in chronic stress–induced immunosuppression and increased susceptibility to squamous cell carcinoma.
The model used in this study has several potential limitations. The multifactorial nature of cancer progression and the involvement of different physiologic systems (nervous, endocrine, and immune) described here highlight the importance of conducting follow-up studies to further elucidate the molecular, cellular, and physiologic mechanisms by which chronic stress increases susceptibility to skin cancer. Additional studies quantifying changes in protein levels need to be conducted to confirm the gene expression effects presented in the current study. The extent of the relative contribution of the individual cell types identified here to the tumor development process must be determined by selective depletion or via specific inactivation. Moreover, additional hormone analysis time points at different stages of tumor development are required to elucidate the kinetics and magnitude of circadian rhythm dysregulation and to determine whether the dysregulated rhythm is a cause or effect of increased tumor burden. Finally, future human studies elucidating mechanisms mediating the link between stress and skin tumor development are required to confirm and translate these findings from bench to bedside.
Our data suggest that chronic stress increases susceptibility to skin cancer and shifts the balance from protective to suppressive immune responses. Chronic stress suppresses type 1 cytokines and CCL27/CTACK gene expression and suppresses CD4 + and CD8 + T cell infiltration at sites of tumor emergence and progression while increasing the numbers of regulatory/suppressor cells at tumor sites and in circulation. These results are, to our knowledge, the first to show that chronic stressors increase susceptibility to disease by mobilizing endogenous immunosuppressive mechanisms such as regulatory/suppressor T cells. Our results show that a moderate chronic stressor, one that does not have overall health-aversive effects (no change in body and organ weights), can substantially increase susceptibility to skin cancer. Moreover, the detrimental effects of stress on critical clinical, cellular, and molecular parameters are observed months after the cessation of stress.
Stress pervades almost all aspects of life and is especially salient during diagnosis, treatment, and follow-up for cancer and other diseases. Therefore, these findings may be relevant for conditions in which chronic stress may increase susceptibility to other cancers, decrease effectiveness of tumor immunotherapy, or contribute to systemic immunosuppression during cancer treatment. It is hoped that knowledge gained from transdisciplinary studies such as these that examine cancer in a holistic context will increase the accuracy and timeliness of risk evaluation, improve preventative and therapeutic interventions, and help optimize a patient's response to treatment.
Supported in part by grants from the National Institutes of Health (CA107498 and AI 48995) (to F. S. Dhabhar) and the Dana Foundation (to F. S. Dhabhar). The funding agencies did not play a role in study design, data collection, or data analysis.
We thank Carrie Symmonds, Jean Tillie, Cynthia Walter, Susan Moseley, and Dr. Kavitha Viswanathan for assistance with these studies.
References
World Health Organization. Ultraviolet radiation. Available at: www.who.int/uv/en . [Last accessed: August 1,
Ader R, Felten DL, Cohen N, editors. Psychoneuroimmunology. 3rd ed. San Diego (CA): Academic Press;
Dhabhar FS, McEwen BS. Acute stress enhances while chronic stress suppresses immune function in vivo: a potential role for leukocyte trafficking.
Dhabhar FS, McEwen BS. Bidirectional effects of stress and glucocorticoid hormones on immune function: possible explanations for paradoxical observations. In Ader R, Felten DL, Cohen N, editors. Psychoneuroimmunology. 3rd ed. San Diego (CA): Academic Press;
Armstrong BK, Kricker A. The epidemiology of UV induced skin cancer.
Berton TR, Pavone A, Fischer SM. Ultraviolet-B irradiation alters the cell cycle machinery in murine epidermis in vivo.
Morison WL, Parrish JA, Bloch KJ, Krugler JI. In-vivo effect of UV-B on lymphocyte function.
Kripke ML. Ultraviolet radiation and immunology: something new under the sun—presidential address.
Granstein RD, Matsui MS. UV radiation-induced immunosuppression and skin cancer.
Ortonne JP. From actinic keratosis to squamous cell carcinoma.
van Kranen HJ, de Gruijl FR. Mutations in cancer genes of UV-induced skin tumors of hairless mice.
de Gruijl FR, Forbes PD. UV-induced skin cancer in a hairless mouse model.
Berkenbosch F, Wolvers DA, Derijk R. Neuroendocrine and immunological mechanisms in stress-induced immunomodulation.
Glavin GB, Pare WP, Sandbak T, Bakke HK, Murison R. Restraint stress in biomedical research: an update.
Kvetnansky R, Fukuhara K, Pacak K, Cizza G, Goldstein DS, Kopin IJ. Endogenous glucocorticoids restrain catecholamine synthesis and release at rest and during immobilization stress in rats.
Dhabhar FS, Miller AH, McEwen BS, Spencer RI. Differential activation of adrenal steroid receptors in neural and immune tissues of Sprague Dawley, Fischer 344, and Lewis rats.
Plotsky PM, Meaney MJ. Early, postnatal experience alters hypothalamic corticotropin-releasing factor (CRF) mRNA, median eminence CRF content and stress-induced release in adult rats.
Kligman LH, Kligman AM. Histogenesis and progression in ultraviolet light-induced tumors in hairless mice.
Canfield PJ, Xu FN, Greenoak GE, Reeve VE, Gallagher CH, Wilkinson F. Ultrastructure of ultraviolet radiation-induced hairless mouse skin carcinogenesis, with special reference to the epidermal-dermal junction.
D'Agostini F, Fiallo P, DiMarco C, DeFlora S. Detection of p53 and histopathological classification of skin tumours induced by halogen lamps in hairless mice.
Dhabhar FS, Satoskar AR, Bluethmann H, David JR, McEwen BS. Stress-induced enhancement of skin immune function: a role for gamma interferon.
Curiel TJ, Coukos G, Zou L, Alvarez X, Cheng P, Mottram P, et al. Specific recruitment of regulatory T cells in ovarian carcinoma fosters immune privilege and predicts reduced survival.
Woo EY, Chu CS, Goletz TJ, Schlienger K, Yeh H, Coukos G, et al. Regulatory CD4 + CD25 + T cells in tumors from patients with early-stage non-small cell lung cancer and late-stage ovarian cancer.
Ben-Eliyahu S, Yirmiya R, Liebeskind JC, Taylor AN, Gale RP. Stress increases metastatic spread of a mammary tumor in rats: evidence for mediation by the immune system.
Ben-Eliyahu S. The promotion of tumor metastasis by surgery and stress: immunological basis and implications for psychoneuroimmunology.
Parker J, Klein SL, McClintock MK, Morison WJ, Ye X, Conti CJ, et al. Chronic stress accelerates ultraviolet-induced cutaneous carcinogenesis.
Dhabhar FS, Miller AH, Stein M, McEwen BS, Spencer RL. Diurnal and stress-induced changes in distribution of peripheral blood leukocyte subpopulations.
Sephton SE, Dhabhar FS, Classen C, Spiegel D. The diurnal cortisol slope as a predictor of immune reactivity to interpersonal stress [abstract].
Mormont MC, Levi F. Circadian-system alterations during cancer processes; a review.
Filipski E, King VM, Li X, Granda TG, Mormont MC, Liu X, et al. Host circadian clock as a control point in tumor progression.
Fu L, Lee CC. The circadian clock: pacemaker and tumor suppressor.
Sephton SE, Sapolsky RM, Kraemer HC, Spiegel D. Early mortality in metastatic breast cancer patients with absent or abnormal diurnal cortisol rhythms.
Gatti G, Masera RG, Pallavicini L, Sartori ML, Staurenghi A, Orlandi F, et al. Interplay in vitro between ACTH, beta-endorphin, and glucocorticoids in the modulation of spontaneous and lymphokine-inducible human natural killer (NK) cell activity.
Manetti R, Parronchi P, Giudizi MG, Piccini MP, Maggi E, Trinchieri G, et al. Natural killer cell stimulatory factor (interleukin 12 [IL-12]) induces T-helper type 1 (Th1)-specific immune responses and inhibits the development of IL-4-producing Th cells.
Shi X, Liu J, Xiang Z, Mitsuhashi M, Wu RS, Ma X. Gene expression analysis in interleukin-12-induced suppression of mouse mammary carcinoma.
van Herpen CM, Looman M, Zonneveld M, Scharenborg N, de Wilde PC, van de Locht L, et al. Intratumoral administration of recombinant human interleukin-12 in head and neck squamous cell carcinoma patients elicits a T-helper 1 profile in the locoregional lymph nodes.
Kopp T, Kieffer JD, Rot A, Strommer S, Stingl G, Kupper TS. Inflammatory skin disease in K14/p40 transgenic mice: evidence for interleukin-12-like activities of p40.
Cooper AM, Kipnis A, Turner J, Magram J, Ferrante J, Orme IM. Mice lacking bioactive IL-12 can generate protective, antigen-specific cellular responses to mycobacterial infection only if the IL-12p40 subunit is present.
Oppmann B, Lesley R, Blom B, Timans JC, Xu Y, Hunte B, et al. Novel p19 protein engages IL-12p40 to form a cytokine, IL-23, with biological activities similar as well as distinct from IL-12.
Lankford CSR, Frucht DM. A unique role for IL-23 in promoting cellular immunity.
Lo C-H, Lee S-C, Wu P-Y, Pan W-Y, Su J, Cheng C-W, et al. Anti-tumor and anti-metastatic activity of IL-23.
Dighe AS, Richards E, Old LJ, Schreiber RD. Enhanced in vivo growth and resistance to rejection of tumor cells expressing dominant negative IFN gamma receptors.
Voest EE, Kenyon BM, O'Reilly MS, Truitt G, D'Amato RJ, Folkman J. Inhibition of angiogenesis in vivo by interleukin 12.
Shankaran V, Ikeda H, Bruce AT, White JM, Swanson PE, Old LJ, et al. IFNγ and lymphocytes prevent primary tumour development and shape tumour immunogenicity.
Reiss Y, Proudfoot AE, Power CA, Campbell JJ, Butcher EC. CC chemokine receptor (CCR)4 and the CCR10 ligand cutaneous T cell-attracting chemokine (CTACK) in lymphocyte trafficking to inflamed skin.
Patel AG, Halliday GM, Barnetson RS. CD4 + T lymphocyte infiltration correlates with regression of a UV-induced squamous cell carcinoma.
Romerdahl CA, Kripke ML. Role of helper T-lymphocytes in rejection of UV-induced murine skin cancers.
Halliday GM, Patel A, Hunt MJ, Tefany FJ, Barnetson RS. Spontaneous regression of human melanoma/nonmelanoma skin cancer: association with infiltrating CD4 + T cells.
Greenberg PD. Adoptive T cell therapy of tumors: mechanisms operative in the recognition and elimination of tumor cells.
Toes REM, Ossendorp F, Offringa R, Melief CJM. CD4 T cells and their role in anti-tumor immune responses.

