


Abstract
Background: Current evidence suggests that high red meat intake is associated with increased colorectal cancer risk. High fish intake may be associated with a decreased risk, but the existing evidence is less convincing. Methods: We prospectively followed 478 040 men and women from 10 European countries who were free of cancer at enrollment between 1992 and 1998. Information on diet and lifestyle was collected at baseline. After a mean follow-up of 4.8 years, 1329 incident colorectal cancers were documented. We examined the relationship between intakes of red and processed meat, poultry, and fish and colorectal cancer risk using a proportional hazards model adjusted for age, sex, energy (nonfat and fat sources), height, weight, work-related physical activity, smoking status, dietary fiber and folate, and alcohol consumption, stratified by center. A calibration substudy based on 36 994 subjects was used to correct hazard ratios (HRs) and 95% confidence intervals (CIs) for diet measurement errors. All statistical tests were two-sided. Results: Colorectal cancer risk was positively associated with intake of red and processed meat (highest [>160 g/day] versus lowest [<20 g/day] intake, HR = 1.35, 95% CI = 0.96 to 1.88; Ptrend = .03) and inversely associated with intake of fish (>80 g/day versus <10 g/day, HR = 0.69, 95 % CI = 0.54 to 0.88; Ptrend <.001), but was not related to poultry intake. Correcting for measurement error strengthened the associations between colorectal cancer and red and processed meat intake (per 100-g increase HR = 1.25, 95% CI =1.09 to 1.41, Ptrend = .001 and HR = 1.55, 95% CI = 1.19 to 2.02, Ptrend = .001 before and after calibration, respectively) and for fish (per 100 g increase HR = 0.70, 95% CI = 0.57 to 0.87, Ptrend <.001 and HR = 0.46, 95% CI = 0.27 to 0.77, Ptrend = .003; before and after correction, respectively). In this study population, the absolute risk of development of colorectal cancer within 10 years for a study subject aged 50 years was 1.71% for the highest category of red and processed meat intake and 1.28% for the lowest category of intake and was 1.86% for subjects in the lowest category of fish intake and 1.28% for subjects in the highest category of fish intake. Conclusions: Our data confirm that colorectal cancer risk is positively associated with high consumption of red and processed meat and support an inverse association with fish intake.
The finding that a high intake of red meat but not of chicken or fish might be associated with increased colon cancer risk was first reported in prospective studies by Willett et al. in 1990 ( 1 ) , from an analysis of 150 colorectal cancer patients in the Nurses' Health Study. Later, results from a systematic review of observational and experimental studies ( 2 ) and two meta-analyses ( 3 , 4 ) also supported the initial finding. However, the association between colon cancer and red meat consumption was slightly weaker in a longer follow-up of the Nurses' Health Study ( 5 ) than in the previous analysis ( 1 ) and, in the combined analysis with the Health Professionals Follow-up Study, a statistically significant trend with processed meat but not with beef, pork, or lamb as a main dish was observed ( 5 ) . Results from another prospective study of American women showed no evidence of an association between meat and colorectal cancer ( 6 ) . More recently, results of the Cancer Prevention Study II Nutrition Cohort ( 7 ) showed that prolonged high consumption of red and processed meat might be associated with an increased risk of cancer of the distal portion of the large intestine; however, the increase was not statistically significant.
The evidence of an inverse association between colon cancer risk and fish intake is less consistent than the evidence of a positive association with red meat ( 2 ) . An inverse association has been observed in several prospective studies ( 1 , 8 – 16 ) , but the association was statistically significant in only two of them ( 12 , 16 ) . Fish intake was not associated with colorectal cancer risk in the most recently published prospective studies ( 17 – 19 ) .
No association with intake of poultry and colon cancer has been observed in almost all of the cohort studies ( 8 – 10 , 12 – 16 ) that have examined this relationship. One study reported a statistically significant inverse trend ( 1 ) .
To examine whether associations exist between intakes of red and processed meat, of poultry, and of fish and colorectal cancer risk, we prospectively followed a large Western European population that includes half a million subjects from 10 European countries: the European Prospective Investigation into Cancer and Nutrition (EPIC) ( 20 ) . People who eat diets rich in meat also tend to eat less fiber and less fish ( 21 ) , and a statistically significant inverse association between dietary fiber consumption and colorectal cancer risk in this cohort has been reported elsewhere ( 22 ) . We therefore also investigated the risk of colorectal cancer associated with intakes of red and processed meat in individuals with different levels of intake of fish and fiber.
S UBJECTS AND M ETHODS
Study Cohort
EPIC is a prospective study that was designed to investigate the relationships among diet, lifestyle, genetic and environmental factors, and the incidence of different forms of cancer. The study has been described in detail previously ( 20 , 23 ) . EPIC includes 366 521 women and 153 457 men, most aged 35–70 years at enrollment between 1992 and 1998, who were recruited in 23 centers in 10 European countries ( Table 1 ). The study subjects were recruited from the general population and resided in defined areas in each country with some exceptions (women who were members of a health insurance scheme for state school employees in France and women attending breast cancer screening in Utrecht, The Netherlands; components of the Italian and Spanish cohorts included members of local blood donor associations). A large number of subjects who did not eat meat were enrolled in the Oxford “Health conscious” cohort. Eligible participants gave written informed consent and completed questionnaires on their diet, lifestyle, and medical history. Approval for this study was obtained from the ethical review boards of the International Agency for Research on Cancer and from all local institutions where subjects had been recruited for the EPIC study.
Description of the centers participating in the European Prospective Investigation into Cancer and Nutrition (EPIC) Study *
| No. of colorectal cancer patients | Mean (standard error) of daily intake (g/day) | ||||||||||||||||
|---|---|---|---|---|---|---|---|---|---|---|---|---|---|---|---|---|---|
| Person–years | Red and processed meat | Fish | Poultry | ||||||||||||||
| Center, country | Enrollment age, y | Men | Women | Men | Women | Men | Women | Men | Women | Men | Women | ||||||
| Aarhus, Denmark | 50–65 | 27 | 29 | 25 807 | 26 720 | 119.2 (0.3) | 68.9 (0.2) | 43.9 (0.02) | 31.3 (0.1) | 14.5 (0.05) | 17.8 (0.1) | ||||||
| Copenhagen, Denmark | 50–65 | 67 | 54 | 60 476 | 68 822 | 124.9 (0.2) | 68.6 (0.1) | 45.2 (0.1) | 37.5 (0.1) | 18.5 (0.04) | 15.3 (0.05) | ||||||
| France | 43–68 | — | 174 | — | 436 848 | — | 76.0 (0.1) | — | 39.2 (0.04) | — | 24.2 (0.1) | ||||||
| Heidelberg, Germany | 40–65 | 33 | 15 | 42 033 | 45 772 | 143.2 (0.4) | 75.2 (0.2) | 17.0 (0.1) | 14.0 (0.1) | 19.4 (0.8) | 15.8 (0.04) | ||||||
| Potsdam, Germany | 35–65 | 39 | 27 | 49 560 | 71 605 | 140.9 (0.4) | 73.5 (0.2) | 23.6 (0.1) | 19.3 (0.1) | 16.7 (0.8) | 11.9 (0.03) | ||||||
| Greece | 30–76 | 13 | 11 | 37 985 | 54 628 | 64.0 (0.2) | 34.6 (0.1) | 52.1 (0.2) | 31.2 (0.1) | 15.3 (0.4) | 12.4 (0.03) | ||||||
| Florence, Italy | 35–65 | 17 | 30 | 16 598 | 49 991 | 102.4 (0.5) | 64.1 (0.2) | 33.2 (0.2) | 21.0 (0.1) | 41.0 (0.2) | 24.5 (0.05) | ||||||
| Turin, Italy | 35–65 | 18 | 4 | 18 739 | 12 430 | 96.3 (0.3) | 60.6 (0.3) | 32.0 (0.2) | 20.3 (0.1) | 40.4 (0.1) | 24.0 (0.1) | ||||||
| Varese, Italy | 35–72 | 6 | 20 | 7586 | 42 682 | 99.5 (0.5) | 64.4 (0.2) | 31.0 (0.3) | 19.4 (0.1) | 39.1 (0.2) | 23.4 (0.05) | ||||||
| Naples, Italy | 35–68 | — | 3 | — | 18 332 | — | 59.8 (0.2) | — | 26.5 (0.1) | — | 24.0 (0.1) | ||||||
| Ragusa, Italy | 35–65 | 2 | 1 | 10 268 | 10 050 | 89.2 (0.4) | 56.8 (0.3) | 27.4 (0.2) | 17.6 (0.1) | 39.5 (0.2) | 24.0 (0.1) | ||||||
| Bilthoven, Netherlands | 21–64 | 13 | 9 | 35 278 | 41 618 | 141.2 (0.5) | 81.2 (0.3) | 17.0 (0.1) | 11.6 (0.1) | 19.0 (0.1) | 13.6 (0.1) | ||||||
| Utrecht, Netherlands | 49–70 | — | 75 | — | 84 003 | — | 78.8 (0.2) | — | 14.0 (0.05) | — | 13.2 (0.05) | ||||||
| Norway | 41–56 | — | 20 | — | 57 409 | — | 77.8 (0.1) | — | 48.6 (0.1) | — | 12.8 (0.03) | ||||||
| Granada, Spain | 35–65 | 7 | 9 | 9 838 | 30 165 | 127.8 (0.8) | 65.7 (0.2) | 96.6 (0.7) | 60.0 (0.2) | 33.1 (0.2) | 25.0 (0.1) | ||||||
| Murcia, Spain | 35–65 | 7 | 10 | 14 117 | 29 926 | 134.3 (0.7) | 72.0 (0.3) | 90.3 (0.1) | 59.5 (0.2) | 36.3 (0.2) | 28.5 (0.1) | ||||||
| Asturias, Spain | 35–65 | 11 | 11 | 19 679 | 34 291 | 134.9 (0.5) | 71.3 (0.2) | 96.1 (0.5) | 62.8 (0.2) | 37.7 (0.2) | 27.8 (0.1) | ||||||
| Navarra, Spain | 35–64 | 14 | 10 | 25 195 | 26 081 | 147.3 (0.5) | 79.5 (0.3) | 91.4 (0.5) | 59.4 (0.2) | 38.5 (0.2) | 28.0 (0.1) | ||||||
| San Sebastian, Spain | 35–65 | 20 | 11 | 22 676 | 23 782 | 141.3 (0.5) | 71.1 (0.3) | 99.9 (0.5) | 64.7 (0.2) | 40.0 (0.2) | 28.6 (0.1) | ||||||
| Malmo, Sweden | 45–73 | 94 | 100 | 78 719 | 105 514 | 123.1 (0.2) | 78.5 (0.1) | 42.0 (0.1) | 33.1 (0.05) | 11.5 (0.04) | 11.2 (0.02) | ||||||
| Umea, Sweden | 30–60 | 44 | 34 | 90 463 | 92 742 | 121.7 (0.2) | 77.5 (0.1) | 33.5 (0.1) | 25.6 (0.03) | 7.7 (0.03) | 8.1 (0.02) | ||||||
| Norfolk, U.K. | 41–76 | 82 | 68 | 51 031 | 61 102 | 78.8 (0.3) | 46.2 (0.1) | 31.7 (0.1) | 28.7 (0.03) | 26.4 (0.2) | 22.2 (0.1) | ||||||
| Oxford, U.K. | 21–83 | 8 | 14 | 5 041 | 16 705 | 79.9 (0.6) | 49.4 (0.2) | 33.0 (0.1) | 28.2 (0.05) | 28.6 (0.4) | 23.2 (0.2) | ||||||
| Oxford, Health Conscious, U.K. | 21–83 | 20 | 48 | 50 317 | 166 460 | 24.4 (0.2) | 14.0 (0.1) | 13.6 (0.2) | 12.9 (0.02) | 10.7 (0.2) | 9.6 (0.05) | ||||||
Enrollment ages are the 1st–99th percentile. Calibrated mean daily intakes of red meat, fish, and poultry are shown. Center- and sex-specific calibration models were obtained by regression of the main dietary questionnaires on the 24-hour diet recall values. Models included energy from nonfat sources, energy from fat sources, weight, height, age at recruitment, day of the week, and season of the year on which the 24-hour diet recall was collected.
For this analysis, we excluded 22 432 cohort members with prevalent cancer at enrollment other than nonmelanoma skin cancer, 10 208 members who were in the lowest and highest 1% of the distribution of the ratio of reported total energy intake to energy requirement ( 24 ) , and 9298 members with missing questionnaire data or missing dates of diagnosis or follow-up. The number of subjects included in this analysis was 478 040.
Diet and Lifestyle Questionnaires
Diet over the 12 months before enrollment was measured between 1992 and 1998 by country-specific validated questionnaires. Most centers adopted a self-administered dietary questionnaire of 88 to 266 food items. In Greece, all centers in Spain, and Ragusa, Italy, the questionnaire was administered at a personal interview. In Malmö, Sweden, a questionnaire method combined with a food record was used. Data on height and weight, alcohol use, smoking status, occupational physical activity, and previous illnesses were also collected. Descriptions of the questionnaires used can be found on websites of the participating cohorts ( 20 ) . The validity of methods used was established in prior studies using 24-hour urine and blood samples as sources of biomarkers ( 25 ) .
For this analysis, meats were grouped into red meat, processed meat, and poultry. Red meat included all fresh, minced, and frozen beef, veal, pork, and lamb. Processed meats were mostly pork and beef that were preserved by methods other than freezing, such as salting (with and without nitrites), smoking, marinating, air drying, or heating (i.e., ham, bacon, sausages, blood sausages, meat cuts, “liver paté,” salami, bologna, tinned meat, luncheon meat, corned beef, and others). Lamb and poultry are rarely processed into these types of meats in Europe. Poultry included all fresh, frozen, and minced chicken, and, in some cohorts, turkey. Fish included fresh, canned, salted, and smoked fish.
Identification of Colorectal Cancer Case Patients
The follow-up was based on population cancer registries, except in France, Germany, and Greece, where a combination of methods, including health insurance records, cancer and pathology registries, and active follow-up of study subjects and their next-of-kin was used. Mortality data were collected from either the cancer or mortality registries at the regional or national level.
Follow-up began at the date of enrollment and ended at either the date of diagnosis of colorectal cancer, death, or last complete follow-up. By October 30, 2002, for the centers using record linkage with cancer registry data, complete follow-up was available until December 31, 1998 (Bilthoven, Naples, Ragusa, and Turin), June 30, 1999 (Aarhus and Copenhagen), December 31, 1999 (Murcia and Varese), December 31, 2000 (Asturias, Granada, Navarra, San Sebastian, Florence, Norfolk, Oxford, Utrecht, and Norway), June 30, 2001 (Umea), December 31, 2001 (Malmö), and for the centers using active follow-up, the last contact dates were July 30, 2002 (France) July 15, 2002 (Greece), September 4, 2002 (Heidelberg), and September 20, 2002 (Postdam). Mortality data were coded using the 10th revision of the International Classification of Diseases, Injuries and Causes of Death, and cancer incidence following the International Classification of Diseases for Oncology, 2nd version. We included all incident cases of colon (C18) and rectal cancer. Cancer of the rectum included tumors occurring at the rectosigmoid junction (C19) and at the rectum (C20). Anal canal tumors were excluded. Right colon tumors included tumors of the caecum, appendix, ascending colon, hepatic flexure, transverse colon, and splenic flexure (codes C18.0–18.5 of the International Statistical Classification of Diseases for Oncology, version 2). Left colon tumors included those in the descending and sigmoid colon (C18.6–18.7).
Statistical Methods
Analyses were conducted using Cox regression. We tested the proportional hazard assumption for red meat, fish, and poultry intake variables in relation to colorectal cancer using the likelihood ratio test, comparing models with and without product terms for the meat and fish variables and follow-up time (years). Data were stratified by center to control for differences in questionnaire design, follow-up procedures, and other center effects. The five Italian centers were combined for analysis, as were the five Spanish centers. The Norfolk and Oxford general U.K. populations were combined. Age was used as the primary time variable, and sex was included as a covariate. The analysis focused on food groups of meats and fish available in all EPIC cohorts: red meat, processed meat, poultry, and fish ( 26 , 27 ) . Dietary intakes were analyzed as continuous variables and in five categories using cut points based on the progressive doubling of intake levels. The same cut points were applied to red meat, processed meat, and fish, with the aim of estimating relative risks for comparable levels of intake. Categorical variables were scored from 1 to 5, according to the interval in which an observation lay. Trend tests were calculated on these scores. Categorical relative risks were calculated from the hazard ratio.
The results were adjusted for estimated energy intake, which was divided into energy from fat and energy from nonfat sources to control partly for error in estimated intakes of foods. To control for body size and obesity, we adjusted for weight and height. Further adjustment included smoking (never, former, and current smoker), alcohol intake (grams per day), dietary fiber (grams per day), and occupational physical activity (no activity, sedentary, standing, manual, and heavy manual). In some models, meat and fish intakes were adjusted for each other. The results were adjusted for dietary folate and use of multivitamin supplements at baseline in 409 135 control subjects and 1176 case patients for whom information on dietary folate was available in the dataset. Separate analyses were done for men and women. Analyses of women were adjusted for use of hormonal replacement therapy. No important differences between the sexes emerged, and only the results for both sexes combined are presented in this report. Subsequent analyses were performed after the exclusion of case patients who were diagnosed during the first 2 years of follow-up.
Calibration of the Dietary Data
A second dietary measurement was taken from an 8% random sample of the cohort (36 994 participants) using a very detailed computerized 24-hour diet recall method ( 28 ) to calibrate dietary measurements across countries and to correct for systematic over- or underestimation of dietary intakes ( 29 – 31 ) . The 24-hour diet recall values of these 36 994 cohort participants were regressed on the main dietary questionnaire values for red and processed meat, poultry, and fish. Zero consumption values in the main dietary questionnaires were excluded in the regression calibration models (5%–13% of the participants depending on the food variable). Energy from nonfat sources, energy from fat sources, weight, height, age at recruitment, day of the week, and season of the year on which the 24-hour recall was collected were included as covariates. Energy from nonfat sources and from fat sources were calibrated following the same approach. Center- and sex-specific calibration models were used to obtain individual predicted values of dietary exposure for all participants.
Cox regression models were then applied using the predicted values for each individual on a continuous scale. The standard error of the de-attenuated coefficient was calculated with bootstrap sampling in the calibration and disease models, consecutively. The Ptrend values for the de-attenuated coefficient were calculated by dividing the de-attenuated coefficient by the bootstrap-derived standard error and approximating the standard normal distribution ( 31 ) .
The Wald statistic was used to test for homogeneity of risks of the left-sided and right-sided colon tumors ( 32 ) . To assess heterogeneity of de-attenuated risk estimates across centers, we included center as main effect and interaction terms in Cox models. Heterogeneity was explored by meta-regression using the Genmod procedure. All analyses were performed using SAS Statistical Software, version 8 (SAS Institute, Cary, NC), and all statistical tests were two-sided. For all analyses, P values <.05 were considered statistically significant.
R ESULTS
A total of 478 040 participants contributed 2279 075 person-years in a mean follow-up of 4.8 years since 1992. During follow-up, 1329 participants were diagnosed with colorectal cancer. Of these cancers, 95% were histologically verified; 855 tumors were located in the colon and 474 in the rectum. The number of colorectal cancer subjects, person-years, and the mean calibrated intakes of meat and fish by center are shown in Table 1 . Baseline characteristics of the participants are also given in Table 2 .
Baseline characteristics according to colorectal cancer status at the end of follow-up in the European Prospective Investigation into Cancer and Nutrition (EPIC) *
| Men | Women | |||||
|---|---|---|---|---|---|---|
| Characteristic | Cases ( n = 542) | Noncases ( n = 141 445) | Cases ( n = 787) | Noncases ( n = 335 265) | ||
| Age, y | 59.6 (7.4) | 52.2 (10.1) | 58.7 (7.9) | 50.8 (9.8) | ||
| Weight, kg | 83.3 (12.6) | 81.3 (12) | 67.6 (12.1) | 66.1 (11.8) | ||
| Height, cm | 174.2 (6.8) | 174.8 (7.4) | 161.8 (6.3) | 162.3 (6.8) | ||
| Fiber, g/day | 21.8 (8.2) | 24.1 (9.4) | 21.6 (7.5) | 22.3 (7.7) | ||
| Folate, μg/day † | 299 (105) | 318 (116) | 300 (129) | 296 (129) | ||
| Smoking, % in each category † | ||||||
| Nonsmokers | 27 | 33 | 57 | 56 | ||
| Former smokers | 48 | 37 | 24 | 23 | ||
| Smokers | 24 | 29 | 17 | 20 | ||
| Physical activity at work, % in each category ‡ | ||||||
| No work activity | 42 | 23 | 50 | 30 | ||
| Sedentary | 26 | 34 | 16 | 22 | ||
| Standing | 16 | 21 | 24 | 28 | ||
| Manual, heavy manual | 15 | 19 | 6 | 7 | ||
Mean (standard deviation) or percentage in each group.
Folate values from 1176 case patients and 409 135 cohort participants.
Percentages do not add to 100% due to missing values.
Increasing red and processed meat intake was statistically significantly associated with increasing risk of colorectal cancer (hazard ratio [HR] for highest versus lowest intake level = 1.57, 95% confidence interval [CI] = 1.13 to 2.17, Ptrend = .001) in analysis adjusted for sex and energy intake ( Table 3 ). This increase in risk was somewhat reduced after adjustment for other covariates (HR = 1.35, 95% CI = 0.96 to 1.88, Ptrend = .03). The association with cancers of the left side of the colon and the rectum was somewhat stronger than that with cancers of the right side of the colon, but the difference was not statistically significant ( Pheterogeneity = .29). In separate analyses, intake of red meat was positively but not statistically significantly associated with colorectal cancer (HR for highest versus lowest intake = 1.17, 95% CI = 0.92 to 1.49, Ptrend = .08), whereas intake of processed meat was statistically significantly associated with increased colorectal cancer risk (HR for highest versus lowest intake = 1.42, 95% CI = 1.09 to 1.86, Ptrend = .02). The results for red meat were similar for colon and rectum and for right and left side of the colon ( Pheterogeneity = .72). Hazard ratios for processed meat intakes were somewhat higher for tumors of the left side of the colon and tumors of the rectum as compared with tumors of the right side of the colon, but the differences were not statistically significant (P heterogeneity = .87).
Multivariable hazard ratios of colorectal cancer and 95% confidence intervals for categories of consumption of red meat, processed meat, poultry, and fish, according to anatomic location for participants in the European Prospective Investigation into Cancer and Nutrition (EPIC)
| Colorectal cancer † ( N = 1329) | Colorectal cancer ‡ ( N = 1329) | Colon cancer ‡ | Rectal cancer ‡ ( N = 474) | ||||||
|---|---|---|---|---|---|---|---|---|---|
| Food group, g/day | N* | All colon ( N = 855) | Right-side ( N = 351) | Left-side (N = 391) | |||||
| Red and processed meat | |||||||||
| <10 | 90 | 1 (referent) | 1 (referent) | 1 (referent) | 1 (referent) | 1 (referent) | 1 (referent) | ||
| 20–40 | 133 | 1.04 (0.79 to 1.38) | 0.98 (0.74 to 1.30) | 0.98 (0.70 to 1.37) | 0.89 (0.55 to 1.45) | 1.34 (0.75 to 2.39) | 0.97 (0.57 to 1.64) | ||
| 40–80 | 466 | 1.33 (1.04 to 1.71) | 1.22 (0.95 to 1.56) | 1.05 (0.78 to 1.42) | 0.99 (0.64 to 1.51) | 1.34 (0.79 to 2.29) | 1.66 (1.06 to 2.62) | ||
| 80–160 | 524 | 1.39 (1.07 to 1.80) | 1.23 (0.94 to 1.60) | 1.17 (0.86 to 1.60) | 1.09 (0.70 to 1.72) | 1.55 (0.89 to 2.69) | 1.40 (0.87 to 2.25) | ||
| ≥160 | 116 | 1.57 (1.13 to 2.17) | 1.35 (0.96 to 1.88) | 1.17 (0.78 to 1.77) | 1.03 (0.56 to 1.91) | 1.51 (0.76 to 3.02) | 1.75 (0.98 to 3.10) | ||
| Ptrend | .001 | .03 | .15 | .47 | .14 | .06 | |||
| Red meat | |||||||||
| <10 | 132 | 1 (referent) | 1 (referent) | 1 (referent) | 1 (referent) | 1 (referent) | 1 (referent) | ||
| 10–20 | 138 | 1.04 (0.81 to 1.33) | 1.00 (0.78 to 1.28) | 1.04 (0.77 to 1.41) | 1.13 (0.70 to 1.84) | 1.07 (0.68 to 1.68) | 0.93 (0.60 to 1.44) | ||
| 20–40 | 323 | 1.09 (0.88 to 1.35) | 1.03 (0.83 to 1.28) | 1.02 (0.78 to 1.32) | 1.00 (0.65 to 1.54) | 1.10 (0.65 to 1.63) | 1.07 (0.74 to 1.55) | ||
| 40–80 | 486 | 1.24 (1.01 to 1.54) | 1.16 (0.94 to 1.43) | 1.16 (0.90 to 1.51) | 1.36 (0.90 to 2.07) | 1.11 (0.75 to 1.64) | 1.16 (0.80 to 1.66) | ||
| ≥80 | 250 | 1.28 (1.1 to 1.64) | 1.17 (0.92 to 1.49) | 1.20 (0.88 to 1.61) | 1.18 (0.73 to 1.91) | 1.24 (0.80 to 1.94) | 1.13 (0.74 to 1.71) | ||
| Ptrend | .008 | .08 | .14 | .22 | .38 | .32 | |||
| Processed meat | |||||||||
| <10 | 232 | 1 (referent) | 1 (referent) | 1 (referent) | 1 (referent) | 1 (referent) | 1 (referent) | ||
| 10–20 | 256 | 1.15 (0.95 to 1.38) | 1.10 (0.91 to 1.32) | 1.08 (0.86 to 1.36) | 1.04 (0.73 to 1.49) | 1.30 (0.92 to 1.83) | 1.13 (0.81 to 1.58) | ||
| 20–40 | 402 | 1.19 (1.00 to 1.43) | 1.12 (0.94 to 1.35) | 1.06 (0.85 to 1.32) | 0.95 (0.67 to 1.34) | 1.32 (0.94 to 1.85) | 1.27 (0.93 to 1.74) | ||
| 40–80 | 318 | 1.23 (1.01 to 1.50) | 1.14 (0.94 to 1.40) | 1.21 (0.95 to 1.54) | 1.17 (0.80 to 1.70) | 1.45 (1.00 to 2.11) | 1.05 (0.74 to 1.50) | ||
| ≥80 | 121 | 1.54 (1.18 to 2.02) | 1.42 (1.09 to 1.86) | 1.30 (0.92 to 1.84) | 1.19 (0.70 to 2.01) | 1.48 (0.87 to 2.53) | 1.62 (1.04 to 2.50) | ||
| Ptrend | .005 | .02 | .12 | .45 | .08 | .20 | |||
| Fish | |||||||||
| <10 | 247 | 1 (referent) | 1 (referent) | 1 (referent) | 1 (referent) | 1 (referent) | 1 (referent) | ||
| 10–20 | 233 | 0.90 (0.75 to 1.08) | 0.88 (0.74 to 1.06) | 0.94 (0.74 to 1.18) | 0.97 (0.69 to 1.38) | 0.81 (0.57 to 1.14) | 0.80 (0.59 to 1.09) | ||
| 20–40 | 428 | 0.88 (0.74 to 1.05) | 0.86 (0.72 to 1.02) | 0.89 (0.72 to 1.11) | 0.76 (0.54 to 1.08) | 0.96 (0.70 to 1.31) | 0.80 (0.60 to 1.06) | ||
| 40–80 | 303 | 0.70 (0.57 to 0.84) | 0.67 (0.56 to 0.82) | 0.69 (0.54 to 0.88) | 0.83 (0.57 to 1.20) | 0.61 (0.42 to 0.88) | 0.64 (0.47 to 0.88) | ||
| ≥80 | 118 | 0.71 (0.55 to 0.91) | 0.69 (0.54 to 0.88) | 0.82 (0.60 to 1.11) | 0.85 (0.53 to 1.37) | 0.70 (0.44 to 1.11) | 0.49 (0.32 to 0.76) | ||
| Ptrend | <.001 | <.001 | .01 | .30 | .02 | <.001 | |||
| Poultry | |||||||||
| <5 | 368 | 1 (referent) | 1 (referent) | 1 (referent) | 1 (referent) | 1 (referent) | 1 (referent) | ||
| 5–10 | 216 | 0.92 (0.77 to 1.10) | 0.90 (0.75 to 1.08) | 0.92 (0.74 to 1.14) | 0.83 (0.59 to 1.16) | 1.00 (0.72 to 1.38) | 0.87 (0.64 to 1.18) | ||
| 10–20 | 319 | 0.90 (0.77 to 1.06) | 0.88 (0.75 to 1.03) | 0.83 (0.67 to 1.01) | 0.72 (0.52 to 0.99) | 0.88 (0.65 to 1.18) | 0.97 (0.75 to 1.27) | ||
| 20–40 | 235 | 0.87 (0.73 to 1.04) | 0.85 (0.71 to 1.01) | 0.86 (0.69 to 1.07) | 0.87 (0.62 to 1.21) | 0.85 (0.61 to 1.18) | 0.83 (0.62 to 1.12) | ||
| ≥40 | 191 | 0.94 (0.78 to 1.15) | 0.92 (0.76 to 1.12) | 0.89 (0.70 to 1.13) | 0.78 (0.53 to 1.16) | 0.87 (0.60 to 1.25) | 0.99 (0.71 to 1.37) | ||
| Ptrend | .29 | .18 | .19 | .21 | .27 | .65 | |||
Distribution of colorectal cancer cases by category of meat intake.
Cox regression using age, sex, energy from nonfat sources (continuous variable), energy from fat sources (continuous variable), and stratified for center.
Cox regression using age, sex, energy from nonfat sources (continuous variable), energy from fat sources (continuous variable), height (tertiles defined for each sex and center), weight (tertiles defined for each sex and center), occupational physical activity (no activity, sedentary, standing, manual, or heavy manual), smoking status (never, former, or current smoker), dietary fiber (g/day), alcohol intake (g/day), and stratified for center.
In analyses of subgroups of red meats, colorectal cancer risk was statistically significantly associated with intake of pork (for highest versus lowest intake, HR = 1.18, 95% CI = 0.95 to 1.48, Ptrend = .02) and lamb (HR = 1.22, 95% CI = 0.96 to 1.55, Ptrend = .03) but not with beef/veal (HR = 1.03, 95% CI = 0.86 to 1.24, Ptrend = .76). In analyses in which intake of each meat was mutually adjusted for intake of the other meats, only the trend for increased colorectal cancer risk with increased pork intake remained statistically significant ( Ptrend = .03). Intakes of ham (for highest versus lowest intake, HR = 1.12, 95% CI = 0.90 to 1.37, Ptrend = .44), of bacon (HR = 0.96, 95% CI = 0.79 to 1.17, Ptrend = .34), and of other processed meats (mainly sausages) (HR = 1.05,95% CI = 0.84 to 1.32, Ptrend =.22) were not independentlyrelated to colorectal cancer risk.
Intake of fish was statistically significantly inversely associated with colorectal cancer risk (for highest versus lowest intake HR = 0.69, 95% CI = 0.54 to 0.88, Ptrend <.001). The trend for an inverse association was statistically significant for cancers of the left side of the colon ( Ptrend = .02) and the rectum ( Ptrend <.001), but not for cancers of the right side of the colon ( Table 3 ). Intake of poultry was not statistically significantly associated with colorectal cancer risk. The inverse association with fish and the positive association with red and processed meat intake persisted when fish, poultry, and red and processed meat were all included as continuous variables in the same model ( Ptrend <.001 for fish and Ptrend = .02 for red and processed meat). In this study population, the absolute risk of developing colorectal cancer within 10 years for a study subject aged 50 years was 1.71% for the highest category of red and processed meat intake and 1.28% for the lowest category of intake, was 1.86% for subjects in the lowest category of fish intake, and was 1.28% for subjects in the highest category of fish intake.
When we adjusted for dietary folate intake in a subset of the cohort including only participants for whom the information on folate intake was available in the core dataset (1176 colorectal cancer case patients and 407 959 participants free of colorectal cancer), the results were not substantially modified. For this subset, the hazard ratio for the highest intake of red and processed meat versus lowest intake was 1.27 ( Ptrend = .12) before adjustment for folate and 1.25 ( Ptrend = .15) after adjustment. For the highest versus the lowest intake of fish, the hazard ratios were 0.68 ( Ptrend <.001) before and 0.67 ( Ptrend <.001) after adjustment for folate.
We tested the consistency of these results after the exclusion of the case patients diagnosed during the first 2 years of follow-up, because these case patients might have modified their diet during the prediagnostic disease phase that preceded enrollment. The hazard ratios for the group with the highest consumption of red and processed meat were 1.35 (95% CI = 0.96 to 1.88) before and 1.35 (95% CI = 0.90 to 2.03) after exclusion (1329 and 861 colorectal cancer case patients, respectively); for fish the hazard ratios were 0.69 before and 0.70 after the exclusions.
Calibration of the data for systematic and random dietary intake measurement errors strengthened the observed associations between red and processed meat and fish intake and colorectal cancer risk. The multivariable hazard ratio per 100-g increase in intake of red and processed meat was 1.25 (95% CI = 1.09 to 1.41, Ptrend = .001) before calibration and 1.55 (95% CI = 1.19 to 2.02, Ptrend = .001) after calibration. In corrected models, the association between intake of processed meat and colon cancer risk (HR per 100-g increase =1.68, 95% CI = 0.87 to 3.27) was stronger than the association between intake of red meat (HR = 1.36, 95% CI = 0.74 to 2.50), but neither association was statistically significant. The corrected estimates for rectal cancer were similar to those for colon cancer ( Table 4 ). The hazard ratios per 100-g increase in fish intake were 0.70 (95% CI = 0.57 to 0.87, Ptrend <.001) and 0.46 (95% CI = 0.27 to 0.77, Ptrend = .003) before and after correction. The association was statistically significant and similar for both colon and rectal cancers. Uncorrected and corrected hazard ratios across all ranges of red and processed meat and fish consumed are shown ( Fig. 1 ).
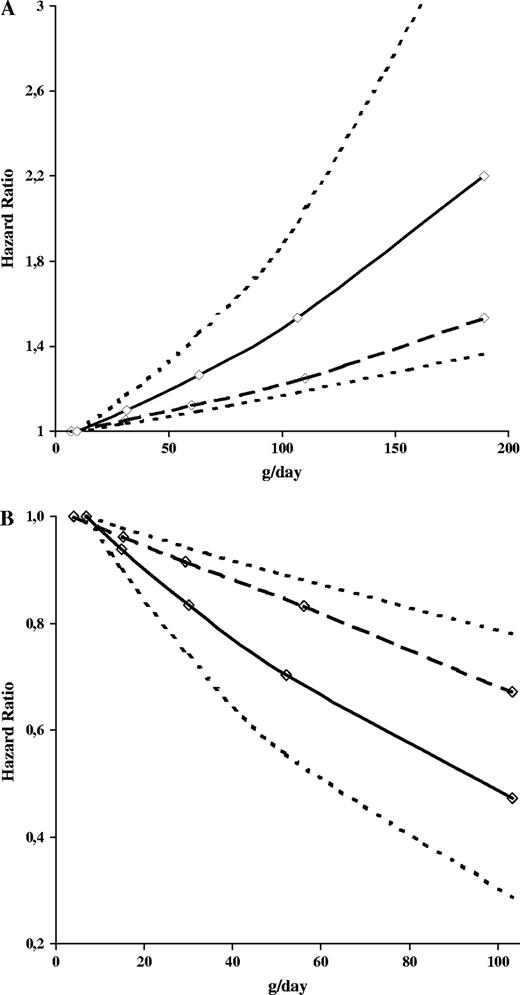
Hazard ratios of colorectal cancer in the European Prospective Investigation into Cancer and Nutrition Cohort. Hazard ratios by A ) intake of red and processed meat and B ) by intake of fish. Hazard ratios were calculated from Cox regression models adjusted for age, sex, energy from nonfat sources (continuous variable), energy from fat sources (continuous variable), height (tertiles defined for each sex and center), weight (tertiles defined for each sex and center), work-related physical activity (no activity, sedentary, standing, manual, or heavy manual) smoking status (never, former, or current smoker), alcohol consumption (grams per day) and stratified for center. Points in the figure represent median intakes in each category of consumption. Curves generated from calibrated data ( solid line ) and uncalibrated data ( hatched line ) and upper and lower confidence intervals for calibrated data ( dotted lines ) are shown.
Multivariable hazard ratios (HRs, per 100 g) and 95% confidence intervals (CIs) of colorectal cancer for observed and calibrated intakes of red meat, processed meat, fish, and poultry by anatomic location for participants in the European Prospective Investigation into Cancer and Nutrition (EPIC) *
| Observed | Calibrated | ||||||
|---|---|---|---|---|---|---|---|
| Food group | Cancer site | HR (95% CI), per 100 g | Ptrend | HR (95% CI), per 100 g | Ptrend | ||
| Red and processed meat | Colorectum | 1.25 (1.09 to 1.41) | .001 | 1.55 (1.19 to 2.02) | .001 | ||
| Colon | 1.26 (1.07 to 1.48) | .006 | 1.49 (1.03 to 2.16) | .04 | |||
| Rectum | 1.22 (0.99 to 1.51) | .06 | 1.65 (1.05 to 2.62) | .03 | |||
| Red meat | Colorectum | 1.21 (1.02 to 1.43) | .03 | 1.49 (0.91 to 2.43) | .11 | ||
| Colon | 1.20 (0.96 to 1.48) | .10 | 1.36 (0.74 to 2.50) | .32 | |||
| Rectum | 1.23 (0.94 to 1.62) | .14 | 1.75 (0.93 to 3.30) | .08 | |||
| Processed meat | Colorectum | 1.32 (1.07 to 1.63) | .009 | 1.70 (1.05 to 2.76) | .03 | ||
| Colon | 1.39 (1.06 to 1.82) | .01 | 1.68 (0.87 to 3.27) | .12 | |||
| Rectum | 1.22 (0.87 to 1.71) | .25 | 1.70 (0.83 to 3.47) | .14 | |||
| Fish | Colorectum | 0.70 (0.57 to 0.87) | <.001 | 0.46 (0.27 to 0.77) | .003 | ||
| Colon | 0.76 (0.59 to 0.99) | .04 | 0.49 (0.26 to 0.93) | .03 | |||
| Rectum | 0.61 (0.43 to 0.87) | .006 | 0.41 (0.17 to 0.97) | .04 | |||
| Poultry | Colorectum | 0.92 (0.68 to 1.25) | .61 | 0.85 (0.43 to 1.70) | .65 | ||
| Colon | 0.92 (0.63 to 1.35) | .68 | 0.76 (0.29 to 2.03) | .59 | |||
| Rectum | 0.92 (0.56 to 1.53) | .77 | 1.04 (0.34 to 3.23) | .94 | |||
Cox regression with age as primary time variable. Covariates are sex, energy from fat, energy from -nonfat sources except alcohol, height (tertiles defined by sex and center), weight (tertiles defined by sex and center), current alcohol intake (g/day), occupational physical activity, smoking status (never, former, or current smoker), and fiber intake. Stratification by center.
Calibrated hazard ratios were estimated for each center with more than 50 colorectal cancer case patients ( Fig. 2 ). The association of red and processed meat intake with colorectal cancer was consistent across centers ( Pheterogeneity = .82). However, the association with fish intake was not consistent across centers ( Pheterogeneity = .03). In meta-regression analyses, none of the following variables independently explained the heterogeneity: geographic region (Nordic countries, United Kingdom, Central Europe, or South of Europe), mean fish intake in each cohort ( 27 ) , and proportion of consumed fish that was grilled, fried, or barbecued, as estimated from 24-hour dietary recall ( 33 ) . In addition, when mean fatty fish intake from 24-hour dietary recall ( 27 ) was included in the models instead of mean total fish intake, the results were unchanged.
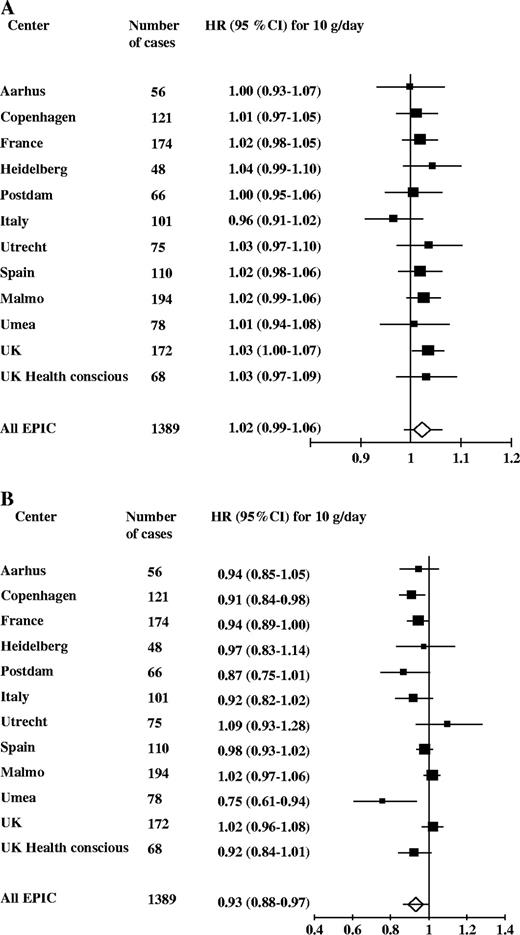
Multivariable hazard ratios and 95% confidence intervals from calibrated analyses of colorectal cancer for individual center in the European Prospective Investigation into Cancer and Nutrition (EPIC) Cohort. Hazard ratios (HRs) per 100-g increase in intake and 95% confidence intervals (CIs) were calculated for calibrated intakes of A ) red and processed meat and B ) fish. Hazard ratios were calculated from β coefficients from Cox regression models adjusted for age, sex, energy from nonfat sources (continuous variable), energy from fat sources (continuous variable), height (tertiles defined for each sex and center), weight (tertiles defined for each sex and center), work-related physical activity (no activity, sedentary, standing, manual, or heavy manual) smoking status (never, former, or current smoker), fiber intake (grams per day) and alcohol consumption (grams of day). Centers with fewer than 50 case patients with colorectal cancer are not included. The black squares and horizontal lines correspond to the center-specific hazard ratios (per 100-g increase in intake) and 95% confidence intervals. The area of the square reflects the center-specific statistical weight (inverse of the variance). The diamond and horizontal lines represent the hazard ratio and 95% confidence intervals in EPIC.
To examine whether the displacement of red and processed meat intake by fish could partially explain the inverse association of fish intake with colorectal cancer risk, we conducted cross-classified analyses by sex-defined tertiles of fish and red and processed meat intake (Spearman correlation coefficient r , between intake levels of fish and red and processed meat after adjustment for age, sex, center, energy intake, height, and weight = .04 in men and .07 in women). No interaction between fish and meat was observed ( Pinteraction = .82). The risk increase associated with high consumption of red and processed meat versus low consumption (>129 g/day in men and >85 g/day in women versus <30 g/day in men and <13 g/day in women) was 12%–20%, independent of the levels of fish consumption ( Fig. 3 ). The risk increase associated with low versus high fish consumption (<14 g/day in both men and women versus >50 g/day in men and women) was approximately 40%, independent of the levels of red and processed meat intake. Subjects with high red meat and low fish intake were at 63% increased risk of colorectal cancer (HR = 1.63, 95% CI = 1.22 to 2.16), compared with subjects with low red meat and high fish intake.
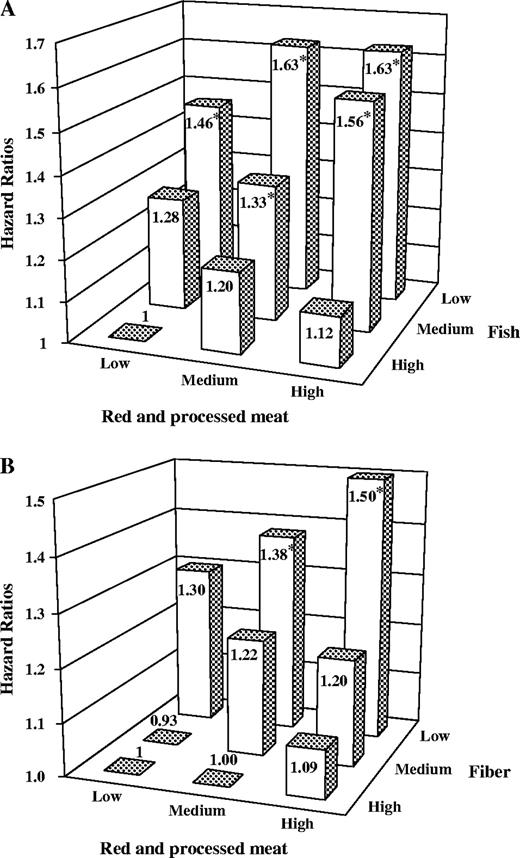
Multivariable hazard ratios for colorectal cancer in the European Prospective Investigation into Cancer and Nutrition Cohort. Hazard ratios for intakes of A ) red and processed meat and fish and B ) red and processed meat and fiber. Multivariable analysis was performed using Cox regression models adjusted for age, sex, energy from nonfat sources (continuous variable), energy from fat sources (continuous variable), height (tertiles defined for each sex and center), weight (tertiles defined for each sex and center), work-related physical activity (no activity, sedentary, standing, manual, or heavy manual) smoking status (never, former, or current smoker), alcohol consumption (grams per day) and stratified by center. Low, medium, and high represent sex-specific tertiles. For red meat intake, low was less than 30 g/day of red and processed meat in men and less than 13 g/day in women, medium was 30–129 g/day in men and 13 to 85 g/day in women, and high was more than 129 g/day in men and 85 g/day in women. Cut points for fish intake were the same for men and women, with low being less than 14 g/day, medium being 14–50 g/day, and high being more than 50 g/day. For fiber intake, low was less than 17 g/day in men and women, medium was 17–28 g/day in men and 17–26 g/day in women, and high was more than 28 g/day in men and 26 g/day in women. * P <.05 relative to the group of subjects with low red and processed meat and high fish intake ( A ) or high fiber intake ( B ).
We also used cross-classified analysis to investigate whether low fiber intake could partially explain the increase in colorectal cancer risk in high consumers of red and processed meat (Spearman correlation coefficient between fiber and red and processed meat after adjustment for age, sex, center, energy intake, height, and weight = −.18 in men and −.21 in women). The increase in colorectal cancer risk associated with high intake of red and processed meat was more apparent in the group of participants in the categories of low (<17 g/day) and medium (17 to 26 g/day in women and 17 to 28 g/day in men) fiber intake than in the high (>26 g/day in women and >28 g/day in men) intake group ( Pinteraction = .06). The hazard ratio in the cohort participants with high intake of red and processed meat was 1.09 (95% CI = 0.83 to 1.42) for the group with high intake of fiber, 1.20 (95% CI = 0.93 to 1.56) for the group with medium intake of fiber, and 1.50 (95% CI = 1.15 to 1.97) for the group with low intake of fiber compared with the group with low intake of red and processed meat and high intake of fiber. A statistically significant risk increase was also observed for the group of subjects with low intake of fiber and medium intake of red and processed meat (HR= 1.38, 95% CI = 1.06 to 1.80) compared with the group with high intake of fiber and low intake of red and processed meat. The risk reduction associated with high fiber intake was of similar magnitude in all categories of intake of red and processed meat.
D ISCUSSION
The results reported here are from one of the largest cohorts of men and women that has been developed specifically to examine the relationship between diet and cancer. We found a consistent positive association between high intake of red and processed meat and colorectal cancer and an inverse association between high intake of fish and colorectal cancer. These findings held in models adjusted for age, sex, and energy and in models adjusted for other covariates.
In this study population, the absolute risk of developing colorectal cancer within 10 years for a study subject aged 50 years was 1.71% for the highest category of red meat intake and 1.28% for the lowest category of intake; risk was 1.86% for subjects in the lowest category of fish intake and 1.28% for subjects in the highest category of fish intake. We found that the associations of red meat and fish intake with cancer risk were stronger for tumors of the rectum and left side of the colon than for right-sided colon tumors, although differences were not statistically significant. The opposing associations of red meat and fish intake were not explained by the displacement of one by the other, because the associations did not disappear when fish and red meat were mutually adjusted for each other. Colorectal cancer risk was not associated with poultry intake.
The mechanisms underlying the association between colorectal cancer risk and high intake of red and processed meat are uncertain. Controlled human intervention studies have raised the possibility that the endogenous nitrosation that arises from ingestion of heme iron but not of inorganic iron or protein may account for the increased risk associated with red and processed meat consumption ( 34 , 35 ) . Heterocyclic amines (HCAs) and polycyclic aromatic hydrocarbons (PAH) in diet may pose a potential risk of cancer to humans ( 36 ) , depending on the extent to which the compounds are activated in vivo by metabolic enzymes. HCAs are formed as a byproduct of reactions during the cooking of meat, poultry, and fish at high temperatures, such as pan-frying or grilling with charcoal or on a gas grill; PAHs are formed in grilled and barbecued meat and in cured, processed foods ( 36 ) . The results of studies of the association of polymorphisms of genes encoding for enzymes associated with the metabolism and disposition of HCAs and PAHs and risk of colorectal cancer are inconsistent ( 37 – 41 ) . Information on cooking methods to estimate dietary exposure to HCAs and PAHs produced from pyrolysis of meat and fish was not systematically collected in the baseline EPIC dietary questionnaires. However, this information was systematically collected in the 24-hour diet recall study. Chicken is a major contributor to HCA intake, but we observed no association between poultry intake and colorectal cancer risk in this study. Furthermore, although analyses of the 24-hour recall data showed a high variation in meat and fish cooking practices across cohorts participating in EPIC ( 33 ) , we did not observe heterogeneity of association of colorectal cancer risk with red meat intake across the centers ( Fig. 2 ).
It has been suggested that processed meat intake has a stronger association with colorectal cancer than red meat intake ( 3 , 7 ) . Indeed, in this European study, we found that the overall association with colorectal cancer risk was stronger for processed than for unprocessed red meat. However, we could not determine whether one particular type of either red meat or processed meat was more strongly associated with colorectal cancer risk than others. In Europe, processed meat is a mixed category of mainly pork and beef meats that are preserved by mechanical, chemical, or enzymatic procedures. The methods of preparing processed meat vary across Europe and have changed over time. Common ingredients used in processed meats are salt, phosphates, nitrite, nitrate, water, sugar, fat, and spices ( 26 ) . To our knowledge, there are no clearly demonstrated biologic mechanisms that could explain why the observed association of colorectal cancer risk with processed meat might be stronger than that with unprocessed red meat. Nitrites or nitrates added to meat for preservation could increase exogenous exposure to nitrosamines, other N -nitrosocompounds, and their precursors, but not all processed meats contain added nitrites—for example, most sausages and air-dried hams do not.
All of the red and virtually all of the processed meat studied here would have contained greater amounts of heme, which is known to stimulate production of endogenous N -nitroso compounds in the human gastrointestinal system ( 34 ) , than poultry, which contains much lower amounts of heme and does not stimulate endogenous N -nitroso compound formation ( 35 ) . Endogenous N -nitrosation, arising from ingestion of heme, may account for the increased risk of colorectal cancer associated with high consumption of red meat and the lack of association with intake of poultry.
The trend in the association between increased fish consumption and decreased colorectal cancer risk was highly statistically significant ( Ptrend <.001). Results from animal and in vitro studies indicate that n−3 fatty acids, especially the long-chain polyunsaturated fatty acids eicosapentaenoic and docosahexaenoic acids, which are present in fatty cold-water fish and fish oils, inhibit carcinogenesis ( 42 ) . However, we were unable to differentiate between intakes of fatty fish, which contains the majority of n−3 fatty acids and other fish. Furthermore, heterogeneity was encountered among the different cohorts, and it is not clear whether this heterogeneity could be explained by unaccounted for differences in the fat content of fish ( 27 ) , in cooking practices across EPIC cohorts ( 33 ) , or by the small numbers of case patients in some centers.
Our study has several limitations. Most important, methods used in nutritional epidemiology are known to provide imprecise estimates of food intake. Random measurement errors of food intake lead to the attenuation of the disease risk estimates ( 43 ) . We attempted to correct for this error by adjusting for total energy intake and body weight, because adjustment for self-reported total energy intake is thought to partially correct for measurement error ( 44 ) . Body weight was also included because it has been suggested to be a better measure of real, unmeasured energy intake than energy intake derived from dietary questionnaires ( 45 ) . Furthermore, as a novel procedure to correct the relative risk estimates for de-attenuation, we calibrated the dietary questionnaires using a more detailed reference method, the 24-hour diet recall, under the assumption that a single 24-hour recall provides unbiased estimates of dietary intake at a group level. This choice maximizes the statistical power for adjusting relative risk estimates, but it does not permit the correction of hazard ratios associated with quantiles of intakes ( 43 ) . The method of calibration that we used assumes that there are no correlations of errors produced by the reference method (24-hour diet recall) and the dietary questionnaire ( 46 , 47 ) . In practice, however, there is evidence that the individual errors of dietary measurements obtained with dietary questionnaires and 24-hour diet recalls tend to be positively correlated ( 48 ) ; such correlation would lead to an underestimation of the de-attenuation factor and therefore would bias the hazard ratio estimates toward the null value of 1.
The assumption that the more detailed reference method provides unbiased estimates of dietary intake at a group level was tested using biomarkers of intake in a validation study involving 1103 volunteers of both sexes from 12 centers participating in EPIC ( 49 ) . Group mean nitrogen intakes obtained with the 24-hour diet recalls, used as the reference for calibration, were compared against mean 24-hour urinary nitrogen, a quantitative marker of protein intake. The sex-adjusted partial Pearson's correlation coefficient between urinary and dietary nitrogen at the mean group level was .84 (.90 after exclusion of outliers), and the calculated β regression coefficients were not statistically significantly different from 1, suggesting that, overall, systematic bias across centers was modest and of uniform magnitude. Nevertheless, because calibration adjusts only partially for measurement error, the almost two-fold increase in colorectal cancer risk for the highest versus lowest daily intake of red and processed meat, estimated after the calibration ( Fig. 1 ), should still be considered a conservative estimate of the real underlying association.
It has been recently estimated that approximately 70% of colorectal cancer could be avoided by changes in lifestyle in Western countries ( 50 ) . Risk factors included in this recent estimate were obesity, physical inactivity, high alcohol consumption, early adulthood cigarette smoking, high red meat consumption, and low intake of folic acid. The investigation of the combined association of these factors with colorectal cancer risk is ongoing in EPIC. Our results published here support the hypothesis that colorectal cancer risk is positively associated with high consumption of red and processed meat and inversely associated with the intake of fish and confirm in a larger number of case patients our previous results ( 22 ) of a statistically significant inverse association between intake of fiber and colorectal cancer risk.
The work described in this article was carried out with financial support of the “Europe Against Cancer Program” of the European Commission (SANCO); the Danish Cancer Society; German Cancer Aid; Ligue Nationale contre le Cancer, the 3M Company, INSERM; the German Cancer Research Center; the German Federal Ministry of Education and Research; the Dutch Ministry of Public Health, Welfare and Sports; the National Cancer Registry and the Regional Cancer Registries Amsterdam, East and Maastricht of The Netherlands; the Norwegian Cancer Society; the Norwegian Research Council; the Health Research Fund (FIS) of the Spanish Ministry of Health; the Greek Ministry of Health; the Greek Ministry of Education; the Italian Association for Research on Cancer; Spanish Regional Governments of Andalucia, Asturias, Basque Country, Murcia and Navarra, and ISCIII; Red de Centros RCESP, C03/09; the Swedish Cancer Society; the Swedish Scientific Council; the Regional Government of Skane, Sweden; Cancer Research UK; the Medical Research Council, UK; the Stroke Association, UK; the British Heart Foundation; the Department of Health, UK; the Food Standards Agency, UK; and the Wellcome Trust, UK.
References
Willett WC, Stampfer MJ, Colditz GA, Rosner BA, Speizer FE. Relation of meat, fat, and fiber intake to the risk of colon cancer in a prospective study among women.
WCRF-AICR. Food, nutrition and the prevention of cancer: a global perspective. Washington DC: American Institute for Cancer Research,
Norat T, Lukanova A, Ferrari P, Riboli E. Meat consumption and colorectal cancer risk: dose-response meta-analysis of epidemiological studies.
Sandhu MS, White IR, McPherson K. Systematic review of the prospective cohort studies on meat consumption and colorectal cancer risk: a meta-analytical approach.
Wei EK, Giovannucci E, Wu K, Rosner B, Fuchs CS, Willett WC, et al. Comparison of risk factors for colon and rectal cancer.
Flood A, Velie EM, Sinha R, Chaterjee N, Lacey JV Jr, Schairer C, et al. Meat, fat, and their subtypes as risk factors for colorectal cancer in a prospective cohort of women.
Chao A, Thun MJ, Connell CJ, McCullough ML, Jacobs EJ, Flanders WD, et al. Meat consumption and risk of colorectal cancer.
Giovannucci E, Rimm EB, Stampfer MJ, Colditz GA, Ascherio A, Willett WC. Intake of fat, meat, and fiber in relation to risk of colon cancer in men.
Bostick RM, Potter JD, Kushi LH, Sellers TA, Steinmetz KA, McKenzie DR, et al. Sugar, meat, and fat intake, and non-dietary risk factors for colon cancer incidence in Iowa women (United States).
Goldbohm RA, van den Brandt PA, van't Veer P, Brants HA, Dorant E, Sturmans F, et al. A prospective cohort study on the relation between meat consumption and the risk of colon cancer.
Gaard M, Tretli S, Loken EB. Dietary factors and risk of colon cancer: a prospective study of 50,535 young Norwegian men and women.
Kato I, Akhmedkhanov A, Koenig K, Toniolo PG, Shore RE, Riboli E. Prospective study of diet and female colorectal cancer: the New York University Women's Health Study.
Pietinen P, Malila N, Virtanen M, Hartman TJ, Tangrea JA, Albanes D, et al. Diet and risk of colorectal cancer in a cohort of Finnish men.
Singh PN, Fraser GE. Dietary risk factors for colon cancer in a low-risk population.
Hsing AW, McLaughlin JK, Chow WH, Schuman LM, Co CH, Gridley G, et al. Risk factors for colorectal cancer in a prospective study among U.S. white men.
Tiemersma EW, Kampman E, Bueno de Mesquita HB, Bunschoten A, van Schothorst EM, Kok FJ, et al. Meat consumption, cigarette smoking, and genetic susceptibility in the etiology of colorectal cancer: results from a Dutch prospective study.
Kobayashi M, Tsubono Y, Otani T, Hanaoka T, Sobue T, Tsugane S; JPHC Study Group. Fish, long-chain n-3 polyunsaturated fatty acids, and risk of colorectal cancer in middle-aged Japanese: the JPHC study.
English DR, MacInnis RJ, Hodge AM, Hopper JL, Haydon AM, Giles GG. Red meat, chicken, and fish consumption and risk of colorectal cancer.
Larsson SC, Rafter J, Holmberg L, Bergkvist L, Wolk A. Red meat consumption and risk of cancers of the proximal colon, distal colon and rectum: the Swedish Mammography Cohort.
Bingham S, Riboli E. Diet and cancer—the European Prospective Investigation into Cancer and Nutrition.
Two studies find high-fiber diet lowers colon cancer risk.
Bingham SA, Day NE, Luben R, Ferrari P, Slimani N, Norat T, et al. Dietary fibre in food and protection against colorectal cancer in the European Prospective Investigation into Cancer and Nutrition (EPIC): an observational study.
Riboli E, Hunt KJ, Slimani N, Ferrari P, Norat T, Fahey M, et al. European Prospective Investigation into Cancer and Nutrition (EPIC): study populations and data collection.
Ferrari P, Slimani N, Ciampi A, Trichopoulou A, Naska A, Lauria C, et al. Evaluation of under- and overreporting of energy intake in the 24-hour diet recalls in the European Prospective Investigation into Cancer and Nutrition (EPIC).
European Prospective Investigation into Cancer and Nutrition. Validity studies on dietary assessment methods.
Linseisen J, Kesse E, Slimani N, Bueno-de-Mesquita HB, Ocke MC, Skeie G, et al. Meat consumption in the European Prospective Investigation into Cancer and Nutrition (EPIC) cohorts: results from 24-hour dietary recalls.
Welch AA, Lund E, Amiano P, Dorronsoro M, Brustad M, Kumle M, et al. Variability of fish consumption within the 10 European countries participating in the European Investigation into Cancer and Nutrition (EPIC) study.
Slimani N, Kaaks R, Ferrari P, Casagrande C, Clavel-Chapelon F, Lotze G, et al. European Prospective Investigation into Cancer and Nutrition (EPIC) calibration study: rationale, design and population characteristics.
Kaaks R, Plummer M, Riboli E, Esteve J, van Staveren W. Adjustment for bias due to errors in exposure assessments in multicenter cohort studies on diet and cancer: a calibration approach.
Ferrari P, Kaaks R, Fahey M, Slimani N, Day NE, Pera G, et al. Within and between cohort variation in measured macro-nutrient intakes in the EPIC study taking account of measurement errors.
Rosner B, Gore R. Measurement error correction in nutritional epidemiology based on individual foods, with application to the relation of diet to breast cancer.
Greenland S, Rothman KJ. Introduction to stratified analysis. In: Rothman KJ, Greenland S, editors. Modern epidemiology. 2nd ed. Philadelphia (PA): Lippincott-Raven;
Rohrmann S, Linseisen J, Becker N, Norat T, Sinha R, Skeie G, et al. Cooking of meat and fish in Europe—results from the European Prospective Investigation into Cancer and Nutrition (EPIC).
Cross AJ, Pollock JR, Bingham SA. Haem, not protein or inorganic iron, is responsible for endogenous intestinal N-nitrosation arising from red meat.
Bingham SA, Hughes R, Cross AJ. Effect of white versus red meat on endogenous N-nitrosation in the human colon and further evidence of a dose response.
Sachse C, Smith G, Wilkie MJ, Barrett JH, Waxman R, Sullivan F, et al. A pharmacogenetic study to investigate the role of dietary carcinogens in the etiology of colorectal cancer.
Kampman E, Slattery ML, Bigler J, Leppert M, Samowitz W, Caan BJ, et al. Meat consumption, genetic susceptibility, and colon cancer risk: a United States multicenter case-control study.
Lang NP, Butler MA, Massengill J, Lawson M, Stotts RC, Hauer-Jensen M, et al. Rapid metabolic phenotypes for acetyltransferase and cytochrome P4501A2 and putative exposure to food-borne heterocyclic amines increase the risk for colorectal cancer or polyps.
Roberts-Thomson IC, Butler WJ, Ryan P. Meat, metabolic genotypes and risk for colorectal cancer.
Murtaugh MA, Sweeney C, Ma KN, Caan BJ, Slattery ML. The CYP 1A1 genotype may alter the association of meat consumption patterns and preparation with the risk of colorectal cancer in men and women.
Larsson SC, Kumlin M, Ingelman-Sundberg M, Wolk A. Dietary long-chain n-3 fatty acids for the prevention of cancer: a review of potential mechanisms.
Kaaks R, Riboli E, van Staveren W. Calibration of dietary intake measurements in prospective cohort studies.
Willett W. Commentary: Dietary diaries versus food frequency questionnaires—a case of undigestible data.
Jakes RW, Day NE, Luben R, Welch A, Bingham S, Mitchell J, et al. Adjusting for energy intake—what measure to use in nutritional epidemiological studies?
Day N, McKeown N, Wong M, Welch A, Bingham S. Epidemiological assessment of diet: a comparison of a 7-day diary with a food frequency questionnaire using urinary markers of nitrogen, potassium and sodium.
Kipnis V, Carroll RJ, Freedman LS, Li L. Implications of a new dietary measurement error model for estimation of relative risk: application to four calibration studies.
Kipnis V, Midthune D, Freedman L, Bingham S, Day NE, Riboli E, et al. Bias in dietary-report instruments and its implications for nutritional epidemiology.
Slimani N, Bingham S, Runswick S, Ferrari P, Day NE, Welch AA, et al. Group level validation of protein intakes estimated by 24-hour diet recall and dietary questionnaires against 24-hour urinary nitrogen in the European Prospective Investigation into Cancer and Nutrition (EPIC) calibration study.

