


Abstract
Rare inactivating mutations in BRCA1, BRCA2, ATM, TP53 and CHEK2 confer relative risks for breast cancer between about 2 and more than 10, but more common variants in these genes are generally considered of little or no clinical significance. Under the polygenic model for breast cancer carriers of multiple low-penetrance alleles are at high risk, but few such alleles have been reliably identified. We analysed 1037 potentially functional single nucleotide polymorphisms (SNPs) in candidate cancer genes in 473 women with two primary breast cancers and 2463 controls. Twenty-five of these SNPs were in BRCA1, BRCA2, ATM, TP53 and CHEK2. Among the 1037 SNPs there were a few significant findings, but hardly more than would be expected in this large experiment. There was, however, a significant trend in risk with increasing numbers of variant alleles for the 25 SNPs in BRCA1, BRCA2, ATM, TP53 and CHEK2 (Ptrend = 0.005). For the 21 of these with minor allele frequency <10% this trend was highly significant (Ptrend = 0.00004, odds ratio for 3 or more SNPs = 2.90, 95% CI 1.69–4.97). The individual effects of most of these risk alleles were undetectably small even in this well powered study, but the risk conferred by multiple variants is readily detectable and makes a substantial contribution to susceptibility. A risk score incorporating a suitably weighted sum of all potentially functional variants in these and a few other candidate genes may provide clinically useful identification of women at high genetic risk.
INTRODUCTION
A large proportion of all breast cancers arise in a genetically susceptible minority of women (1), most of whom are not carriers of BRCA1 or BRCA2 (2–4). The variation in familial breast cancer risk unaccounted for by high-risk mutations in known genes can be explained by a polygenic model in which a large number of ‘low-penetrance’ genes that confer small risks individually act in combination to cause wide variation in risk in the population (5). Many reported associations for individual single nucleotide polymorphisms (SNPs) have not been replicated in subsequent studies (6–8) but for a minority the evidence is consistent (9). Several whole genome association studies to identify common haplotypes associated with breast cancer risk are currently underway, but such studies have low power to detect the effects of low-penetrance alleles with minor allele frequency (MAF) less than ∼10%.
We have analysed 1037 non-synonymous SNPs in 2463 controls and 473 breast cancer cases with two primary breast cancers. Association studies of women with two primary breast cancers are at least four times as efficient as those using unselected cases, and the more extreme odds ratios (ORs) measured in such studies are less likely to be due to the combined effects of chance and bias. Twenty-five of our SNPs were within five genes (BRCA1, BRCA2, ATM, TP53 and CHEK2) in which rare inactivating mutations have been unequivocally associated with breast cancer risk (3,10,11). No SNPs were included in PTEN, or in two further genes (BRIP1 and PALB2) for which similar results have recently been reported (12–14). We have examined the combined effects of these 25 SNPs both overall and within each gene.
RESULTS
Figure 1 shows the MAF and the OR for cases with two primary breast cancers for each SNP under dominant and recessive models (full details of all 1037 SNPs are given in Supplementary Material, Table S4). The only SNP with an OR > 1.5 in carriers and MAF > 5% is BRCA1 Q356R. (MAF = 5.4%, carrier OR 1.72, P = 0.0002). The corresponding OR for a first primary breast cancer is 1.31, the square root of 1.72 (15). Table 1 shows case and control genotypes for the 25 SNPs in BRCA1, BRCA2, CHEK2, ATM and TP53. In addition to BRCA1 Q356R, the OR was significantly increased (0.01 < P < 0.05) among homozygotes for 3 BRCA1 variants (D693 N, K1183R and S1613G) and among carriers for ATM P1054R. Two cases and no controls carried the only variant analysed in CHEK2 (I157T: P = 0.03). Counting two for a homozygote, the risk increased with increasing numbers of variant alleles for these 25 SNPs (Table 2: multiplicative OR per SNP = 1.08, 95% CI 1.02–1.14, Ptrend = 0.005). The OR per SNP was 1.07 (95% CI 1.00–1.14, Ptrend = 0.04) for BRCA1, 1.08 (95% CI 0.94–1.24, Ptrend = 0.27) for BRCA2 and 1.27 (95% CI 1.04–1.56, Ptrend = 0.02) for ATM.
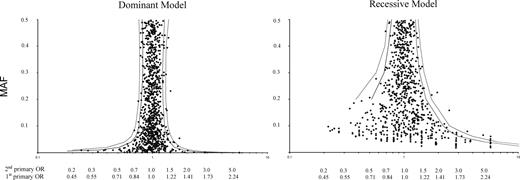
Observed ORs for two primary breast cancers and minor allele frequencies for 1037 SNPs, with 5% (grey) and 1% (black) significance limits. The y-axis shows the MAF (%) and the x-axis shows the OR for two primary breast cancers (upper scale) and a first primary breast cancer (lower scale). The OR for a first primary breast cancer is calculated as the square root of the observed OR in women with two primaries.
Genotypes in 473 cases with two primary breast cancers and 2463 controls for 25 SNPs in BRCA1, BRCA2, ATM, CHEK2 and TP53
| SNP (MAF in controls) | AA | Aa | aa | Second primary | First primary | ||
|---|---|---|---|---|---|---|---|
| case control | case control | case control | ORdom (P-value) | ORrec (P-value) | ORdom (95% CI) | ORrec (95% CI) | |
| BRCA1 | |||||||
| Q 356 R (5.4%) | 393 | 75 | 4 | 1.72 (0.0002) | 3.00 (0.09) | 1.31 (1.14–1.51) | 1.73 (0.80–3.44) |
| rs1799950 | 2203 | 250 | 7 | ||||
| D 693 N (7.4%) | 402 | 63 | 8 | 1.07 (0.67) | 3.01 (0.017) | 1.03 (0.89–1.19) | 1.73 (1.04–2.68) |
| rs4986850 | 2113 | 336 | 14 | ||||
| S 1140 G (0.04%) | 473 | 0 | 0 | 0.00 | – | – | – |
| rs2227945 | 2460 | 2 | 0 | ||||
| K 1183 R (32.2%) | 216 | 191 | 66 | 1.00 (1.00) | 1.46 (0.014) | 1.00 (0.90–1.11) | 1.21 (1.04–1.40) |
| rs16942 | 1124 | 1093 | 246 | ||||
| S 1613 G (32.3%) | 213 | 193 | 63 | 1.00 (1.00) | 1.37 (0.041) | 1.00 (0.90–1.11) | 1.17 (1.00–1.36) |
| rs1799966 | 1120 | 1093 | 250 | ||||
| BRCA2 | |||||||
| N 289 H (3.1%) | 440 | 33 | 0 | 1.16 (0.47) | – | 1.08 (0.87–1.31) | – |
| rs766173 | 2312 | 147 | 3 | ||||
| N 372 H (27.9%) | 233 | 201 | 39 | 1.11 (0.29) | 1.07 (0.71) | 1.05 (0.95–1.17) | 1.04 (0.85–1.24) |
| rs144848 | 1278 | 993 | 190 | ||||
| T 1915 M (3.5%) | 438 | 34 | 1 | 1.09 (0.62) | 2.61 (0.41) | 1.04 (0.85–1.27) | 1.61 (0.21–7.08) |
| rs4987117 | 2295 | 166 | 2 | ||||
| R 2034 C (0.8%) | 468 | 5 | 0 | 0.68 (0.53) | – | 0.83 (0.46–1.32) | – |
| rs1799954 | 2424 | 38 | 0 | ||||
| S 2835 P (0.02%) | 473 | 0 | 0 | 0.00 | – | – | – |
| rs11571746 | 2461 | 1 | 0 | ||||
| E 2856 A (0.3%) | 470 | 3 | 0 | 1.04 (1.00) | – | 1.02 (0.44–1.92) | – |
| rs11571747 | 2448 | 15 | 0 | ||||
| I 2944 F (0.02%) | 473 | 0 | 0 | 0.00 | – | – | – |
| rs4987047 | 2459 | 1 | 0 | ||||
| K 3326 stop (0.9%) | 462 | 11 | 0 | 1.34 (0.36) | – | 1.16 (0.79–1.63) | – |
| rs11571833 | 2420 | 43 | 0 | ||||
| I 3412 V (0.08%) | 473 | 0 | 0 | 0.00 | – | – | – |
| rs1801426 | 2459 | 4 | 0 | ||||
| ATM | |||||||
| V 182 L (0.04%) | 473 | 0 | 0 | 0.00 | – | – | – |
| rs3218707 | 2460 | 2 | 0 | ||||
| L 546 V (0.02%) | 472 | 1 | 0 | 5.21 (0.30) | – | 2.28 (0.26–20.23) | – |
| rs4987945 | 2461 | 1 | 0 | ||||
| S 707 P (1.3%) | 461 | 12 | 0 | 0.98 (1.00) | – | 0.99 (0.69–1.36) | – |
| rs4986761 | 2399 | 64 | 0 | ||||
| D 814 E (0.0%) | 472 | 1 | 0 | ∞ | – | – | – |
| rs3218695 | 2462 | 0 | 0 | ||||
| F 858 L (1.1%) | 458 | 15 | 0 | 1.52 (0.18) | – | 1.23 (0.89–1.66) | – |
| rs1800056 | 2408 | 49 | 3 | ||||
| P 1054 R (2.4%) | 438 | 34 | 1 | 1.68 (0.015) | 1.30 (0.59) | 1.30 (1.05–1.58) | 1.14 (0.16–3.63) |
| rs1800057 | 2351 | 108 | 4 | ||||
| H 1380 Y (0.06%) | 473 | 0 | 0 | 0.00 | – | – | – |
| rs3092856 | 2460 | 3 | 0 | ||||
| L 1420 F (1.8%) | 453 | 19 | 1 | 1.23 (0.42) | 2.60 (0.41) | 1.11 (0.84–1.43) | 1.61 (0.21–7.08) |
| rs1800058 | 2374 | 83 | 2 | ||||
| D 1853 V (0.5%) | 466 | 7 | 0 | 1.41 (0.47) | – | 1.19 (0.72–1.83) | – |
| rs1801673 | 2437 | 26 | 0 | ||||
| CHEK2 | |||||||
| I 157 T (0.0%) | 469 | 2 | 0 | ∞ (0.026) | – | – | – |
| rs17879961 | 2457 | 0 | 0 | ||||
| TP53 | |||||||
| P 72 R (26.2%) | 257 | 185 | 30 | 1.02 (0.84) | 0.85 (0.44) | 1.01 (0.91–1.12) | 0.92 (0.74–1.13) |
| rs1042522 | 1354 | 925 | 183 | ||||
The first primary OR is the square root of the second primary OR estimate.
ORs for two primary breast cancers corresponding to increasing numbers of variant alleles for 25 SNPs in BRCA1, BRCA2, ATM, CHEK2 and TP53
| No of variant alleles | All SNPs | Uncommon (MAF < 10%) SNPs | ||||||
|---|---|---|---|---|---|---|---|---|
| Controls N (%) | Cases N (%) | OR (95% CI) | Controls N (%) | Cases N (%) | OR (95% CI) | |||
| 0 | 193 (7.91) | 24 (5.15) | 1.00 (Ref) | 1373 (56.27) | 226 (48.50) | 1.00 (Ref) | ||
| 1 | 369 (15.12) | 67 (14.38) | 1.46 (0.89–2.40) | 794 (32.54) | 162 (34.76) | 1.24 (0.99–1.54) | ||
| 2 | 493 (20.20) | 85 (18.24) | 1.39 (0.86–2.25) | 229 (9.39) | 57 (12.23) | 1.51 (1.10–2.09) | ||
| 3 | 516 (21.15) | 112 (24.03) | 1.75 (1.09–2.80) | 35 (1.43) | 19 (4.08) | 2.90 (1.69–4.97) | ||
| 4 | 392 (16.07) | 76 (16.31) | 1.56 (0.95–2.55) | 7 (0.29) | 1 (0.21) | |||
| 5 | 252 (10.33) | 41 (8.80) | 1.31 (0.76–2.24) | 2 (0.08) | 1 (0.21) | |||
| 6 | 140 (5.74) | 32 (6.87) | 1.84 (1.04–3.26) | |||||
| 7 | 65 (2.66) | 17 (3.65) | 2.10 (1.06–4.16) | |||||
| 8 | 16 (0.66) | 8 (1.72) | 4.02 (1.56–10.38) | |||||
| 9+ | 4 (0.16) | 4 (0.86) | 8.04 (1.89–34.26) | |||||
| Total | 2440 (100) | 466 (100) | 1.08 (1.02–1.14) per SNP P(trend) = 0.005 | 2440 (100) | 466 (100) | 1.30 (1.15–1.47) per SNP P(trend) = 0.00004 | ||
There is a highly significant trend with the number of uncommon (MAF < 10%) SNPs carried (Table 2: OR per uncommon SNP = 1.30, 95% CI 1.15–1.47, Ptrend = 0.00004) and the OR for 3 or more uncommon SNPs is 2.90 (95% CI 1.69–4.97 P = 0.0001). The two common (MAF > 10%) variants in BRCA1 (K1183R and S1613G) are in strong linkage disequilibrium (16) so most homozygotes carry at least four variant alleles. The homozygote OR of ∼1.4 for these two BRCA1 SNPs is thus diluted in the trend based on all four common SNPs (OR per common SNP = 1.04, Ptrend = 0.25). Over half (51.5%) of cases carried one or more of the 21 uncommon SNPs (Table 2: OR for one or more uncommon SNPs = 1.37, 95% CI 1.11–1.68 P = 0.002), implying an attributable fraction of cases with two primaries due to these 21 SNPs of 14%, or ∼7% of unselected breast cancers. Table 2 suggests a much higher attributable fraction when common SNPs are included, but the trend is irregular, and only 24 cases carried none.
The marked trend in Table 2 is due almost entirely to uncommon SNPs in BRCA1, BRCA2 and ATM. The only CHEK2 variant analysed (I157T) is too rare to appreciably affect our results, and the single TP53 SNP (P72R) was ‘common’ (MAF 26.3%). Table 3 shows each of the SNPs carried by the 21 cases with three or more uncommon SNPs. No single SNP makes a dominant contribution to the overall trend in Table 2. BRCA1 Q356R (MAF 5.4%) has the highest heterozygote OR and is one of the more common of our ‘uncommon’ (MAF < 10%) SNPs. When this SNP is removed from the trend analysis, the OR per uncommon SNP is still significant (OR per SNP = 1.19, Ptrend = 0.01) and the OR for 3 or more SNPs is slightly increased (OR for 3 or more SNPs = 3.15, P = 0.001). The trend in Table 2 also remains highly significant (Ptrend = 0.0004 or less) when any one of the other 20 uncommon (MAF < 10%) SNPs is removed.
Individual SNPs carried by each of the 21 cases with two primary breast cancers with three or more uncommon (MAF < 10%) SNPs
| No of SNPs | BRCA1 | BRCA2 | ATM | CHEK2 |
|---|---|---|---|---|
| 5 | D693N × 2 | T1915M | F858L, P1054R | |
| 4 | Q356R, D693N | N289H, T1915M | ||
| 3 | D693N | F858L, P1054R | ||
| 3 | D693N | N289H, T1915M | ||
| 3 | Q356R × 2 | L1420F | ||
| 3 | D693N | F858L, P1054R | ||
| 3 | Q356R | T1915M, E2856A | ||
| 3 | Q356R × 2 | L1420F | ||
| 3 | D693N | T1915M | P1054R | |
| 3 | N289H, R2034C | L1420F | ||
| 3 | D693N | R2034C | S707P | |
| 3 | Q356R | T1915M, E2856A | ||
| 3 | Q356R | F858L, P1054R | ||
| 3 | T1915M | F858L, P1054R | ||
| 3 | Q356R | T1915M | S707P | |
| 3 | F858L, P1054R × 2 | |||
| 3 | T1915M × 2 | I157T | ||
| 3 | D693N | N289H | P1054R | |
| 3 | D693N | F858L, P1054R | ||
| 3 | N289H | L1420F × 2 | ||
| 3 | D693N | S707P, P1054R |
DISCUSSION
Our data suggest that many of the low-penetrance ‘polygenes’ that are thought to underlie familial breast cancer are non-synonymous SNPs in known susceptibility genes whose individual effects are too small to be detected even in well powered association studies. The relative risks conferred by rare inactivating mutations are of the order of 10 for BRCA1, BRCA and TP53 and about two for ATM, CHEK2 BRIP1 and PALB2 (2,10–13) but several authors have concluded that polymorphic variants in these genes contribute little, if anything, to the identification of women at substantial risk (11–13). Our relative risk estimate of 2.90 (95% CI 1.69–4.97) for bilateral breast cancer in carriers of three or more uncommon (MAF < 10%) alleles in these genes corresponds to a relative risk of 1.7 for unselected cases. This is slightly lower than the range (2.0–2.4) for carriers of inactivating mutations in CHEK, ATM, BRIP1 and PALB2 (10–13).
The trend statistic in Table 2 based on all 25 SNPs tests the composite hypothesis that functional SNPs in some or all of these five genes act cumulatively to increase the risk of breast cancer. By restricting our analysis to these five genes we have avoided the multiple testing and resulting insensitivity of genome wide analysis of individual variants or haplotypes (i) by counting SNPs only in the five genes in which inactivating mutations are known to contribute to breast cancer susceptibility [two more such genes, BRIP1 and PALB2 have now been identified (12,13), but no SNPs in these were included in our screen]; (ii) by including all genotyped SNPs in these genes and (iii) by observing an effect which is much larger for multiple variants than for individual SNPs. The overall significance level (Ptrend = 0.005) for the total number of SNPs thus constitutes quite strong evidence for a gene-dosage effect. The much more significant (Ptrend = 0.00004) trend for the number of uncommon SNPs (MAF < 10%) constitutes our only subgroup analysis, and is consistent with the evolutionary argument that rarer variants will on average confer larger risks. In contrast to other multigenic studies referenced in (17) we included all genotyped SNPs within each gene and ignored linkage disequilibrium, as our underlying assumption is that each potentially functional SNP in these genes may have some effect.
Our data are compatible with a polygenic model in which individual alleles each of which has a small effect combine either additively or multiplicatively to produce much larger risks in carriers of multiple risk alleles. The multiplicative polygenic model fitted by Pharoah et al. (5) predicts that half of all breast cancers occur in the 12% of women at highest risk. All such women could be identified if all the relevant genes were known, but knowing half of them (and a smaller proportion if those that are commoner or cause higher risks are discovered first) will identify 20% of women accounting for half the cases (5). The lower scale in Figure 1 shows ORs for a first primary, calculated as the square root of the second primary OR (15,18). The OR for a first primary is rarely as high as 1.2 for SNPs with MAF >5%, or 1.4 for SNPs with MAF >1%. In either case, several hundred independent variants would have to be discovered before women at substantial risk could be identified. The OR for two primaries of 1.30 per SNP in Table 2 implies an even lower OR (1.14 per SNP) for a first primary breast cancer (15). Discovering several hundred variants with MAFs of 5% or less conferring such modest ORs could prove impossible if the relevant SNPs were distributed at random throughout the genome. Our study of 473 bilateral breast cancer cases and 2463 controls had equivalent power to a study of more than 3500 unselected breast cancer cases and 3500 controls, but only one of the variants we tested (BRCA1 Q356R) would be considered statistically significant after adjustment for multiple testing for the 25 SNPs in these genes, and none if the 1037 SNPs in the full screen were taken into account.
Our bilateral cases are a genetically enriched series, and of the order of 5% of our cases but only about 0.2% of our controls will be carriers of a high-penetrance BRCA1 or BRCA2 mutation (19–21). Our cases have not been tested for penetrant BRCA mutations, but the trend in OR in Table 2 is unlikely to be due to linkage disequilibrium between penetrant BRCA mutations and these SNPs, as no single high-risk BRCA mutation is common enough in Caucasians for linkage with the minor allele of a SNP to substantially influence our observed trend.
The 59 SNPs with significantly (P < 0.05) increased ORs (Fig. 1) could all be due to chance in this large experiment. Despite this absence of clear non-Bayesian evidence in our data for any individual SNP, our analysis suggests that multiple potentially functional variants in BRCA1, BRCA2 and ATM contribute substantially to breast cancer risk. The observed trend may be largely due to a subset of the SNPs we genotyped, and a suitably weighted sum of all potentially functional variants in these genes should predict individual risk considerably better than our simple summation of these selected SNPs. Variants in BRCA1 are classified as probably neutral or deleterious on the basis of evolutionary conservation, their predicted effects on protein structure and the assumption that deleterious variants in trans confer an embryonic lethal phenotype (22). This approach was not designed to characterize variants that cause risks of 2-fold or less. All five of the SNPs in BRCA1 that we analysed were recently classified as ‘known neutral’ on this basis, and many more remain unclassified (22). Such sequence-based criteria might however be adapted to provide quantitative measures that correlate, albeit imperfectly, with the ORs of less penetrant variants. If so, our crude trend analyses could be refined by multiple regression in larger data sets to estimate coefficients for a small number of parameters such as MAF, Grantham Variation and Grantham Deviation (22) in a variant-specific risk score. These scores would be multiplied by a single coefficient for each gene and added to give a cumulative risk score. The total number of coefficients to be estimated would thus be only slightly greater than the number of genes included in the risk score, irrespective of the number of variants. Only variants conferring ORs too small to be estimated individually need be analysed in this way. Well-characterized variants such as CHEK2*1100delC and high-risk BRCA mutations should be assigned their known ORs. The addition of a further candidate gene by including all its variants in the weighted risk score would be evaluated by a likelihood ratio test on only one degree of freedom.
One common SNP in BRCA2 that we studied (N372H) and one uncommon SNP in ATM (S49C) that was not included in our SNP set have been tested individually in pooled analyses of more than 15 000 cases and 15 000 controls by the Breast Cancer Association Consortium (BCAC) (8,9). The ORs for a first primary were 1.01 (0.98–1.05) per allele for BRCA2 N372H and 1.13 (95% CI 0.99–1.30) per allele for ATM S49C. These estimates are consistent with our observed average ORs of 1.04 (95% CI 0.98–1.10) for common SNPs and 1.30 (95% CI 1.15–1.47) for uncommon SNPs [corresponding to ORs of 1.02 (95% CI 0.99–1.05) and 1.14 (95% CI 1.07–1.21) respectively for a first primary].
Several known SNPs in BRCA1, BRCA2 and ATM and many rare unclassified variants were not examined, and several inactivating mutations in these genes also increase breast cancer risk (11,22). The combined effects of all functional variants in these and a few further candidate genes such as BRIP1 and PALB2 (12–14) may thus account for a substantial fraction of genetic variation. Identification of all variants in candidate genes by sequencing is complementary to whole-genome analysis of common (MAF > 10%) tagging SNPs, which identifies common variants or haplotypes conferring small individual risks but cannot detect the cumulative effect of multiple variants in individual genes. Clinically useful identification of women at high risk is likely to require the combined findings of both approaches. Our observation needs to be confirmed in larger series but if our point estimate of the population attributable fraction of unselected breast cancers (7%) due to this subset of uncommon missense variants is approximately correct, the contribution of missense variants in these and other relevant genes may exceed the combined effects of their inactivating mutations.
MATERIALS AND METHODS
Study population
Cases
Breast cancer cases with two primary breast cancers (416 bilateral cases and 57 asynchronous ipsilateral cases) were ascertained through the English cancer registries. Eligible cases had two sequential or simultaneous primary breast cancer registrations confirmed by interview as separate cancers. All cases had their first breast cancer diagnosed after 1 January 1971 and before age 65. The median age at diagnosis of first primary was 49 year (range 26–65).
Controls
This analysis was part of a collaboration in which cases for three other cancers (colorectal cancer, lung cancer and chronic lymphocytic leukaemia) were analysed by comparison with a common set of controls (23–25). Two thousand four hundred and seventy-five controls who were friends or non-blood relatives of patients with malignancies were recruited through the cases as part of the British Breast Cancer study (n = 367), ongoing National Cancer Research Network genetic epidemiological studies (n = 1075) or the Royal Marsden Hospital Trust/Institute of Cancer Research Family History and DNA Registry (n = 1033). None of the controls had a personal history of malignancy at the time of ascertainment. Cases and controls were recruited between 1 January 1999 and 31 December 2004, and all were Caucasians resident in the UK. Written informed consent was obtained from all participants, and the study was approved by the South East Multicentre Research Ethics Committee.
SNP selection
Full details of the methods for SNP selection have been published elsewhere (26). Briefly, candidate cancer genes were identified by interrogating the Gene Ontology Consortium database (http://www.geneontology.org) (27), Kyoto Encyclopedia of Genes and Genomes database (http://www.genome.jp/kegg) (28), Stratagene's Interaction Explorer Pathway Assist Program (http://www.iobion.com/news/hotnews.html?cmd=Retrieve&dopt=Abstract), National Center for Biotechnology Information (NCBI) Entrez Gene database (http://www.ncbi.nlm.nih.gov/entrez/query.fcgi?CMD=search&DB-gene) (29) and the CancerGene database (http://caroll.vjf.cnrs.fr/cancergene/HOME.html). A total of 9537 validated nsSNPs with MAF data were identified within 21506 LocusLink annotated genes in NCBI dbSNP Build 123 (http://www.ncbi.nlm.nih.gov/SNP/). Filtering this list and linking it to 7080 candidate cancer genes yielded 3666 validated nsSNPs with MAF > 0.01 in Caucasian populations. The functional impact of nsSNPs was predicted using the Grantham matrix (30) and the in-silico computational tools PolyPhen (http://www.bork.embl-heidelberg.de/PolyPhen/) (31) and SIFT (version 2.1; http://blocks.fhcrc.org/sift/SIFT.html) (32). Using the Predicted Impact of Coding SNPs (PICS) database (http://www.icr.ac.uk/cancgen/molgen/MolPopGen_PICS_database.html) and published work on resequencing of DNA repair genes (33–37) we prioritized a set of 1476 nsSNPs for the current study. Full details of the 40 SNPs that were in BRCA1, BRCA2 and ATM are given in Supplementary Material, Table S5 (online). As we had an a priori interest in the IGF axis and the oestrogen synthesis and metabolism pathways, an additional 60 SNPs that lay within 2 kb of the transcriptional startsite of a gene within these pathways were included. These 1536 SNPs lay within or proximal to 1017 candidate cancer genes. For those SNPs yet to be documented in the latest release of NCBI dbSNP (Build 125), we have submitted complete genotype information including MAF to NCBI and assigned the resultant dbSNP ‘ss’ designations accordingly. Annotated flanking sequence information for each SNP was derived from the University of California Santa Cruz (UCSC) Human Genome Browser (Assembly hg17; http://genome.ucsc.edu/cgi-bin/hgGateway).
Genotyping
DNA was extracted from blood samples using conventional methodologies and quantified using PicoGreen (Invitrogen). Genotyping of samples was performed using customized Illumina Sentrix Bead Arrays according to the manufacturer's protocols. DNA samples with GenCall scores <0.25 at any locus were considered ‘no calls’. A DNA sample was deemed to have failed if it generated genotypes at <95% of loci (12 samples). SNPs were excluded if <99% of DNA samples generated a genotype at the locus (290 SNPs).
Statistical methods
Each SNP was tested for departure from Hardy Weinberg equilibrium in each of the control populations and in all controls combined. Of the 1536 selected SNPs, 290 that were genotyped in <99% of samples and a further 200 that showed no variation in these cases or controls were excluded. Nine of the remaining 1046 SNPs showed significant departure from Hardy Weinberg equilibrium (P ≤ 0.001) and were also excluded, leaving 1037 SNPs in the final analysis. Twenty-five of these SNPs (24 missense, one nonsense) were within the five main genes linked to breast cancer susceptibility (3) (5 in BRCA1, 9 in BRCA2, 9 in ATM, 1 in TP53, 1 in CHEK2). Multiple SNP analyses are restricted to the 466 (98.5%) cases and 2440 (99.1%) controls in whom these 25 SNPs were all successfully genotyped. Unadjusted ORs with two-sided exact P-values and likelihood ratio trend tests were calculated using Stata 9 (Stata Corporation, TX, USA).
SUPPLEMENTARY MATERIAL
Supplementary Material is available at HMG Online.
ACKNOWLEDGEMENTS
We thank Amie Deffenbaugh and Lynn Anne Burbidge for queries of Myriad Genetic Laboratories' BRACAnalysis database, and the English cancer registries through whom we ascertained the women with two primary breast cancers. The study was funded by Cancer Research UK and Breakthrough Breast Cancer.
Conflict of Interest statement. The authors declare that there are no competing financial interests or other conflicts of interest.
REFERENCES
Author notes
The authors wish it to be known that, in their opinion, the first two authors should be regarded as joint First Authors.
