


Abstract
To determine whether echocardiographic longitudinal systolic strain (LS) parameters identify short-term improvement following chemotherapy for light-chain (AL) cardiac amyloidosis (CA). Among patients with CA, standard echocardiographic measures are commonly unchanged at 1 year following successful chemotherapy, despite observed reductions in cardiac biomarkers.
We retrospectively identified 61 patients with AL-CA treated with high-dose melphalan or bortezomib-based regimens. Patients were classified by hematologic response at 1 year into two groups: complete response (CR; n = 18, or 30%) or non-CR (non-CR; n = 43, or 70%), and followed for 20 months. Serum free light chains (FLC), B-type natriuretic peptide (BNP), troponin I (TnI), and echocardiography including LS, were acquired at baseline and 1 year. Seven patients died (11.5%), all in the non-CR group (P < 0.01). At 1 year, while reductions were observed in BNP (44% CR, 18% non-CR) and FLC (94% CR, 73% non-CR), both P < 0.05 from baseline, there were no differences in wall thickness, EF, or diastolic function in either group. LS improved only in the CR group with notable improvement in apical to basal strain ratio (P < 0.05). Strain improvement and BNP reduction were correlated (R = 0.6, P < 0.01). Baseline global LS < -10.2% was associated with survival and proved superior to BNP and TnI. The addition of global LS to biomarkers identified the patients at highest risk of mortality.
These data suggest that LS is a sensitive measure of pre-treatment cardiac functional impairment in AL-CA, can predict survival over and above that of cardiac biomarkers, and detect early cardiac functional improvement following chemotherapy.
Introduction
AL cardiac amyloidosis (AL-CA) is an infiltrative cardiomyopathy characterized by deposition of amyloid fibrils composed of abnormally folded immunoglobulin light-chain (LC).1 AL amyloidosis results from a clonal proliferation of bone marrow plasma cells such that chemotherapeutic treatment of AL amyloidosis is drawn from multiple myeloma regimens including the agents bortezomib, lenalidamide and its derivatives, and melphalan.2 High-dose melphalan followed by autologous stem cell transplantation (HDM/SCT) is a desired form of treatment as it affords a rapid reduction in LC and can extend survival to beyond 10 years, but is appropriately administered to selected patients in whom the risk of transplant-related morbidity and mortality is acceptably low.3
Following treatment, hematologic response is determined by serial assessments of serum and urine free light chain (FLC) assay, serum and urine immunofixation electrophoreses, and bone marrow biopsy. Patients are classified as complete hematologic response (CR) if there is complete normalization of LC levels and ratio, absence of a monoclonal protein band on immunofixation electrophoresis, and a bone marrow showing no abnormal plasma cell clonality,4 with determination of hematologic response at 1-year following treatment commonly performed.5 Patients are also assessed routinely by echocardiography and cardiac-specific biomarkers that have a critical role in survival prognostication, treatment selection, and assessment of response to treatment.6 Biomarkers also appear to improve in a manner correlated to subjective symptomatic improvement. For this reason, a 30% reduction in N-terminal (NT)-pro-B-type natriuretic peptide (BNP) at 1 year following treatment has been proposed as the definition of a positive cardiac response.7 While we, and others, have reported that serial assessments of wall thickness and EF do indeed improve in association with maintained CR status, these changes typically require many years (3 or more) to observe, and are rarely, if ever, observed in the short term.7,8
Longitudinal systolic strain (LS) is a powerful and sensitive measure of myocardial deformation that can be reported by cardiac region or global average (GLS).9 LS describes the base to apical LV shortening that occurs with each cardiac cycle. Perhaps counter-intuitively, LS is a negative value and the more negative, the greater the shortening, and hence more normal function. Regional strain analysis has been reported useful for differentiation of amyloid cardiomyopathy from other wall thickening processes,10 while a multi-modal imaging approach incorporating cardiac magnetic resonance and nuclear imaging has been endorsed as a means to confirm amyloid cardiomyopathy.11 Global strain has been reported to predict survival in a cohort of AL amyloidosis patients (cardiac and non-cardiac) and associated with heart failure development.12,13 Importantly, these studies have all used a single, baseline strain measure. Data regarding the serial assessment of longitudinal strain in patients with AL-CA following treatment have not been reported. We therefore hypothesized that longitudinal strain analysis would both associate with survival and permit detection of early cardiac functional improvement that would correlate to biomarker reduction following chemotherapy.
Methods
Study cohort
We retrospectively enrolled 61 patients with AL-CA followed by the Boston University Amyloidosis Center from April 2010 to March 2014 seen as initial evaluation. All patients provided written informed consent for their clinical records to be accessed for research purposes, and the study was conducted with the approval of the Institutional Review Board of Boston University School of Medicine. Diagnosis of CA was made according to International Society of Amyloidosis (ISA) criteria (positive endomyocardial biopsy or interventricular septal thickness ≥12 mm and NT-proBNP ≥332 pg/mL in the absence of hypertension history or other known cardiopathies).4 A complete hematologic evaluation was performed at baseline and after 1 year of follow-up including serum FLC, serum and urine immunofixation electrophoresis and bone marrow biopsy. Similarly, a cardiac evaluation including echocardiography, electrocardiography, BNP, and cardiac troponin I was also performed at baseline and 1 year. Patients with a history of hypertension or aortic valve disease were not included.
Choice of chemotherapeutic approach (HDM/SCT vs. non-HDM/SCT regimen) was determined by standard clinical practice.
At 1 year following treatment, patients were classified into complete hematologic response (CR, n = 18 or 30% defined by ISA criteria), and non-CR (n = 43 or 70%).14 In addition, patients were classified by an adaptation of the Mayo biomarker staging system that we recently reported with cardiac biomarker staging defined by thresholds of BNP >100 pg/mL and troponin I >0.1 ng/mL.15 Stage 1 is defined as both biomarkers below threshold, stage 2 as one biomarker above threshold, and stage 3 with both biomarkers above threshold. Cardiac response was defined as >30% reduction in BNP.15 Patients were observed for a median of 615 days with survival determined by medical record review.
Echocardiography and strain determination
Two-dimensional, color-flow Doppler, and spectral Doppler echocardiographic data were collected in standard fashion from parasternal, apical, and subcostal windows. Two-dimensionally targeted M-mode echocardiography was performed after the parasternal long-axis view had been adjusted to avoid angulation of the ultrasonic beam and consequent changes in LV shape. LV internal dimensions, posterior wall thickness, and interventricular thickness were analyzed by readers blinded to treatment or CR status according to the standards of the American Society of Echocardiography and the European Association of Cardiovascular Imaging.16 LV mass was indexed to body surface area (g/m2), and relative wall thickness was computed as the sum of posterior wall and interventricular septal thickness divided by LV end-diastolic dimension. Pulsed-wave Doppler of mitral inflow and tissue Doppler imaging-derived early diastolic peak velocity at the septal and lateral insertion sites of the mitral leaflets were measured and averaged (e’), as an index of LV relaxation. The E to e’ ratio was calculated as an index of LV filling pressures. Global systolic function was assessed by LVEF according to the biplane disc method (modified Simpson’s).
Longitudinal systolic strain was determined offline by speckle tracking (GE Vivid 7 echo system, GE EchoPAC analysis tool) at the basal, mid, and apical ventricle from apical views. Strain was determined for each cardiac segment and expressed as per segment, per level (basal, mid, or apical) mean, or global (all segments) mean. Strain variables calculated included: GLS (average of all segments), apical to basal ratio (average of apical segments divided by average of basal segments), relative apical sparing (average of apical and mid segments divided by average of basal segments). The strain analysis was performed by one single research reader, blinded to treatment or CR status.
Statistical analysis
Continuous variables were expressed as mean ± SD, and categorical variables as frequencies and percentages. Comparisons of continuous variables were determined by analysis of variance (ANOVA) followed by two-tailed unpaired t-test for continuous variables. Group differences for ordinal variables were tested using the Kruskal–Wallis test or ANOVA and differences between nominal variables were assessed using the χ2 test or Fisher exact test. ROC curves were plotted to determine the optimal sensitivity and specificity of longitudinal strain for survival. Survival curves were plotted according to Kaplan–Meier, and differences in survival were tested for significance by the log-rank test. Pearson correlation coefficient tests were used to determine correlations between continuous variables. Differences were considered statistically significant at P < 0.05. All analyses were performed using MedCalc version 12.1.4.0.
Results
Baseline demographics and general characteristics stratified by hematologic response
When segregated into hematologic response groups, no significant differences among baseline variables were identified between CR and non-CR in body surface area, cardiac troponin I, BNP, creatinine, or maximal FLC concentration (all P > 0.05, Table 1). There was a higher prevalence of isolated cardiac involvement in non-CR (25.5% vs. 5.0%, P < 0.05), and therefore, multi-organ involvement was more prevalent among patients who ultimately attained CR at 1 year. There were no differences in chemotherapeutic regimens chosen with the majority of patients receiving HDM/SCT (83% of CR, 72% of non-CR).
Baseline characteristics stratified by hematologic response at 1 year
| Parameter | Hematologic response at 1 year | |
|---|---|---|
| CR (n = 18) | Non-CR (n = 43) | |
| B-type natriuretic peptide, pg/mL | 428.6 ± 373.9 | 425.8 ± 448.9 |
| Age (years) | 55.3 ± 7.8 | 59 ± 9.5 |
| Female (%) | 61 | 46.5 |
| Race (B/H/W/O) | 2/3/9/4 | 7/0/32/4 |
| Body surface area (m2) | 1.76 ± 0.19 | 1.88 ± 0.23 |
| Maximum FLC level (mg/L) | 288.2 ± 772.2 | 274.2 ± 435.7 |
| Troponin I (ng/mL) | 0.07 ± 0.07 | 0.11 ± 0.16 |
| Creatinine (mg/dL) | 1.02 ± 0.38 | 0.99 ± 0.31 |
| Isolated heart involvement, n (%) | 1 (5) | 11 (25.5)* |
| Multi-organ involvement, n (%) | 17 (95) | 32 (74.5) |
| Melphalan + stem cell transplantation, n (%) | 15 (83.3) | 31(72.1) |
| Other hematologic treatment, n (%) | 3 (16.7) | 12 (27.9) |
| Dead/alive | 0/18 | 9/34* |
P < 0.05 CR group vs. non-CR group
Echocardiographic measures at baseline and 1-year stratified by hematologic response
Baseline and 1-year follow-up echocardiographic measurements can be found in Table 2, demonstrating similarity at baseline between the two treatment response groups. At baseline, no differences were observed in wall thickness, LV mass, mid-wall fractional shortening, transmitral E/A ratio, or septal and lateral E/e’ ratios (all P > 0.05). At 1 year, there were no differences in standard echocardiographic measures between the groups in respect to wall thickness, LV mass, mid-wall fractional shortening, transmitral E/A ratio, or septal and lateral E/e’ ratios (all P > 0.05), while the direction of observed change between baseline and 1-year measures demonstrated improvement in the CR group.
Echocardiographic variables and biomarkers stratified by hematologic response at 1 year
| Parameter | CR (n = 18) | Non-CR (n = 43) | ||
|---|---|---|---|---|
| Baseline | 1 year | Baseline | 1 year | |
| Septal wall, mm | 12.8 ± 2.8 | 12.1 ± 2.6 | 13.2 ± 2.6 | 13.2 ± 2.7 |
| Posterior wall, mm | 13 ± 3.1 | 12.1 ± 2.5 | 12.9 ± 2.3 | 13.1 ± 2.5 |
| Mass index, g/m2 | 107 ± 39.4 | 92.4 ± 27.7 | 107.5 ± 33.1 | 116.5 ± 38.4 |
| LVEF, % | 56.5 ± 8.5 | 59.2 ± 6.1 | 58.1 ± 9 | 56.2 ± 9.7 |
| Mid-wall fractional shortening, % | 10.3 ± 4.9 | 12.2 ± 4 | 11 ± 3.7 | 11.2 ± 3.3 |
| E/A | 1.35 ± 0.6 | 1.43 ± 0.9 | 1.8 ± 1.8 | 1.6 ± 1 |
| Mean e’, cm/s | 6 ± 1.5 | 6.8 ± 1.8 | 6.2 ± 2 | 5.8 ± 1.8 |
| Septal E/e’ | 17.4 ± 6.7 | 14.6 ± 5.3 | 17.6 ± 7.2 | 18.6 ± 7.8 |
| Lateral E/e’ | 16.4 ± 6.9 | 12.3 ± 4.7 | 17.1 ± 10.3 | 15.5 ± 7.6 |
| Global longitudinal strain, % | −13.2 ± 4.1 | −13.5 ± 4.2 | −13.2 ± 4.3 | −13.4 ± 5.1 |
| Basal segments longitudinal strain, % | −9.1± 5.8 | −12.4 ± 4.7 | −9.8 ± 5.7 | −9.9 ± 7 |
| Medial segments longitudinal strain, % | −13 ± 5.2 | −13.7 ± 4.4 | −12.3 ± 5 | −12.3 ± 5.8 |
| Apical segments longitudinal strain, % | −19.3 ± 5 | −17 ± 4.8 | −17.8 ± 5.5 | −17.2 ± 5.8 |
| Apical/basal ratio | 2.4 ± 1.5 | 1.44 ± 0.6* | 2.15 ± 1.5 | 2.5 ± 1.3 |
| Relative apical sparing | 1.01 ± 0.6 | 0.66 ± 0.26* | 0.9 ± 0.54 | 0.92 ± 0.3 |
| B-type natriuretic peptide, pg/mL | 428.6 ± 373.9 | 240.2 ± 323.5* | 425.8± 448.9 | 348.7 ± 503.5* |
| Troponin I, ng/mL | 0.07 ± 0.07 | 0.04 ± 0.06 | 0.11 ± 0.16 | 0.078 ± 0.14 |
| Maximum FLC level, mg/L | 288.2 ± 772.2 | 17.7 ± 8.6* | 274.2 ± 435.7 | 70.6 ± 74.7* |
P < 0.05 baseline vs. 1 year
At baseline, LS values were also similar between the two hematologic response groups (all P > 0.05). Ratios of regional strain demonstrated the predicted increase in apical relative to basal strain (2.4 ± 1.5 in CR, 2.12 ± 1.5 in non-CR, P > 0.05) and relative apical sparing (1.01 ± 0.6 CR vs. 0.9 ± 0.54 non-CR, P > 0.05) as illustrated by the case example in Figure 1 that appeared similar between the two treatment response groups at baseline. Baseline GLS and BNP were positively associated such that higher BNP was associated with more positive (and thus more abnormal) GLS (R = 0.396, P = 0.01).
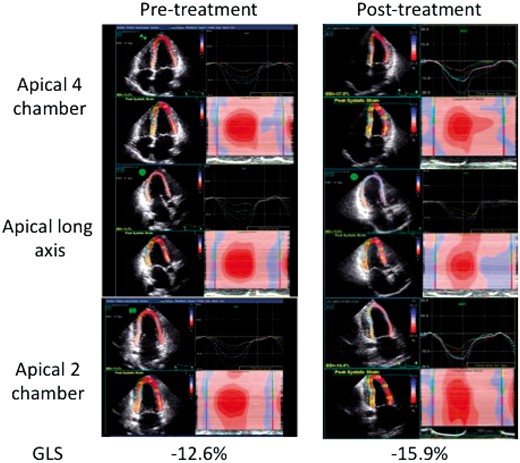
Longitudinal systolic strain by speckle tracking in a typical patient with cardiac amyloidosis prior to and following chemotherapy is illustrated in the apical four-chamber (upper panel), apical long-axis (middle panel), and apical two-chamber (lower panel) views. Note the separation of strain curves with higher (more negative) strain in the apical vs. basal segments as well as the prominent red color indicating higher (more negative) strains in the apical segments on the 2D, and reconstruction maps.
At 1 year, regional LS measurements also did not change significantly between groups, while a trend was observed toward improvement in basal strain in CR only (CR: −9.1 ± 5.8 to -12.4 ± 4.7 vs. non-CR: -9.8 ± 5.7 to -9.9 ± 7, P = 0.13). This change resulted in improved apical to basal strain ratio (CR: 2.4 ± 1.5 to 1.44 ± 0.6, P = 0.04 vs. non-CR: 2.15 ± 1.5 to 2.5 ± 1.3, P > 0.05) and relative apical sparing (CR: 1.01 ± 0.6 to 0.66 ± 0.26, P < 0.03 vs. non-CR: 0.9 ± 0.54 to 0.92 ± 0.3, P > 0.05).
Cardiac-specific biomarkers and FLC improve in both CR and non-CR
As noted in Table 2, values for BNP, troponin I, and maximal FLC were similar at baseline between the groups. At 1 year, significant reductions in BNP (44% for CR and 18% for non-CR, both P < 0.05) were observed with the magnitude of BNP reduction significantly greater in the CR group (P < 0.05) consistent with a positive cardiac response. An identical pattern was observed for FLC reduction from baseline (93%, P < 0.0001 for CR vs. 74%, P = 0.03 for non-CR) with a more significant reduction noted in the CR group. Interestingly, no significant differences were observed in troponin I reduction in either group.
Figure 2A illustrates the segregation of patients into baseline biomarker staging groups, stratified by hematologic response at 1 year. While the majority of patients were in stage 2 upon recruitment (4 patients in stage I, 38 in stage II, and 13 in stage III), no significant differences were seen in attainment of complete hematologic response as determined by baseline stage (Figure 2A). When GLS was added to the biomarker staging system, a fourth group was created (abnormal in BNP, troponin, and GLS) that was comprised entirely of patients (n = 6) who did not attain CR. This finding suggests that those with the most significant cardiac impairment (elevated biomarkers and abnormal strain) were the least likely to attain CR, despite the documented similarity in treatment received.
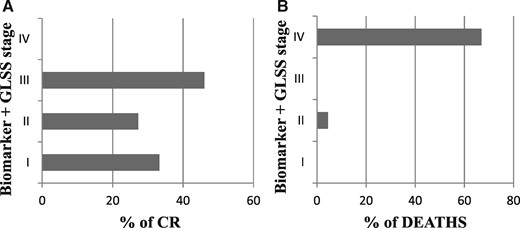
(A) Hematologic response status at 1 year as stratified by biomarker stage with addition of GLS is illustrated demonstrating that stage 4 patients were the least likely to attain CR. (B) Survival over the observation period as stratified by biomarker stage with addition of GLS is illustrated demonstrating that stage 4 patients experienced the highest mortality.
Survival analysis
After a median observation period of 615 days (20 months), 7 (11.5%) patients died, all in the non-CR group. All deaths occurred after 1 year. Table 3 illustrates baseline measurements for survivors (n = 52) and non-survivors (n = 7). Higher levels of BNP (P < 0.05), troponin (P < 0.05), and FLC (P < 0.05) were noted at baseline among non-survivors. Among echocardiographic parameters, only baseline GLS (P < 0.05), mean e’ (P < 0.05), and transmitral E/A ratio (P < 0.05) were significantly different among survivors and non-survivors.
Baseline characteristics stratified by survival status
| Parameter | Baseline evaluation | |
|---|---|---|
| Non-survivor (n = 7) | Survivor (n = 52) | |
| Age (years) | 62.5 ± 11 | 57.3 ± 8.7 |
| Female (%) | 44.4 | 51.9 |
| Isolated heart involvement, n (%) | 3 (43) | 8 (15.4) |
| Multi-organ involvement, n (%) | 4 (57) | 44 (84.6) |
| BNP (pg/mL) | 808.4 ± 768.6 | 360.6 ± 299.6* |
| Troponin (ng/mL) | 0.261 ± 0.3 | 0.07 ± 0.06* |
| Maximum FLC (mg/L) | 362.4 ± 287.9 | 265.6 ± 582* |
| Septal wall (mm) | 13.7 ± 2.9 | 13 ± 2.6 |
| Posterior wall (mm) | 13.9 ± 2.5 | 12.8 ± 2.5 |
| Mass Index (g/m2) | 100.1 ± 27.2 | 108.6 ± 36 |
| LVEF (%) | 53.3 ± 8.8 | 58.4 ± 8.7 |
| Mid-wall fractional shortening (%) | 9.2 ± 3.4 | 11 ± 4.1 |
| E/A | 3.37 ± 3.5 | 1.36 ± 0.65* |
| Mean e’ (cm/s) | 4.5 ± 1.6 | 6.4 ± 1.8* |
| SEPTAL E/e’ | 20.1 ± 8.5 | 17.1 ± 6.7 |
| LATERAL E/e’ | 19.8 ± 9.9 | 16.4 ± 9.3 |
| Global longitudinal strain (%) | −10.7 ± 3.6 | −13.6 ± 4.3* |
| Basal segments longitudinal strain (%) | −6.1 ± 5.6 | −10.2 ± 5.6 |
| Medial segments longitudinal strain (%) | −9.4 ± 4.2 | −13 ± 5 |
| Apical segments longitudinal strain (%) | −14.8 ± 4.4 | −18.7 ± 5.3 |
| Apical/basal ratio | 2.14 ± 0.9 | 2.24 ± 1.5 |
| Relative apical sparing | 1.37 ± 0.9 | 0.86 ± 0.45 |
P < 0.05 vs. non-survivor
Univariate log-rank analysis demonstrated that CR status at 1 year, BNP, troponin I, and baseline GLS were all independently associated with survival (all P < 0.01). As shown in Figure 3, a GLS < -10.2% was associated with a 90% likelihood of survival over the observation period. When survival was analyzed according to biomarker stage + GLS >-10.2%, a subgroup was identified with abnormalities in biomarker and strain parameters (stage 4) that numbered six patients, four of whom died during follow-up (Figures 2B and 4). Of the total number of patients who died during follow-up (n = 7), four (57%) were in stage 4 at 1 year.
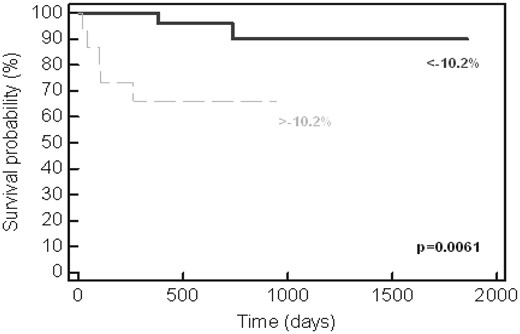
Kaplan–Meier representation of survival as stratified by GLS. Patients with baseline strain lower (more positive) than -10.2% had a significant reduction in survival (P = 0.0061).
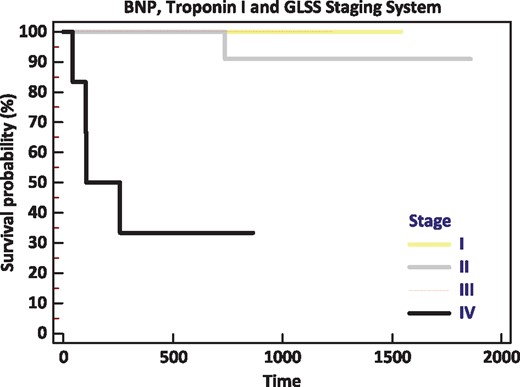
Kaplan–Meier representation of survival as stratified by biomarker/GLS staging system. Note that baseline stage 1, 2 and 3 patients had excellent overall survival, while survival diminished significantly with addition of GLS > -10.2%.
ROC analyses were performed to determine the optimal thresholds that associated with survival (Table 4) for cardiac biomarkers and strain. A baseline GLS of > - 10.2% proved superior to both BNP and troponin I based upon area under the curve (AUC 0.80) with a sensitivity of 80% and specificity of 82% to predict survival, irrespective of hematologic response status (Figure 5). GLS proved similar to restrictive filling as defined by an E/A ratio > 2.6 in this cohort for association with survival (AUC 0.8, Table 4).
ROC thresholds for survival
| Parameter | Threshold | Sensitivity | Specificity | AUC |
|---|---|---|---|---|
| BNP | > 683 pg/mL | 40% | 85% | 0.50 |
| Troponin I | > 0.157 ng/mL | 57% | 92% | 0.66 |
| GLS | > - 10.2% | 80% | 82% | 0.80 |
| E/A | >2.6 | 50% | 90% | 0.80 |
| Parameter | Threshold | Sensitivity | Specificity | AUC |
|---|---|---|---|---|
| BNP | > 683 pg/mL | 40% | 85% | 0.50 |
| Troponin I | > 0.157 ng/mL | 57% | 92% | 0.66 |
| GLS | > - 10.2% | 80% | 82% | 0.80 |
| E/A | >2.6 | 50% | 90% | 0.80 |
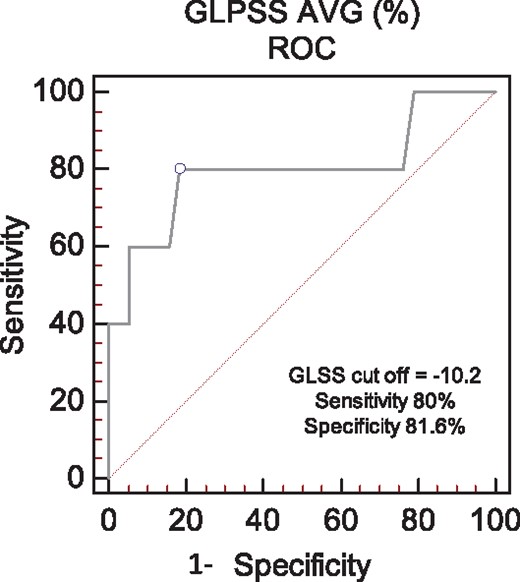
ROC analysis of GLS for the prediction of survival in the entire cohort. The optimal sensitivity and specificity was identified at a threshold of -10.2%, AUC = 0.8.
Discussion
This study of patients with AL-CA demonstrates the clinical utility of longitudinal strain to predict survival in comparison to conventional cardiac biomarkers, as well as identify subtle improvements in cardiac function that associate with changes in cardiac biomarkers. Importantly, improvement in strain, as manifest by normalization of the apical to basal strain ratio, occurred in the absence of significant changes in other conventionally measured echocardiographic parameters such as wall thickness, diastolic function, and EF. To our knowledge, this is the first report of serial measurements of longitudinal strain in patients with AL-CA, and the first to demonstrate the interaction between strain, serum cardiac biomarkers, and hematologic response status. Our findings confirm other published reports of longitudinal strain to predict survival in cohorts of patients with AL amyloidosis and contribute novel observations that may explain observed symptomatic and biomarker improvement following chemotherapy. Our study is also distinct from prior publications in that our entire cohort consisted of patients with defined cardiac involvement (rather than a cohort of patients AL amyloidosis and variable cardiac involvement), and in this cohort we demonstrate the utility of strain over and above biomarkers for prognosis.
Early application of longitudinal strain in AL-CA was derived from pulsed Doppler or color Doppler maps.17 These studies demonstrated the capacity of longitudinal strain to identify cardiac involvement in systemic AL amyloidosis, as well as predict the likelihood of heart failure development. Further work demonstrated that patients with AL-CA, in particular, had impaired basal longitudinal strain, relative to other cardiac segments, and that abnormal basal strain associated with clinical features of advance amyloid heart disease and reduced survival.12
The largest contemporary examination of 2D speckle tracking strain in AL-CA was recently reported by Quarta et al.,18 wherein strain in the longitudinal, circumferential, and radial orientations was described in AL, wild-type transthyretin (TTR), and variant TTR CA. In this report, patients with AL-CA had a GLS of -12 ± 4% with an apical/basal ratio of 2.4, similar to our findings.
Our analysis and conclusions are similar to the report of Buss et al.,13 who demonstrated that GLS was associated with survival and lower cardiac biomarkers, and provided incrementally important survival information among patients with AL amyloidosis. Our study is distinct from this important report in a number of ways. First, the prior report consisted of patients with systemic AL amyloidosis and unknown cardiac involvement, while our patients all had known CA and therefore comprised a more uniform, and distinct, cohort. In this way, our findings were not mitigated by patients without CA who would skew biomarkers and strain results more towards normal. Second, we analyzed anti-plasma cell treatment response so as to account for changes in FLC when interpreting survival and cardiac recovery. Consideration of hematologic response status is critical as CR status is key predictor of survival. Third, we utilized contemporary speckle-tracking rather than tissue Doppler techniques. Fourth, we describe the first reports of serial assessment of LS.
We observed improvement in basal strain that resulted in normalization of the apical to basal strain ratio among patients with CR only, while GLS did not change significantly. Apical to basal strain ratio improvement was observed without significant changes in apical strain, while modest apical strain reduction was observed, as well as a trend toward improvement in basal strain. However, the absolute magnitude of apical strain change was less than that of basal strain change, and thus we feel confident that the primary driver of the reduction in ratio was the change in basal strain. Furthermore, it also is counter-intuitive that apical strain would worsen in the CR group (while predicted that basal strain would improve), and thus the observed difference in apical strain more likely reflects variation in measurement rather than a true change. Basal strain impairment, relative to apical strain preservation, has been widely reported in AL-CA and serves as a useful discriminator between AL-CA and other wall thickening processes, such as hypertensive remodeling and hypertrophic cardiomyopathy.10 It is not surprising that improvement in basal strain parameters and apical/basal strain ratio would be among the first observed. It is possible that improvement in basal relative to apical function increased net cardiac systolic efficiency, and thereby effecting BNP reduction. Apical–basal ratio and relative apical sparing are different ways of looking at the same pattern and both improved significantly, thereby strengthening our conclusions. The modest and non-significant improvements observed among CR patients in respect to global measures of systolic performance (LVEF improvement of 2.7%, mid-wall fractional shortening improvement 1.9%) support this hypothesis.
CA is a disease that carries significant morbidity and mortality but manifests as a spectrum. An important feature of our data set is that >75% of our patients were eligible for and underwent HDM/SCT, suggesting that among all patients with CA, the study population reflects a less clinically impaired phenotype. Our hematologic response rate was similar to that reported by the Mayo clinic in a large series of HDM/SCT in CA (CR rate 30%).7
We and others have reported that conventional echocardiographic measures of cardiac structure and function have been shown to improve following successful treatment of the plasma cell dyscrasia in AL amyloidosis, but these changes are only evident after 4–5 years.7,8 Patients who achieve sustained CR can be expected, on average, to show modest increases in LVEF (+4%) and reduction in septal wall thickness (-2 mm).7 These changes are typically not evident earlier in follow-up, despite observed improvement in clinical symptoms and reduction in biomarkers that typically accompanies the complete hematologic response. Our results support this observation and underscore that functional improvement detected by sensitive strain measures presages morphologic changes that can ultimately be seen in sustained CR. It is plausible that FLC reduction induced by chemotherapy reduced myocardial toxicity and permitted improved contractility as determined by longitudinal strain, as has been observed in animal models of AL-CA.19 It is intriguing that both CR and non-CR experienced significant reduction in FLC and BNP, while improvement in strain was seen only in CR.
Our study has a number of limitations. First, this is a retrospective study and therefore could have been subject to selection bias. Second, the cohort involves relatively small numbers (with few patient deaths) that reduced statistical power to detect regional variations in longitudinal strain, only in ratios. With a larger cohort, and longer analysis period, we predict that average basal regional strain will likely vary significantly between treatment response groups. Third, we analyzed serum levels of BNP rather NT-pro-BNP, and troponin I rather T. While this may limit immediate cross-cohort comparisons, we have utilized validated scoring systems that categorically are generalizable to other populations. Finally, given the variation in strain analysis platforms, our specific cut-point for GLS and survival (<-10.2%) should be considered in context, while serial measurements using the same methods showing strain improvement should apply across platforms.
In conclusion, we report that baseline GLS confers important information regarding survival in AL-CA over and above that of cardiac specific biomarkers, and that serial measurements of LS identify cardiac functional improvement without demonstrable changes in standard echocardiographic morphological and functional parameters among patients who achieve CR at 1 year. These findings afford insight into biomarker reduction and symptom improvement following successful chemotherapy for AL-CA and suggest that serial assessment of LS can add substantively to the clinical management of CA.
Conflict of interest: None declared.
Funding
Supported by the American Heart Association SDG2550011 and Amyloidosis Foundation Junior Research Award (to FLR).
