


Abstract
The emergence of coronavirus disease 2019 (COVID-19) is a major healthcare threat. The current method of detection involves a quantitative polymerase chain reaction (qPCR)–based technique, which identifies the viral nucleic acids when present in sufficient quantity. False-negative results can be achieved and failure to quarantine the infected patient would be a major setback in containing the viral transmission. We aim to describe the time kinetics of various antibodies produced against the 2019 novel coronavirus (SARS-CoV-2) and evaluate the potential of antibody testing to diagnose COVID-19.
The host humoral response against SARS-CoV-2, including IgA, IgM, and IgG response, was examined by using an ELISA-based assay on the recombinant viral nucleocapsid protein. 208 plasma samples were collected from 82 confirmed and 58 probable cases (qPCR negative but with typical manifestation). The diagnostic value of IgM was evaluated in this cohort.
The median duration of IgM and IgA antibody detection was 5 (IQR, 3–6) days, while IgG was detected 14 (IQR, 10–18) days after symptom onset, with a positive rate of 85.4%, 92.7%, and 77.9%, respectively. In confirmed and probable cases, the positive rates of IgM antibodies were 75.6% and 93.1%, respectively. The detection efficiency by IgM ELISA is higher than that of qPCR after 5.5 days of symptom onset. The positive detection rate is significantly increased (98.6%) when combining IgM ELISA assay with PCR for each patient compared with a single qPCR test (51.9%).
The humoral response to SARS-CoV-2 can aid in the diagnosis of COVID-19, including subclinical cases.
A novel coronavirus severe acute respiratory syndrome coronavirus 2 (SARS-CoV-2) causing coronavirus disease in 2019 (COVID-19) emerged as a major pandemic [1, 2]. With more than 110 000 confirmed cases and over 4000 deaths as of 11 March 2020, this pandemic surpassed the severe acute respiratory syndrome coronavirus (SARS-CoV) of 2003 [3].
Coronaviruses are frequent causes of respiratory infections in which 6 major species are known to cause human infections besides the SARS-CoV-2. These species include the highly pathogenic SARS-CoV and Middle East respiratory syndrome coronavirus (MERS-CoV), along with less virulent species that include NL63, 229E, OC43, and HKU1 [4]. The epidemiology, etiology, and clinical characteristics of COVID-19 have recently been described in detail [5–11]. The current methods of diagnosis of COVID-19 includes detection of the virus by genomic techniques using either polymerase chain reaction (PCR)–based methods or deep sequencing [7, 12, 13]. However, these detection methods heavily rely on the presence of the viral genome in sufficient amounts at the site of sample collection that can be amplified. Missing the time window of viral replication can provide false-negative results. Similarly, an incorrect sample collection can limit the usefulness of the quantitative PCR (qPCR)–based assay. A false-negative diagnosis can have grave consequences, especially at this stage of the pandemic, by allowing infected patients to spread the infection and hampering the efforts to contain the spread of the virus [14]. In such conditions, additional screening methods that can detect the presence of infection despite lower viral titers can be highly beneficial to ensure timely diagnosis of all infected patients. Detection of the production of antibodies, especially immunoglobulin (Ig) M, which are produced rapidly after the infection, can be a tool that can be combined with PCR to enhance detection sensitivity and accuracy.
However, currently, the extent and the time kinetics of the humoral response against SARS-CoV-2 are not known. In this study, we demonstrate the time kinetics of the antibody response to SARS-CoV-2 in infected patients. We further demonstrate that combining the antibody testing with qPCR can significantly improve the diagnosis of COVID-19.
METHODS
Expression and Purification of SARS-CoV-2 Nucleocapsid Proteins
The full-length nucleocapsid (N) genes of SARS-CoV-2 were amplified from a bronchoalveolar lavage fluid (BALF) specimen of a patient infected with SARS-CoV-2 and cloned into prokaryotic expression vector pET30a (+) (Novagen, San Diego, CA, USA). The resultant plasmids were transformed into Escherichia coli BL21 (DE3) to express the recombinant N proteins (rNPs) according to the manufacturer’s protocol. The 6X histidine-tagged proteins were then purified by using HiTrap SP FF and HisTrap HP columns (GE Healthcare, Waukesha, WI, USA) to greater than 90% purity. The identity of the purified protein was confirmed by Western blot analysis using an anti-6X histidine monoclonal antibody (Sigma, St Louis, MO, USA). The rNPs of human CoV-229E, -NL63, -OC43, -HKU1, SARS-CoV, and MERS-CoV were expressed and purified as described previously [15].
Patients and Plasma Specimens
In this study, a total of 208 blood samples were collected from 2 cohorts. In the first cohort, we recruited a total of 101 inpatients from Wuhan hospitals during the early phase of the pandemic in January 2020. Paired throat swab and blood samples were taken from each patient. Among them, 43 (20 severe and 23 mild to moderate) were confirmed virus positive (referred as “confirmed cases” [CCs]) by deep sequencing or a qPCR assay with a detection limit of 1 copy/μL, as previously reported [1, 2], while 58 cases (5 severe and 53 mild to moderate) suspected to be infected with SARS-CoV-2 based on clinical manifestation, chest radiography imaging, and epidemiology but no virus were detected by deep sequencing or a qPCR assay (referred as “probable cases” [PCs]). A total of 69 blood samples were taken from the 43 CCs (2 serial samples from 26 patients with a 4-day interval and 1 sample from the remaining 17 patients), while 100 plasma samples were collected from 58 PCs (2 blood samples from 42 PCs and 1 single blood sample from 16 PCs). The second cohort included a total of 39 hospitalized CCs recruited from Beijing hospitals (8 severe and 31 mild to moderate cases), with 1 blood sample provided from each patient. All of the blood samples were taken between 1 and 39 days of the disease onset. In addition, a family cluster including 6 individuals over 3 generations was enrolled to validate our detection method.
Another 135 plasma samples collected in 2018 from adult patients with acute lower respiratory tract infections (ALRTIs) and 150 plasma samples obtained from healthy adults in 2018–2019 during regular health check-ups in Wuhan city were used as controls. The plasma samples positive for human CoV-229E, -NL63, -OC43, -HKU1, and SARS-CoV were obtained as previously reported [15].
Western Blot Analysis
Purified rNPs of human CoV-229E, -NL63, -OC43, -HKU1, and SARS-CoV were separated by 12% sodium dodecyl sulfate polyacrylamide gel electrophoresis (SDS-PAGE) gels and transferred to a nitrocellulose membrane (Pall, Port Washington, NY, USA). Human plasma samples positive for these coronaviruses were applied to detect cross-reactivity between these N proteins and antibodies. Goat antihuman IRDye Fluor 800-labeled IgG secondary antibody was used at a dilution of 10 000 (Li-Cor, Lincoln, NE, USA). The membranes were scanned by using the Odyssey Infrared Imaging System (Li-Cor).
Enzyme-linked Immunosorbent Assay
We developed an indirect enzyme-linked immunosorbent assay (ELISA) protocol for detecting IgM, IgA, and IgG antibodies against SARS-CoV-2 using purified rNPs as coating antigens. The ELISA protocol was developed as previously reported [16]. The concentration of the coated rNPs and plasma dilutions for this ELISA were optimized using chessboard titration tests. To determine the cutoff values for the ELISAs, we determined the mean values and SDs of plasma from healthy individuals. The optimal coating concentration of antigen and optimal plasma dilutions were 0.1 μg/mL and 1:200, respectively. The cutoff values were determined by calculating the mean absorbance at 450 nm (A450) of the negative sera plus 3-fold the SD values, which were 0.13, 0.1, and 0.30 for IgM, IgA, and IgG, respectively.
Phylogenetic Analysis
The viral nucleocapsid gene sequences were aligned using the ClustalW program using MEGA software (version 7.0.14). Phylogenetic trees were constructed by means of neighbor-joining methods with the use of MEGA software (version 7). The viral full-genome sequences were deposited in GISAISD (no. EPI_ISL_402123) and the Genome Warehouse in the National Genomics Data Center, Beijing Institute of Genomics (BIG), Chinese Academy of Sciences (accessible at https://bigd.big.ac.cn/gwh).
Ethics Approval
This study was approved by the Ethical Review Board of Institute of Pathogen Biology, Chinese Academy of Medical Sciences and Peking Union Medical College. Written informed consent was waived in the light of this emerging infectious disease of high clinical relevance. For healthy volunteers and patients suffering from common respiratory infections, written informed consent was obtained from each person before enrollment.
Statistical Analysis
Plasma antibody titers are expressed as geometric mean titers (GMTs) and compared using the Student’s t test by using the SPSS software program version 19.0. We used a nonlinear regression (third-order polynomial) model to fit the positive rate of andibodies. P < .05 was considered to be statistically significant.
RESULTS
Cross-reactivity Between SARS-CoV-2 and Other Human Coronaviruses
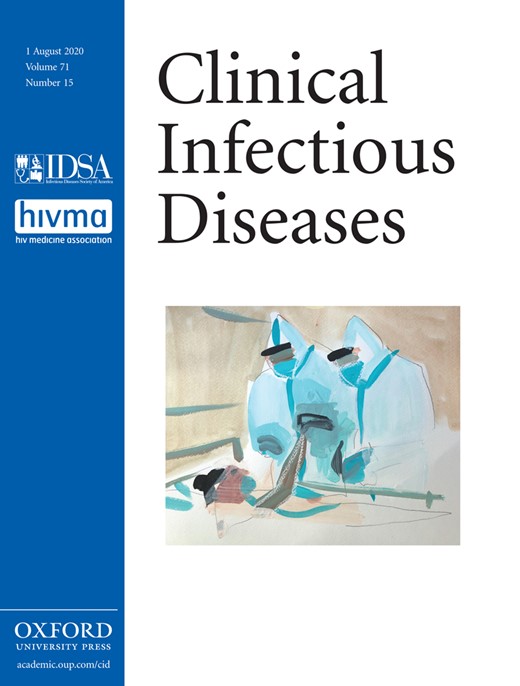
To evaluate the potential cross-reactivities of N proteins between SARS-CoV-2 and other human coronaviruses, we examined the reactivities of the SARS-CoV-2 rNP and human plasma with positive antibodies against NL63, 229E, OC43, HKU1, and SARS-CoV, respectively, by using Western blot and ELISA assays.
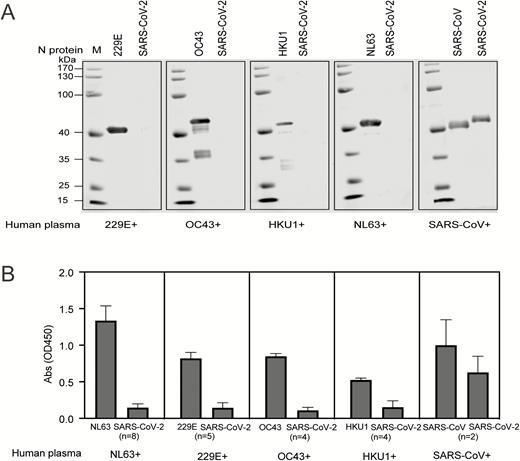
Western blot analysis showed that there was no cross-reactivity of SARS-CoV-2 rNP with human plasma positive for IgG antibodies against NL63, 229E, OC43, and HKU1. However, a strong cross-reactivity was observed between SARS-CoV–positive human plasma and SARS-CoV-2 rNP, and specific bands of 45 kD in size were observed (Figure 1A). The cross-reactivities were also confirmed by using ELISAs where SARS-CoV–positive human plasma presented high A450 with SARS-CoV-2 rNP (Figure 1B). These results indicate cross-reactivity of antibodies to N proteins between the SARS-CoV and SARS-CoV-2. Pairwise analysis showed the SARS-CoV-2 nucleocapsid gene had 46.1%, 27.6%, 26.5%, 20.0%, and 19.1%, amino acid (aa) sequence homology with MERS-CoV, HKU1, OC43, NL63, and 229E, respectively. Interestingly, 90.5% aa sequence homology was observed with SARS-CoV, which may explain the cross-reactivity between the 2 viruses (Figure 2).
Cross-reactivity between human plasma against NL63, 229E, OC43, and HKU1 with the N protein of Severe Acute Respiratory Syndrome Coronavirus 2 (SARS-CoV-2). A, Western blot analysis to determine the reactivity of human plasma containing antibodies against NL63, 229E, OC43, and HKU1. Plasma samples were diluted at 1:400 and incubated with the N protein of NL63, 229E, OC43 HKU1, and SARS-CoV, which was loaded at 250 ng/well. The N protein of SARS-CoV-2 was also loaded in each gel to determine the cross-reactivity. B, ELISA showing the reactivity of human plasma against NL63, 229E, OC43, HKU1, and SARS-CoV. Plasma samples were diluted at 1:400 to test the cross-reactivity against the N protein of SARS-CoV-2. The coating amount of N proteins was 10 ng/well. The absorbance (OD) values at 450 nm are shown on the y axis. Abbreviations: Abs, absorbance; ELISA, enzyme-linked immunosorbent assay; OD, optical density; SARS-CoV-2, Severe Acute Respiratory Syndrome Coronavirus 2.
Characteristics of SARS-CoV-2 nucleocapsid gene. A, Phylogenetic analysis of the viral nucleocapsid gene. The SARS-CoV-2 is labeled in red in the phylogenetic trees. Other human coronaviruses from a public database are listed as an outgroup. Evolutionary distances were calculated with the neighbor-joining method. B, Amino acid sequence comparison of the nucleocapsid gene of SARS-CoV-2, IPBCAMS-WH-01/2019 (EPI_ISL_402123), compared with SARS-CoV (NC004718).
Characteristics of Plasma Antibodies in Patients Infected With SARS-CoV-2
First, we examined the specificity of the ELISA by using 135 plasma samples from patients with ALRTIs and 150 healthy individuals whose samples were collected in 2018–2019 in Wuhan city. No anti–SARS-CoV-2 IgM, IgA, and IgG antibodies were detected in these samples (data not shown). The antibody levels were then evaluated in the plasma samples of CCs and PCs.
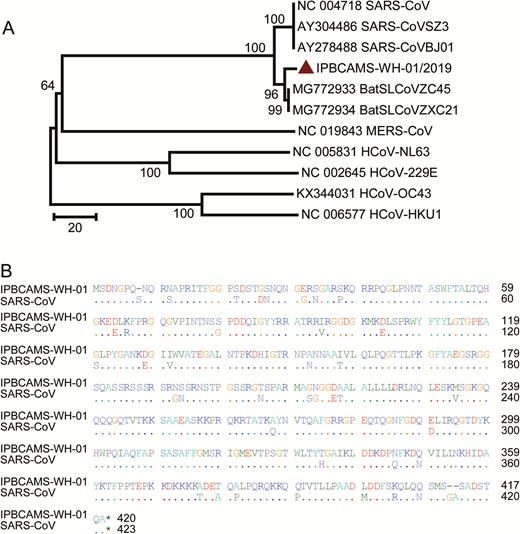
The appearance of IgM, IgA, and IgG antibodies against SARS-CoV-2 was positive as early as day 1 after the symptom onset (Figure 3A). Of the 208 samples tested, 41 were collected between 1 and 7 days, 84 samples between 8 and 14 days, and 83 samples were collected after 14 days post–symptom onset (PSO). The total numbers of samples positive for IgM and IgA were 188 (90.4 %) and 194 (93.3 %) of 208 plasma samples, respectively. As IgM is a marker for acute infection, we specifically examined the positivity of anti–SARS-CoV-2 IgM in the 41 plasma samples that were collected within 7 days PSO, which may represent acute-phase samples. Of these samples, anti–SARS-CoV-2 IgM was detected in 35 samples (85.4%), 27 of which were detected at a plasma dilution of 1:400 and 8 samples were detected at 1:200 dilution. IgA antibodies were detected in 38 of these early samples (92.7%), with an antibody dilution of 1:400. Based on these acute-phase samples, the IgM and IgA antibodies were both detectable at day 5 (median; interquartile range [IQR], 3–6 days), respectively. The anti–SARS-CoV-2 IgG antibodies were positive in 162 (77.9 %) plasma samples. The median time of appearance of IgG was at day 14 (IQR, 10–18 days) PSO (Figure 2A). The times of detection of IgM, IgA, and IgG against SARS-CoV-2 ranged from day 1 to 39 PSO in our study (data not shown).
Characteristics of plasma antibodies in patients infected with SARS-CoV-2. A, Time of appearance of IgM, IgA, and IgG antibodies to SARS-CoV-2, determined by ELISA of plasma samples obtained from inpatients with SARS-CoV-2 infection. As we only wanted to show the early time points, the plasma samples used for detection of IgM and IgA antibodies were selected from patients who had fever or respiratory infectious symptoms within 7 days. The plasma samples used for detection of IgG antibodies were selected from all the patients whose IgG antibodies were positive. B, Levels of IgM, IgA, and IgG antibodies against SARS-CoV-2 in plasma samples after symptom onset. Antibody titers are expressed as GMTs. Abbreviations: ELISA, enzyme-linked immunosorbent assay; GMT, geometric mean titer; Ig, immunoglobulin. *P <.05.
The endpoint titration for antibodies against SARS-CoV-2 rNP was determined by calculating the A450 of a 2-fold serial dilution of each plasma sample for IgM, IgA, and IgG (Figure 3B). Compared with the titers at days 0–7 (GMT, 400), the IgM antibody levels increased between days 8 and 14 (GMT, 535.8; P = .000; Student’s t test) but did not increase further between days 15 and 21 (GMT, 536.31; P = .992) or after day 21 (GMT, 565.69; P = .719). IgA antibody levels increased from days 0–7 (GMT, 400) to days 8–14 (GMT, 597.24; P = .000); however, there was no increase after this time point (GMT at day 15–21 = 723.28, P = .156; or GMT at day >21 = 831.41, P = .538). The IgG antibodies were detected on days 0–7 (GMT, 490.45), increased on days 8–14 (GMT, 1325.6; P = .000), continued to increase until days 15–21 (GMT, 2690.87; P = .000), and reached a plateau by day 21 (GMT, 2974.83; P = .72).
IgM ELISA Assay Used for Early Diagnosis of Patients Infected With SARS-CoV-2
The IgM-positive rate to SARS-CoV-2 was 75.6% (62/82) in CCs and 93.1% (54/58) in PCs (Figure 4A). Further, we fitted curves of the PCR-positive rate and IgG and IgM ELISA positive rates on different days after symptom onset (Figure 4B). The detection rates between days 26 and 39 PSO are not shown due to the limited number of patients on each day. Based on the fitted curve, the PCR-positive rate was more than 90% on 1–3 days PSO, then declined to less than 80% (95% confidence interval [CI], 57.1–95.7%) at day 6 and less than 50% (95% CI, 23.7–59.5%) after 14 days PSO. Overall, the detection rate by qPCR was higher than the IgM ELISA before 5.5 days PSO, while the detection efficiency by IgM ELISA was higher than that of the PCR method after 5.5 days of symptom onset. Overall, the positive detection rate was only 51.9% in a single PCR test, but significantly increased (98.6%) when an IgM ELISA assay was applied to PCR-negative patients (Figure 4C). To further evaluate the performance of anti–SARS-CoV-2 IgM in COVID-19 diagnosis, we analyzed the data from the 26 CCs who had 2 serial plasma samples together with paired throat swabs within a 4-day interval. Among them, 7 patients were PCR negative when testing the first swab, but 6 patients were IgM positive. All 7 patients were PCR positive for the second swab. These results suggest that IgM ELISA can increase the positive detection rate when combined with the PCR method and can be used for the early diagnosis of COVID-19 infections.
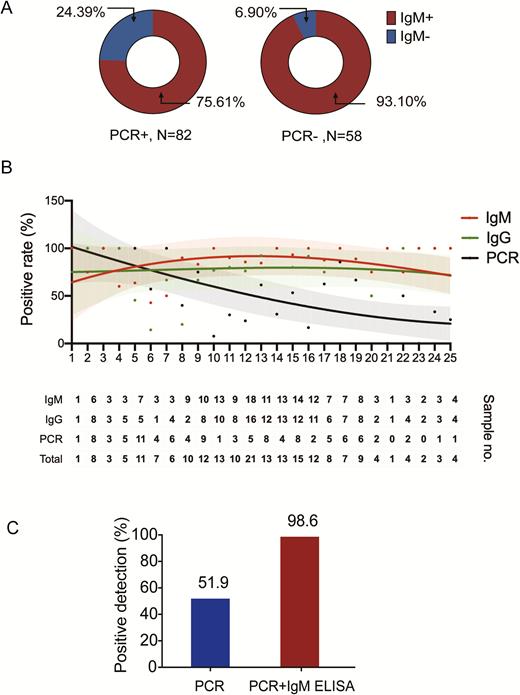
IgM ELISA to diagnose patients infected with COVID-19. A, IgM antibody detection using ELISA in patients who were either PCR positive (82 cases) or who tested negative for the virus by qPCR (58 cases). Red indicates IgM positive while blue indicates IgM negative. B, Fitted curve of the positive detection by PCR and IgM or IgG ELISA on different days after symptom onset. The fitted curves were created by the Fit Spline program of Graphpad Software. The 95% confidence intervals are shown for each curve. The dots in the upper panel represent positive rates of PCR and IgM or IgG ELISA at each time point. The lower table shows the number of samples that tested positive at each time point. The first intersection of the real-time PCR method and IgM ELISA was found to be at 5.5 days. C, The positive detection rate of cases using the PCR method versus PCR plus IgM ELISA assay. Abbreviations: COVID-19, coronavirus disease 2019; ELISA, enzyme-linked immunosorbent assay; Ig, immunoglobulin; PCR, polymerase chain reaction; qPCR, quantitative polymerase chain reaction.
Diagnosis of Family-clustered Cases Using IgM ELISA
To prospectively evaluate the validity of IgM ELISA in the diagnosis of COVID-19, we used the IgM ELISA to diagnose a family cluster involving 2 patients and 4 close contacts (Table 1). The grandparents returned to Beijing from Wuhan on 22 January 2020. The grandmother started having symptoms including fever (38.0℃) and dry cough, and chest computed tomography (CT) showed a bilateral patchy shadow on 2 February. The grandfather experienced a stuffy and runny nose on 3 February. The other 4 members in the family had no significant clinical symptoms. The PCR assay and chest CT of their close contacts, including their daughter, son-in-law, grandson, and granddaughter, were performed on 5 February. The grandmother was found to be positive on viral RNA detection by qPCR. The grandfather and daughter only presented abnormal findings on chest CT but were negative for viral RNA when tested by PCR. The grandson presented with PCR positivity with a normal chest CT. The son-in-law and granddaughter were PCR negative and showed normal lungs by CT imaging. The grandfather, daughter, son-in-low, and granddaughter were also negative for SARS-CoV-2 after the repeat PCR on the next day. However, the IgM antibodies were detected in the grandmother, grandfather, daughter, grandson, and granddaughter. These findings indicate the significant and improved efficacy of COVID-19 detection when IgM measurements are used to assess subclinical subjects.
Diagnosis of a Family Cluster of Cases Using IgM ELISA
| Relationship | Age, years | PCR | IgM Titers | IgG Titers | Computed Tomography | Clinical Diagnosis |
|---|---|---|---|---|---|---|
| Grandmother | 61 | + | 400 | − | + | Case |
| Grandfather | 64 | − | 800 | 3200 | + | Case |
| Daughter | 37 | − | 400 | − | + | Close contact |
| Son-in-law | 40 | − | − | − | − | Close contact |
| Grandson | 6 | + | 200 | − | − | Close contact |
| Granddaughter | 2 | − | 400 | − | − | Close contact |
Abbreviations: ELISA, enzyme-linked immunosorbent assay; IgM, immunoglobulin M; PCR, polymerase chain reaction; +, positive; −, negative.
Discussion
COVID-19 has emerged as a major healthcare challenge globally [13, 14, 16, 17]. A key aspect of limiting this virus spread is to ensure early and accurate diagnosis of the viral infection and appropriate quarantine for those infected. The current methods of diagnosis by qPCR or deep sequencing–based technologies rely on the presence of replicating virus in sufficient amounts to ensure that sufficient quantities of virus are collected [7]. This method often fails to detect the viral infection if the collection procedure is not optimal, or if the patient has low viral load due to an early stage of the disease or suppression by host immunity, or if the samples were obtained at a late stage in the course of infection.
In this study, we first demonstrated that current SARS-CoV-2–positive plasma did not show any cross-reactivity with other coronaviruses, with the exception of SARS-CoV. It is highly unlikely that these patients were pre-infected with SARS-CoV during the last epidemic in 2002, as we measured IgM reactivity, which is unlikely to last that long. Second, the number of infections with SARS-CoV was limited to 8096 worldwide [18], which only represents a tiny fraction of the Chinese population. However, given the sequence homology between these 2 viruses (>90%), the cross-reactivity is not surprising.
We propose conducting antibody testing when a qPCR test is negative despite other indications of COVID-19, including symptoms and epidemiology. Our data show that the supplementary IgM test can provide better sensitivity than a qPCR-based method alone. This is especially important at this stage of the pandemic, where proper diagnosis is essential to limit the virus spread. Although a more sensitive qPCR may improve detection efficacy, the efficacy may still be limited due to various biological reasons as discussed above. However, the more highly sensitive qPCR assays can further improve the detection method when combined with IgM ELISAs.
We primarily used a cross-sectional sample of specimens to determine the kinetics of SARS-CoV-2 antibodies. This is one of the limitations of our study because each patient has different kinetics for the development of antibodies. The median time of appearance of antibodies is therefore affected by factors such as when the specimen was collected and when the symptom onset took place in each individual patient. Further studies are warranted that use longitudinal sample collection in an unbiased manner to test the kinetics of the antibody response.
It is worth noting that approximately 22.0% (18/82) of the patients who were confirmed to be positive by qPCR were found to be negative by the IgM antibody tests. Among the 18 patients, 13 cases were enrolled within less than 7 days after symptom onset, which is probably when the antibodies were not produced in sufficient amounts. Two patients were severe cases and their samples were collected at 19 and 22 days after symptom onset, respectively, suggesting a possible failure of these patients to generate the antibody response, which may have contributed to the disease severity. The remaining 3 patients provided samples between days 9 and 17 after symptom onset. These data suggest that the time course as well as host factors can contribute toward the antibody response to the virus.
To confirm the applicability of our method, we prospectively tested a family cluster, with 2 members who were confirmed to be infected by SARS-CoV-2 while the remaining members tested negative using PCR. In contrast, the antibody testing confirmed the viral infections in the 2 patients and in 3 of the 4 close contacts, which were clinically corroborated in 3 of the family members. Moreover, after a variable period of time, one expects the PCR result to become negative as people stop shedding viruses. Presumably, IgG antibodies will remain positive. This would permit the use of serological tools to better understand the overall rate of infection in the community—including the rate of asymptomatic infections. This could potentially enable us to identify healthcare workers who have been infected in the past and might be less prone to becoming infected on the job. Our data also show the ability to detect subclinical infections effectively, a much-needed tool to stop the spread of infection, which is currently spreading at an alarming rate in Europe and the United States. In addition, the higher speed of antibody testing can be useful and applied in remote areas where qPCR assays cannot be performed.
Conclusions
We demonstrated the time kinetics of the humoral response during COVID-19 and provided evidence that this can aid in the diagnosis of COVID-19, including in subclinical cases.
Notes
Author contributions. J. W., L. W., L. S., and L. R. conceived and designed experiments. L. G., C. W., Y. X., Y. W., L. H., S. D., Yan. X., and C. W. performed the experiments. S. Y., M. X., Q. Y., S. X., H. Z., Ying. X., F. Y., Q. J., and L. W. contributed clinical samples and clinical data collection. L. Z., L. R., D. C., C. S. D. C., and L.G. analyzed the data. L.G., L. R., D. C., L. Z., L. S., C. S. D. C., and J. W. wrote the manuscript. All authors reviewed the manuscript.
Acknowledgments. The authors thank the clinicians who contributed to sample collection and transportation.
Disclaimer. The funders had no role in the design and conduct of the study; collection, management, analysis, and interpretation of the data; preparation, review, or approval of the manuscript; or decision to submit the manuscript for publication.
Financial support. This study was funded in part by the Chinese Academy of Medical Sciences (CAMS) Innovation Fund for Medical Sciences (grant number 2016-I2M-1–014), the nonprofit Central Research Institute Fund of CAMS (grant number 2020HY320001 and 2019PT310029), and the National Major Science & Technology Project for Control and Prevention of Major Infectious Diseases in China (grant number 2017ZX10103004).
Potential conflicts of interest. The authors: No reported conflicts of interest. All authors have submitted the ICMJE Form for Disclosure of Potential Conflicts of Interest.
References
World Health Organization.
World Health Organization.
Author notes
L. G, L. R, S. Y., M. X., D. C., and F. Y. contributed equally to this work.
L. S., L. W., and J. W. contributed equally to this work.


Comments