


Abstract
The authors studied associations between ankle-brachial index (ABI) and subclinical atherosclerosis in the Multi-Ethnic Study of Atherosclerosis. Participants included 3,458 women (average age = 62.6 years) and 3,112 men (average age = 62.8 years) who were free of clinically evident cardiovascular disease. Measurements included ABI, carotid artery intima-media thickness, and coronary artery calcium assessed with computed tomography. Five ABI categories were defined: <0.90 (definite peripheral arterial disease (PAD)), 0.90–0.99 (borderline ABI), 1.00–1.09 (low-normal ABI), 1.10–1.29 (normal ABI), and ≥1.30 (high ABI). Compared with that in men with normal ABI, significantly higher internal carotid artery intima-media thickness was observed in men with definite PAD (1.58 vs. 1.09; p < 0.001), borderline ABI (1.33 vs. 1.09; p < 0.001), and low-normal ABI (1.18 vs. 1.09; p < 0.001) after adjustment for confounders. Fully adjusted odds ratios for a coronary artery calcium score greater than 20 decreased across progressively higher ABI categories in both women (2.85 (definite PAD), 1.27 (borderline ABI), 1.11 (low-normal ABI), 1.00 (normal ABI; referent), and 0.78 (high ABI); p for trend = 0.0002) and men (3.26 (definite PAD), 1.72 (borderline ABI), 1.14 (low-normal ABI), 1.00 (normal ABI; referent), and 1.43 (high ABI); p for trend = 0.0002). These findings indicate excess coronary and carotid atherosclerosis at ABI values below 1.10 (men) and 1.00 (women) and may imply increased risk of cardiovascular events in persons with borderline and low-normal ABI.
Lower-extremity peripheral arterial disease (PAD) can be detected noninvasively with the ankle-brachial index (ABI), a ratio of Doppler-recorded systolic blood pressures in the lower and upper extremities. In persons without PAD, arterial pressures increase with greater distance from the heart, because of increasing impedance with increasing arterial taper (1), resulting in higher systolic blood pressures at the ankle as compared with the brachial arteries. Thus, persons without atherosclerosis typically have an ABI greater than 1.00. An ABI less than 0.90 is highly sensitive and specific for angiographically diagnosed PAD (2, 3).
In general medical practice, the prevalence of ABI <0.90 is 25–30 percent among patients selected for older age or a history of diabetes or smoking (4–6). ABI <0.90 is associated with a two- to threefold increased risk of cardiovascular morbidity and mortality (7, 8). The prevalence and significance of borderline ABI (i.e., ABI 0.90–0.99), low-normal ABI (i.e., ABI 1.00–1.09), and elevated ABI (i.e., ABI ≥1.30) are less well studied.
We studied the prevalence of a priori defined categories of ABI: PAD (ABI <0.90), borderline ABI (ABI 0.90–0.99), low-normal ABI (ABI 1.00–1.09), normal ABI (ABI 1.10–1.29), and high ABI (ABI ≥1.30) in an ethnically diverse group of men and women participating in the Multi-Ethnic Study of Atherosclerosis (MESA). We studied associations between these ABI categories and severity of subclinical atherosclerosis in the carotid and coronary arterial beds. We hypothesized that borderline ABI, low-normal ABI, definite PAD, and possibly high ABI would be associated with more severe subclinical atherosclerosis in other vascular beds in comparison with normal ABI values. We also evaluated whether there were ethnic differences in associations between ABI and subclinical atherosclerosis in the carotid and coronary arterial beds.
MATERIALS AND METHODS
Study cohort
The methods used in MESA have been described previously (9). The MESA cohort consists of 6,814 men and women aged 45–84 years who were enrolled at six US field centers and were free of clinically evident cardiovascular disease at the time of enrollment. The study was designed to include 38 percent Whites, 28 percent African Americans, 23 percent Hispanics, 11 percent Asians, and approximately 50 percent females. The six field centers are located at the Johns Hopkins University (Baltimore, Maryland), Northwestern University (Chicago, Illinois), Wake Forest University School of Medicine (Forsyth County, North Carolina), the University of California at Los Angeles (Los Angeles County, California), Columbia University (New York, New York), and the University of Minnesota (St. Paul, Minnesota). This analysis included 6,570 subjects (3,112 men and 3,458 women); 244 were excluded because ABI was not measured or other data were missing. Institutional review board approval was obtained at each participating center. Informed consent was obtained from all participants.
Measurements
Height and weight were measured during the study visit. Body mass index was calculated as weight (kg)/height (m)2. Systolic blood pressure was measured three times in the seated position with a Dinamap model pro 100 automated oscillometric sphygmomanometer (Critikon, Inc., Tampa, Florida) (10). The final two systolic blood pressure measurements were used in the analyses.
Cigarette smoking was defined on the basis of self-report. Participants brought their medication bottles to study appointments. Medication names were recorded, coded, and categorized. Diabetes mellitus was defined on the basis of self-report, a fasting glucose level greater than or equal to 126 mg/dl, or reported use of diabetes medication. Fasting glucose level was measured once.
Plasma lipids
Total plasma cholesterol and triglyceride levels were measured using a cholesterol oxidase method and Triglyceride GB reagent, respectively (Roche Diagnostics, Indianapolis, Indiana), with a Roche COBAS FARA centrifugal analyzer in the Collaborative Studies Clinical Laboratory at Fairview-University Medical Center (Minneapolis, Minnesota). High density lipoprotein cholesterol was measured in ethylenediaminetetraacetic acid plasma using the cholesterol oxidase method (Roche Diagnostics) after precipitation of non-high density lipoprotein cholesterol with magnesium/dextran. Low density lipoprotein cholesterol was calculated in plasma specimens that had a triglyceride value less than 400 mg/dl, using the formula of Friedewald et al. (11).
Coronary artery calcium score
Computed tomography of coronary arteries was performed with cardiac-gated electron-beam scanners at three field centers (Imatron C-150; Imatron, Inc., San Francisco, California) (12) or with a prospectively electrocardiogram-triggered scan acquisition at 50 percent of the R-R interval with multidetector scanners (13) at the remaining three centers. A previous study showed that these scanners in MESA were comparable in their ability to measure calcium (14). Participants were scanned along with phantoms of known physical calcium concentration. Scans were read centrally at Harbor-University of California Medical Center (Los Angeles, California) for quantification of Agatston coronary artery calcium (CAC) score. We defined significant CAC as a score greater than 20, on the basis of a previous study (15).
Carotid artery intima-media thickness
Images of bilateral common carotid and internal carotid arteries were obtained using high-resolution B-mode ultrasonography. Images of near and far walls were obtained, on the basis of a previous study (16). A Logiq 700 ultrasound machine (GE Medical Systems, Waukesha, Wisconsin) was used at all centers. Central reading of intima-media thickness (IMT) was done at the Tufts-New England Medical Center (Boston, Massachusetts) (17, 18).
Ankle-brachial index
Measurements for calculation of ABI were obtained using a hand-held Doppler instrument with a 5-mHz probe (Nicolet Vascular, Golden, Colorado). Systolic blood pressure measurements were obtained from bilateral brachial, dorsalis pedis, and posterior tibial arteries (19). Brachial artery pressures were averaged to obtain the ABI denominator. When the two brachial artery pressures differed by 10 mmHg or more, the highest brachial artery pressure was used as the denominator (19). For each lower extremity, the ABI numerator used was the highest pressure (dorsalis pedis or posterior tibial) from that leg. The lower of the right and left ABI values was used to classify the participant into an ABI category.
We defined five ABI categories. Definite PAD was defined as ABI <0.90, on the basis of previous studies showing that an ABI less than 0.90 is 94 percent sensitive and 99 percent specific for angiographically diagnosed PAD (3) and is associated with increased risk of cardiovascular morbidity and mortality (7, 8). Borderline ABI was defined as ABI 0.90–0.99, since participants without lower extremity atherosclerosis should have an ABI greater than 1.0 (1). Low-normal ABI was defined as ABI 1.00–1.09. Normal ABI was defined as ABI 1.10–1.29. High ABI (possibly indicative of calcified lower extremity arteries) was defined as ABI ≥1.30 (20). Some previous studies have used ABI ≥1.50 to define the upper limit of normal (7, 8, 21, 22). However, the optimal upper limit of normal ABI is unknown. Higher ABI values are considered indicative of medial arterial calcinosis and inability to accurately gauge the lower extremity arterial obstruction. Recently, ABI >1.30 has been suggested as the upper limit of normal for ABI (20).
Statistical analyses
Age-adjusted mean values for participant characteristics by ABI group were determined using analysis of covariance. To assess the linear trend of the relation of ABI as a continuous variable with body mass index, lipid levels, and systolic and diastolic blood pressures, we used linear regression analysis, adjusting for age. For diabetes, hypertension, and smoking, we assessed linear associations using the Mantel-Haenszel correlation chi-square test, adjusting for age in 10-year strata.
Analyses of covariance were used to estimate adjusted mean values by ABI group for common carotid IMT and internal carotid IMT. Logistic regression was used to estimate the adjusted odds of CAC scores greater than 20 and CAC scores greater than 0 for each ABI group as compared with the normal ABI group (reference group, 1.10 ≤ ABI ≤ 1.29). For each subclinical atherosclerotic endpoint, results were first adjusted for age only and then fully adjusted for age, race, low density lipoprotein cholesterol, high density lipoprotein cholesterol, systolic blood pressure, body mass index, use of cholesterol-lowering medication, diabetes, and cigarette smoking status (current/former/never). Linear trend was evaluated using linear regression or logistic regression models, with ABI as a continuous variable. The possibility of a quadratic or U-shaped trend was evaluated by including an ABI squared term in the trend model, in addition to an ABI term. For identification of ethnic differences in the associations between ABI and subclinical atherosclerosis in the coronary and carotid arterial beds, analyses relating ABI to carotid IMT and CAC scores greater than 20 were repeated within each ethnic subgroup. The z test was used to compare the significance of differences in slopes between ethnic groups for each relation between ABI and subclinical atherosclerosis.
RESULTS
The average age of women was 62.6 years, and the average age of men was 62.8 years (p = 0.420). Age-adjusted average ABI values were 1.089 in women and 1.140 in men (p < 0.0001). Among participants with an ABI less than 0.90, age-adjusted average ABI values were not different between women and men (0.770 vs. 0.743, respectively; p = 0.083). Median CAC scores were 17.2 for men (interquartile range (IQR), 0.00–187) and 0.00 for women (IQR, 0.00–33.1). Prevalences of CAC scores greater than 20 were 49 percent among men and 28.8 percent among women. Median common carotid IMT values were 0.9 mm (IQR, 0.8–1.0) for men and 0.8 mm (IQR, 0.7–0.90) for women. Median internal carotid IMT values were 0.9 mm (IQR, 0.7–1.4) for men and 0.8 mm (IQR, 0.6–1.2) for women.
The prevalence of definite PAD was 3.7 percent among women and 3.7 percent among men. The prevalence of borderline ABI was more than twice as high in women as in men (10.3 percent vs. 4.0 percent; p < 0.001). Low-normal ABI was also more common in women (35.5 percent vs. 21.1 percent; p < 0.001). These sex differences did not change substantially after we adjusted for height or after we repeated age-adjusted gender prevalence analyses within the entire cohort.
Figure 1 shows the proportion of subjects in each ABI category within each ethnic group for men and women. Among women, prevalences of PAD and borderline ABI were lowest among Hispanics and highest in African Americans. Among men, prevalences of PAD and borderline ABI were lowest among Chinese and highest among African Americans.
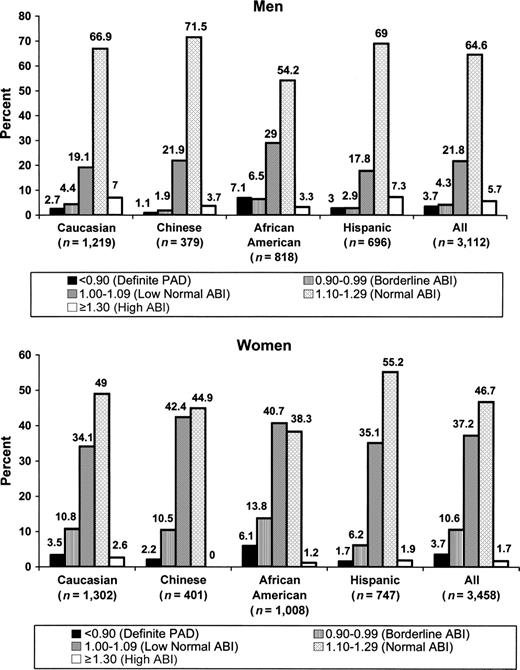
Distribution of ankle-brachial index (ABI) values among men and women in the Multi-Ethnic Study of Atherosclerosis, 2000–2002. PAD, peripheral arterial disease.
Table 1 shows characteristics of the participants according to ABI categories. Among women, age, systolic blood pressure, diastolic blood pressure, prevalence of hypertension, and prevalence of cigarette smoking were inversely related to ABI. Among men, systolic blood pressure, prevalence of hypertension, and prevalence of cigarette smoking were inversely associated with ABI. Among both men and women, body mass index was highest in the ABI ≥1.30 group. Among women, diabetes prevalence was higher in the ABI ≥1.30 group than in the remaining groups with ABI ≥0.90.
Age-adjusted clinical characteristics of women and men according to ankle-brachial index (ABI) category in the Multi-Ethnic Study of Atherosclerosis, 2000–2002*
Characteristic | Definite PAD† (ABI <0.90) | Borderline ABI (ABI 0.90–0.99) | Low-normal ABI (ABI 1.00–1.09) | Normal ABI (ABI 1.10–1.29) | High ABI (ABI ≥1.30) | p for trend | ||||||||||||
|---|---|---|---|---|---|---|---|---|---|---|---|---|---|---|---|---|---|---|
| Women (n = 129) | Men (n = 116) | Women (n = 367) | Men (n = 133) | Women (n = 1,286) | Men (n = 677) | Women (n = 1,616) | Men (n = 2,009) | Women (n = 60) | Men (n = 177) | Women | Men | |||||||
| Age (years) | 71.6 | 71.0 | 65.4 | 67.1 | 63.3 | 64.0 | 60.7 | 61.5 | 59.9 | 63.4 | <0.0001 | <0.0001 | ||||||
| Body mass index‡ | 28.7 | 27.7 | 28.6 | 28.0 | 28.4 | 27.3 | 28.9 | 27.9 | 32.0 | 29.3 | 0.0006 | <0.0001 | ||||||
| Diabetes (%) | 26.0 | 27.5 | 11.9 | 18.9 | 11.6 | 14.4 | 11.9 | 14.1 | 20.8 | 16.2 | 0.0006 | 0.0002 | ||||||
| Systolic blood pressure (mmHg) | 136.4 | 131.0 | 132.8 | 130.1 | 129.5 | 127.4 | 123.4 | 125.2 | 117.7 | 122.0 | <0.0001 | <0.0001 | ||||||
| Diastolic blood pressure (mmHg) | 71.1 | 73.4 | 70.8 | 74.8 | 69.9 | 75.6 | 68.3 | 75.1 | 63.2 | 73.1 | <0.0001 | 0.2595 | ||||||
| Hypertension§ (%) | 58.5 | 60.1 | 54.5 | 54.5 | 49.9 | 45.2 | 39.7 | 39.9 | 32.3 | 33.6 | <0.0001 | <0.0001 | ||||||
| High density lipoprotein cholesterol (mg/dl) | 53.4 | 43.5 | 56.3 | 45.1 | 56.7 | 45.5 | 56.4 | 45.2 | 58.0 | 45.4 | 0.4577 | 0.2034 | ||||||
| Low density lipoprotein cholesterol (mg/dl) | 122.4 | 117.6 | 117.8 | 122.7 | 117.4 | 115.7 | 117.9 | 116.9 | 113.5 | 111.3 | 0.2011 | 0.0146 | ||||||
| Cigarette smoking (%) | ||||||||||||||||||
| Current smoker | 24.0 | 33.0 | 17.5 | 24.7 | 11.3 | 20.3 | 9.5 | 11.4 | 7.0 | 6.6 | <0.0001 | <0.0001 | ||||||
| Never smoker | 45.0 | 25.9 | 51.9 | 28.3 | 59.6 | 35.6 | 62.1 | 43.4 | 69.2 | 49.2 | ||||||||
Results (other than age) were adjusted for age.
PAD, peripheral arterial disease.
Weight (kg)/height (m)2.
Defined as blood pressure ≥140/90 mmHg or use of antihypertensive medication.
In age-adjusted analyses, men and women with definite PAD, borderline ABI, and low-normal ABI each had significantly higher common carotid artery IMTs than the normal ABI group (table 2). Among women, definite PAD and borderline ABI, but not low-normal ABI, were associated with significantly higher average internal carotid IMT in comparison with the normal ABI group. Among men, definite PAD, borderline ABI, and low-normal ABI were all associated with significantly higher internal carotid IMTs in comparison with the normal ABI group. In age-adjusted analyses, women and men with definite PAD and borderline ABI each had significantly higher odds ratios for a CAC score greater than 20 than did the normal ABI group. Among men, the high ABI group had a significantly higher odds ratio for a CAC score greater than 20 than did the normal ABI group.
Associations between ankle-brachial index (ABI) category and subclinical atherosclerosis in the Multi-Ethnic Study of Atherosclerosis, 2000–2002
Category | ABI range | Women | Men | ||||||||||||||||
|---|---|---|---|---|---|---|---|---|---|---|---|---|---|---|---|---|---|---|---|
| No. | Age-adjusted model | Fully adjusted‡ model | No. | Age-adjusted model | Fully adjusted‡ model | ||||||||||||||
| Mean or OR§ | 95% CI§ | Mean or OR | 95% CI | Mean or OR | 95% CI | Mean or OR | 95% CI | ||||||||||||
| Mean common carotid artery IMT§ (mm) | |||||||||||||||||||
| Definite PAD§ | <0.90 | 124 | 0.93*** | 0.90, 0.95 | 0.90*** | 0.83, 0.87 | 112 | 1.03*** | 1.00, 1.07 | 1.01*** | 0.95, 1.04 | ||||||||
| Borderline ABI | 0.90–0.99 | 357 | 0.86† | 0.84, 0.87 | 0.84 | 0.83, 0.86 | 130 | 0.97*** | 0.94, 1.00 | 0.95*** | 0.92, 0.98 | ||||||||
| Low-normal ABI | 1.00–1.09 | 1,272 | 0.85* | 0.84, 0.86 | 0.85 | 0.84, 0.86 | 668 | 0.90* | 0.88, 0.91 | 0.90 | 0.88, 0.91 | ||||||||
| Normal ABI | 1.10–1.29 | 1,602 | 0.84 | 0.82, 0.85 | 0.85 | 0.84, 0.85 | 1,992 | 0.88 | 0.87, 0.89 | 0.88 | 0.88, 0.89 | ||||||||
| High ABI | ≥1.30 | 60 | 0.83 | 0.79, 0.87 | 0.84 | 0.90, 0.88 | 174 | 0.88 | 0.85, 0.91 | 0.89 | 0.86, 0.91 | ||||||||
| p for trend | <0.0001 | 0.0240 | <0.0001 | <0.0001 | |||||||||||||||
| Mean internal carotid artery IMT (mm) | |||||||||||||||||||
| Definite PAD | <0.90 | 121 | 1.36*** | 1.26, 1.45 | 1.27*** | 1.18, 1.37 | 110 | 1.62*** | 1.51, 1.73 | 1.58*** | 1.47, 1.68 | ||||||||
| Borderline ABI | 0.90–0.99 | 352 | 1.09*** | 1.04, 1.15 | 1.06* | 1.00, 1.11 | 129 | 1.39*** | 1.29, 1.49 | 1.33*** | 1.23, 1.43 | ||||||||
| Low-normal ABI | 1.00–1.09 | 1,256 | 1.00 | 0.97, 1.03 | 1.00 | 0.97, 1.03 | 660 | 1.18*** | 1.13, 1.22 | 1.18*** | 1.14, 1.22 | ||||||||
| Normal ABI | 1.10–1.29 | 1,569 | 0.97 | 0.94, 1.00 | 0.98 | 0.96, 1.01 | 1,969 | 1.08 | 1.06, 1.11 | 1.09 | 1.07, 1.12 | ||||||||
| High ABI | ≥1.30 | 59 | 0.91 | 0.78, 1.05 | 0.92 | 0.78, 1.05 | 172 | 1.07 | 0.99, 1.16 | 1.07 | 0.99, 1.16 | ||||||||
| p for trend | <0.0001 | <0.0001 | <0.0001 | <0.0001 | |||||||||||||||
| OR for Agatston CAC§ score >20 | |||||||||||||||||||
| Definite PAD | <0.90 | 129 | 3.43*** | 2.22, 5.32 | 2.85*** | 1.81, 4.49 | 116 | 3.09*** | 1.84, 5.19 | 3.26*** | 1.91, 5.57 | ||||||||
| Borderline ABI | 0.90–0.99 | 367 | 1.43** | 1.09, 1.87 | 1.27† | 0.96, 1.68 | 133 | 1.83** | 1.22, 2.75 | 1.72* | 1.12, 2.63 | ||||||||
| Low-normal ABI | 1.00–1.09 | 1,286 | 1.15 | 0.96, 1.03 | 1.11 | 0.92, 1.34 | 677 | 1.08 | 0.89, 1.31 | 1.14 | 0.93, 1.40 | ||||||||
| Normal ABI | 1.10–1.29 | 1,616 | 1.00 | 1.00 | 2,009 | 1.00 | 1.00 | ||||||||||||
| High ABI | ≥1.30 | 60 | 0.78 | 0.38, 1.60 | 0.78 | 0.38, 1.62 | 177 | 1.44* | 1.03, 2.01 | 1.43* | 1.00, 1.99 | ||||||||
| p for trend | <0.0001 | 0.0002 | <0.0001 | 0.0002 | |||||||||||||||
p < 0.10;
p < 0.05;
p < 0.01;
p < 0.001 (in comparison with ABI 1.10–1.29).
Adjusted for age, race, low density lipoprotein cholesterol, high density lipoprotein cholesterol, systolic blood pressure, body mass index, current use of cholesterol-lowering medication, diabetes, and cigarette smoking. Total numbers of subjects for each outcome were as follows: women—common carotid IMT, n = 3,415; internal carotid IMT, n = 3,357; CAC, n = 3,458; men—common carotid IMT, n = 3,076; internal carotid IMT, n = 3,040; CAC, n = 3,112.
OR, odds ratio; CI, confidence interval; IMT, intima-media thickness; PAD, peripheral arterial disease; CAC, coronary artery calcium.
After adjusting for age, race, low density lipoprotein cholesterol, high density lipoprotein cholesterol, systolic blood pressure, body mass index, use of cholesterol-lowering medication, diabetes, and cigarette smoking, we observed significant inverse associations between ABI categories and both common carotid artery IMT and internal carotid artery IMT, among men and women, respectively (table 2). In pairwise comparisons among women, definite PAD was associated with higher common and internal carotid IMT in comparison with normal ABI. Among women, in fully adjusted analyses, borderline ABI was associated with significantly higher internal carotid IMT than was normal ABI. In pairwise comparisons among men, definite PAD and borderline ABI were each associated with higher average common and internal carotid IMT than normal ABI. Among men, in fully adjusted analyses, low-normal ABI was associated with significantly higher internal carotid IMT than normal ABI.
In fully adjusted analyses among women, lower ABI categories were associated with higher odds ratios for CAC scores greater than 20. In fully adjusted pairwise comparisons, definite PAD was associated with a significantly higher odds ratio for CAC > 20 than was normal ABI among women. In fully adjusted analyses among men, odds ratios for CAC > 20 were significantly associated with ABI. In pairwise comparisons among men, definite PAD, borderline ABI, and high ABI were each associated with significantly higher odds ratios for CAC > 20 in comparison with the normal ABI group. When analyses were repeated using CAC > 0 as the dependent variable, results for men and women were comparable to those shown in table 2.
Linear associations between ABI and subclinical atherosclerosis were generally consistent across ethnic groups in women and men, respectively (table 3). However, among women, ABI and internal carotid artery IMT were significantly less inversely associated in Chinese women than in Caucasian women (p = 0.016 for the difference in regression coefficients between Chinese and Caucasian women). ABI and internal carotid IMT were also less inversely associated in Chinese women than in Hispanic women (p = 0.012 for the difference in regression coefficients between Chinese and Hispanic women). Among men, associations between ABI and internal carotid IMT were significantly less inverse in Caucasians than in African Americans (p = 0.02 for the difference in regression coefficients between Caucasian and African-American men).
Fully adjusted associations between ankle-brachial index (ABI) category and subclinical atherosclerosis, by ethnic group, in the Multi-Ethnic Study of Atherosclerosis, 2000–2002*
Category | ABI range | Ethnic group | ||||||||||||||||||||
|---|---|---|---|---|---|---|---|---|---|---|---|---|---|---|---|---|---|---|---|---|---|---|
| All subjects | Caucasians | Chinese | African Americans | Hispanics | ||||||||||||||||||
| No. | Mean or OR† | No. | Mean or OR | No. | Mean or OR | No. | Mean or OR | No. | Mean or OR | |||||||||||||
| Women | ||||||||||||||||||||||
| Mean internal carotid artery IMT† (mm) | ||||||||||||||||||||||
| Definite PAD† | <0.90 | 121 | 1.27 | 42 | 1.46 | 9 | 0.89 | 57 | 1.24 | 13 | 1.24 | |||||||||||
| Borderline ABI | 0.90–0.99 | 352 | 1.06 | 134 | 1.12 | 41 | 0.82 | 133 | 1.08 | 44 | 1.10 | |||||||||||
| Low-normal ABI | 1.00–1.09 | 1,256 | 1.00 | 436 | 1.00 | 169 | 0.79 | 400 | 1.07 | 251 | 0.94 | |||||||||||
| Normal ABI | 1.10–1.29 | 1,569 | 0.98 | 626 | 1.01 | 177 | 0.84 | 369 | 1.04 | 397 | 0.93 | |||||||||||
| High ABI | ≥1.30 | 59 | 0.92 | 34 | 0.98 | 0 | 12 | 1.07 | 13 | 0.80 | ||||||||||||
| p for trend | <0.0001 | <0.0001 | 0.743 | 0.006 | <0.0003 | |||||||||||||||||
| OR for Agatston CAC† score >20 | ||||||||||||||||||||||
| Definite PAD | <0.90 | 129 | 2.85 | 46 | 3.85 | 9 | 1.81 | 61 | 3.22 | 13 | 1.98 | |||||||||||
| Borderline ABI | 0.90–0.99 | 367 | 1.27 | 140 | 1.45 | 42 | 0.66 | 139 | 1.40 | 46 | 1.48 | |||||||||||
| Low-normal ABI | 1.00–1.09 | 1,286 | 1.11 | 444 | 1.03 | 170 | 1.28 | 410 | 1.35 | 262 | 0.84 | |||||||||||
| Normal ABI | 1.10–1.29 | 1,616 | 1.00‡ | 638 | 1.00‡ | 180 | 1.00‡ | 386 | 1.00‡ | 412 | 1.00‡ | |||||||||||
| High ABI | ≥1.30 | 60 | 0.78 | 34 | 1.08 | 12 | 1.06 | 14 | 0.21 | |||||||||||||
| p for trend | <0.0001 | 0.0018 | 0.777 | 0.0112 | 0.180 | |||||||||||||||||
| Men | ||||||||||||||||||||||
| Mean internal carotid artery IMT (mm) | ||||||||||||||||||||||
| Definite PAD | <0.90 | 110 | 1.58 | 32 | 1.61 | 4 | 1.64 | 56 | 1.57 | 18 | 1.64 | |||||||||||
| Borderline ABI | 0.90–0.99 | 129 | 1.33 | 51 | 1.21 | 6 | 1.08 | 52 | 1.36 | 20 | 1.61 | |||||||||||
| Low-normal ABI | 1.00–1.09 | 660 | 1.18 | 228 | 1.26 | 82 | 0.99 | 228 | 1.15 | 122 | 1.17 | |||||||||||
| Normal ABI | 1.10–1.29 | 1,969 | 1.09 | 801 | 1.17 | 270 | 0.91 | 431 | 1.07 | 467 | 1.08 | |||||||||||
| High ABI | ≥1.30 | 172 | 1.07 | 85 | 1.21 | 14 | 0.93 | 24 | 1.02 | 49 | 0.99 | |||||||||||
| p for trend | <0.0001 | 0.001 | 0.007 | <0.0001 | 0.0001 | |||||||||||||||||
| OR for Agatston CAC score >20 | ||||||||||||||||||||||
| Definite PAD | <0.90 | 116 | 3.26 | 33 | 4.15 | 4 | >99§ | 58 | 3.33 | 21 | 2.14 | |||||||||||
| Borderline ABI | 0.90–0.99 | 133 | 1.72 | 53 | 1.26 | 7 | 0.67 | 53 | 2.23 | 20 | 2.29 | |||||||||||
| Low-normal ABI | 1.00–1.09 | 677 | 1.14 | 233 | 1.31 | 83 | 0.69 | 237 | 1.29 | 124 | 1.14 | |||||||||||
| Normal ABI | 1.10–1.29 | 2,009 | 1.00‡ | 815 | 1.00‡ | 271 | 1.00‡ | 443 | 1.00‡ | 480 | 1.00‡ | |||||||||||
| High ABI | ≥1.30 | 177 | 1.43 | 85 | 1.19 | 14 | 2.14 | 27 | 2.72 | 51 | 1.16 | |||||||||||
| p for trend | 0.0002 | 0.095 | 0.777 | 0.001 | 0.188 | |||||||||||||||||
Results were adjusted for age, race, low density lipoprotein cholesterol, high density lipoprotein cholesterol, systolic blood pressure, body mass index, use of cholesterol-lowering medication, diabetes, and cigarette smoking.
OR, odds ratio; IMT, intima-media thickness; PAD, peripheral arterial disease; CAC, coronary artery calcium.
Reference group.
All of the men in the definite PAD group had a CAC score >20.
DISCUSSION
The ABI is a noninvasive screening tool for which measurement can be performed readily in an office setting. Among MESA participants, ABI was significantly associated with the degree of subclinical atherosclerosis in the coronary and carotid arterial beds in fully adjusted analyses. In pairwise comparisons, definite PAD was associated with significantly higher carotid IMT and a higher prevalence of CAC scores greater than 20. Among women, borderline ABI was associated with greater subclinical atherosclerosis in the internal carotid artery than was normal ABI, independent of confounders. Among men, borderline ABI values were associated with greater subclinical atherosclerosis in the internal carotid, common carotid, and coronary arteries. Men with low-normal ABIs had significantly greater atherosclerosis in the internal carotid artery. Findings reported here showing higher CAC scores in men with ABI ≥1.30 than in men with normal ABI are consistent with recent findings showing increased cardiovascular disease mortality among Strong Heart Study participants with ABIs greater than 1.40 (23).
Among men and women in MESA, African Americans had substantially higher prevalences of definite PAD and borderline ABI than did non-African Americans. Previous studies have shown that African Americans have a higher prevalence of PAD than Caucasians (7, 22, 24–27), an excess only partially explained by a higher prevalence of diabetes and hypertension in African Americans (28). While data reported here for women showed that Hispanics had the lowest prevalence of PAD and borderline ABI, previous studies of persons identified in clinical settings have shown comparable prevalences of PAD between Caucasians and Hispanics (5, 27, 29). Inverse associations between ABI and subclinical atherosclerosis were generally consistent across ethnic groups. However, among women, inverse associations between ABI and subclinical atherosclerosis were less strong in Chinese than in Caucasians and African Americans. Among men, associations between ABI and subclinical atherosclerosis were stronger in African Americans than in Caucasians. The results presented here did not allow us to determine reasons for these ethnic differences in associations between ABI and subclinical atherosclerosis.
Prior studies have assessed associations between ABI as a continuous variable and carotid IMT (30–32). However, to our knowledge, only one prior study has assessed associations between borderline or low-normal ABI and carotid IMT. In the Atherosclerosis Risk in Communities Study, an ABI less than 0.90 was associated with higher carotid IMT among African-American women and White men after adjustment for age, low density lipoprotein cholesterol, hypertension, and diabetes (30). However, in contrast to our findings here, this relation was not observed among African-American men or White women. To our knowledge, only one prior study has assessed associations between borderline or low-normal ABI and CAC scores (33). In the Rotterdam Coronary Calcification Study population (2,013 participants), men and women with ABI <0.90 had significantly higher CAC scores than participants with ABI ≥1.20. Among men, but not among women, ABI 0.90–0.99 was also associated with a higher CAC score than was ABI ≥1.20 (33). However, linear associations between ABI categories and CAC scores were not observed. To our knowledge, no prior studies have assessed ethnic differences in associations between ABI and subclinical atherosclerosis in the coronary and carotid arterial beds.
The prevalence of definite PAD was relatively low in the MESA cohort in comparison with previous studies in which participants were recruited among community-dwelling men and women (22, 34). For example, in the Cardiovascular Health Study, the prevalence of ABI <0.90 was 12 percent among men and women aged 65 years or more (22). In contrast to prior studies, a history of clinically evident cardiovascular disease was an exclusion criterion for MESA. Furthermore, the Cardiovascular Health Study excluded persons under age 65 years. Increasing age is a well-documented risk factor for PAD (22, 34). The exclusion of persons with clinically evident cardiovascular disease and the inclusion of persons under age 65 years in the MESA cohort are likely contributors to the relatively low prevalence of definite PAD observed in MESA.
The variability of the ABI measure is approximately 12 percent (35). While this may have resulted in some misclassification of participants into other ABI categories, systematic bias is unlikely. Based on the findings reported here, further study is needed to determine whether persons with borderline and low-normal ABIs have increased rates of cardiovascular events as compared with persons with normal ABI.
Similar to findings from the Cardiovascular Health Study and the Systolic Hypertension in the Elderly Program, prevalences of ABI <0.90 in MESA were comparable between men and women (7, 20). Gender differences in the prevalence of PAD appear to be smaller in populations that include persons with relatively mild PAD (36), which is consistent with findings in the MESA cohort. In MESA, women had significantly higher prevalences of borderline and low-normal ABI than did men. These findings are consistent with a previous study by Hiatt et al. (29), in which average ABIs were 7 percent lower in women than in men among 403 San Luis Valley Diabetes Study participants with low cardiovascular risk. In the Atherosclerosis Risk in Communities cohort, average ABI values were 1.12 in women and 1.18 in men (37). Because systolic blood pressures increase with greater distance from the heart, these sex differences in ABI could be explained by greater height in men than in women. In the San Luis Valley Diabetes Study and in MESA, adjustment for height did not eliminate gender differences in ABI. Thus, an unidentified factor may account for the gender difference in low-normal and borderline ABI values reported here.
In conclusion, borderline and low-normal ABI values were common in the MESA cohort. In both men and women, borderline ABI values were associated with a significantly higher prevalence of subclinical atherosclerosis in comparison with normal ABI values (ABI 1.10–1.29). Low-normal ABI values were associated with a significantly higher prevalence of subclinical atherosclerosis in men. Based on the findings reported here, further study is needed to determine whether persons with borderline ABI and men with low-normal ABI have a higher incidence of cardiovascular events than persons with normal ABI, and whether intensive atherosclerotic risk factor intervention comparable to that currently recommended for patients with clinically evident PAD is important for persons with borderline and low-normal ABI in order to prevent the progression of subclinical atherosclerosis.
Conflict of interest: none declared.
References
Fung YC. Blood flow in arteries: pressure and velocity waves in large arteries and the effects of geometric nonuniformity. In: Biodynamics: circulation. New York, NY: Springer-Verlag,
Yao ST, Hobbs JT, Irvine WT. Ankle systolic pressure measurements in arterial disease affecting the lower extremities.
Ouriel K, Zarins CK. Doppler ankle pressure: an evaluation of three methods of expression.
Hirsch AT, Criqui MH, Treat-Jacobson D, et al. Peripheral arterial disease detection, awareness, and treatment in primary care.
McDermott MM, Mehta S, Greenland P. Leg symptoms other than intermittent claudication are common in peripheral arterial disease.
Farkouh ME, Oddone EZ, Simel DL. Improving the clinical examination for peripheral arterial disease. US-Canadian Research Group on the Clinical Examination.
Newman AB, Sutton-Tyrrell K, Vogt MT, et al. Morbidity and mortality in hypertensive adults with a low ankle/arm blood pressure index.
Vogt MT, McKenna M, Anderson SJ, et al. The relationship between ankle-arm index and mortality in older men and women.
Bild DE, Bluemke DA, Burke GL, et al. Multi-Ethnic Study of Atherosclerosis: objectives and design.
Friedewald WT, Levy RI, Fredrickson DS. Estimation of the concentration of low-density lipoprotein cholesterol in plasma, without use of the preparative ultracentrifuge.
Breen JF, Sheedy PF, Schwartz RS, et al. Coronary artery calcification detected with ultrafast CT as an indication of coronary artery disease.
Carr JJ, Crouse JR, Goff DC, et al. Evaluation of sub-second gated helical CT for quantification of coronary artery calcium and comparison with electron beam CT.
Carr JJ, Nelson JC, Wong ND, et al. Calcified coronary artery plaque measurement with cardiac CT in population-based studies: standardized protocol of Multi-Ethnic Study of Atherosclerosis (MESA) and Coronary Artery Risk Development in Young Adults (CARDIA) Study.
Iribarren C, Sidney S, Bild DE, et al. Association of hostility with coronary artery calcification in young adults: The CARDIA Study. Coronary Artery Risk Development in Young Adults.
O'Leary DH, Polak JF, Kronmal RA, et al. Thickening of the carotid wall: a marker for atherosclerosis in the elderly? Cardiovascular Health Study Collaborative Research Group.
Mukamal KJ, Kronmal RA, Mittleman MA, et al. Alcohol consumption and carotid atherosclerosis in older adults: The Cardiovascular Health Study.
Espeland MA, Evans GW, Wagenknecht LE, et al. Site-specific progression of carotid intimal-medial thickness.
McDermott MM, Criqui MH, Liu K, et al. Lower ankle/brachial index, as calculated by averaging the dorsalis pedis and posterior tibial arterial pressures, is associated with leg functioning in peripheral arterial disease.
Hiatt WR. Medical treatment of peripheral arterial disease and claudication.
McDermott MM, Greenland P, Liu K, et al. The ankle brachial index is associated with leg function and physical activity: The Walking and Leg Circulation Study.
Newman A, Siscovick D, Manolio T, et al. Ankle-arm index as a marker of atherosclerosis in the Cardiovascular Health Study. Cardiovascular Health Study (CHS) Collaborative Research Group.
Resnick HE, Lindsay RS, McDermott MM, et al. Relationship of high and low ankle brachial index to all-cause and cardiovascular disease mortality: The Strong Heart Study.
Kullo IJ, Bailey KR, Kardia SL, et al. Ethnic differences in peripheral arterial disease in the NHLBI Genetic Epidemiology Network of Arteriopathy (GENOA) study.
Selvin E, Erlinger TP. Prevalence of and risk factors for peripheral arterial disease in the United States: results from the National Health and Nutrition Examination Survey, 1999–2000.
Collins TC, Peterson NJ, Suarez-Almazor M, et al. The prevalence of peripheral arterial disease in a racially diverse population.
Aronow W. Prevalence of atherothrombotic brain infarction, coronary artery disease, and peripheral arterial disease in elderly blacks, Hispanics, and whites.
Criqui MH, Vargas V, Ho E, et al. Ethnicity and peripheral arterial disease: The San Diego Population Study. (Abstract).
Hiatt WR, Hoag S, Hamman RF. Effect of diagnostic criteria on the prevalence of peripheral arterial disease.
Zheng ZJ, Sharrett AR, Chambless LE, et al. Associations of ankle-brachial index with clinical coronary heart disease, stroke, and preclinical carotid and popliteal atherosclerosis: The Atherosclerosis Risk In Communities (ARIC) Study.
Bots ML, Hofman A, Grobbee DE. Common carotid intima-media thickness and lower extremity arterial atherosclerosis: The Rotterdam Study.
Allan PL, Mowbray PI, Lee AJ, et al. Relationship between carotid intima-media thickness and symptomatic and asymptomatic peripheral arterial disease: The Edinburgh Artery Study.
Oei HH, Vliegenthart R, Hak AE, et al. The association between coronary calcification assessed by electron beam computed tomography and measures of extracoronary atherosclerosis: The Rotterdam Coronary Calcification Study.
Criqui MH, Denenberg JO, Langer RD, et al. The epidemiology of peripheral arterial disease: importance of identifying the population at risk.
Fowkes FG, Housley E, Macintyre CC, et al. Variability of ankle and brachial systolic pressures in the measurement of atherosclerotic peripheral arterial disease.
Criqui MH, Fronek A, Barrett-Connor E, et al. The prevalence of peripheral arterial disease in a defined population.

