


Abstract
light-to-moderate alcohol consumption is protective against all-cause mortality and cardiovascular diseases. There is limited evidence in the literature on how alcohol consumption is related to frailty.
five databases (Embase, Scopus, MEDLINE, CINAHL, PsycINFO) were systematically searched in July 2016 for prospective studies published between 2000 and 2016 examining baseline alcohol consumption and subsequent frailty risk among middle-aged or older community-dwelling population. Odds ratios (ORs) for incident frailty were pooled using a random-effects model. Heterogeneity, methodological quality and publication bias were assessed.
of 926 studies identified by the systematic search, four studies were included (total n = 44,051, ≥55 years, 66.2% alcohol users). OR of incident frailty for the highest (at least 24 g of alcohol/day for men, 12g of alcohol/day for women) or the most frequent (≥5 days of drinking/week) alcohol consumption compared with no drinking were used for a meta-analysis. Pooled OR among three studies measuring alcohol consumption quantitatively showed that the highest alcohol consumption was associated with lower frailty risk (3 studies:pooled OR = 0.44, 95%CI = 0.19–1.00, P = 0.05). Adding the other study measuring frequency of alcohol consumption made little change (4 studies:pooled OR = 0.61, 95%CI = 0.44–0.77, P < 0.001). Two of the included studies suggested a possible U-shaped association with lowest risks for moderate drinkers. Heterogeneity was moderate in both analyses (I2 = 52–67%). There was no evidence of publication bias.
this systematic review and meta-analysis study provides the first pooled evidence suggesting that heavier alcohol consumption is associated with lower incident frailty compared with no alcohol consumption among community-dwelling middle-aged and older people. However, this association may be due to unadjusted effect measures, residual confounding, ‘sick quitter’ effect or survival bias.
Introduction
Alcohol consumption has been shown to be a cause of more than 200 diseases, particularly, liver cirrhosis, cardiovascular diseases and various cancers [1]. Health risks associated with alcohol use also include alcohol dependence, potential alcohol-drug interactions, falls and related injuries [1]. Its harmful use has been reported to result in 3.3 million deaths worldwide each year [1]. However, some epidemiological studies have shown U-shaped or J-shaped associations between alcohol and all-cause mortality, with decreased mortality risks in light-to-moderate drinkers compared with non- and heavy drinkers [2]. This protective effect of alcohol consumption has been long debated and controversial, lacking underpinning robust scientific evidence [3]. Some recent studies attributed the lower mortality in low-to-moderate drinkers to various biases. Such biases include misclassification as abstainers of former drinkers who reduce alcohol consumption when ill known as the ‘sick quitters’ effect, inappropriate selection of reference group, and poor study designs or inadequate adjustment for important confounders. Controlling for these factors attenuated or eliminated the apparent protective effect of alcohol [4–6]. However, it is difficult to determine causal inferences using conventional statistical methods. A recent Mendelian randomisation analysis using 261,991 European individuals concluded that increased alcohol consumption is associated with increased risk for coronary heart disease (CHD) among drinkers of any alcohol amount, including light-to-moderate drinkers [7]. This suggests that there are no such protective effects for CHD. Moreover, in older people alcohol consumption may be more harmful even at a low level compared with younger population. This is because of higher blood alcohol concentration due to age-related decreased proportion of water compartment to total body mass or potential alcohol-drug interactions [8].
Frailty is an age-related condition with increased vulnerability to adverse health outcomes [9], such as falls, fracture, disability, hospitalisation or institutionalisation [10–14], as a consequence of depleted physiological reserve [9]. Alcohol consumption may potentially contribute to the development of frailty by accumulating health deficits due to alcohol-related medical conditions. Conversely, alcohol may exert such protective effects as in lowering risks of mortality [2] and prevent developing frailty. Therefore it is beneficial to know relationships between frailty and alcohol as alcohol may be a modifiable risk factor for frailty and an important target in preventative frailty interventions.
There has been little research on prospective associations between alcohol use and frailty. An earlier systematic review [15] searched for publications between 2001 and 2013 and found only one prospective study on this topic [16]. However since this time it is expected that there have been more related publications as frailty has been extensively studied in recent years. We thus aimed to systematically search the literature for currently available evidence on the associations of alcohol consumption with subsequent frailty risk and to conduct a meta-analysis to synthesise a pooled estimate of alcohol consumption for risk of frailty.
Method
Search strategy and selection criteria
We conducted a systematic review in July 2016 according to a protocol developed based on Preferred Reporting Items for Systematic Review and Meta-Analyses (PRISMA) statement [17]. The protocol has been registered with PROSPERO (Registration number: CRD42016045445). We searched five electronic databases (Embase, Scopus, MEDLINE, CINAHL Plus and PsycINFO) for studies published between 2000 and 2016. The publication period was decided based on the fact that the most widely used definition of frailty, the so-called Fried phenotype, was published by Fried et al. using the Cardiovascular Health Study (CHS) cohort in 2001 [18]. Before then validated measurements of frailty were not generally used. The search was performed with an explosion function when available and without language restriction, using a combination of Medical Subject Heading (MeSH) terms and text (see Appendix 1 in the supplementary data, available at Age and Ageing online). Reference lists of the relevant articles were also hand searched for additional studies. The forward citation search of the included studies was performed using Google scholar in December 2016. Authors of potentially eligible studies were contacted for additional data necessary for a meta-analysis.
Any prospective studies were considered potentially eligible if they examined baseline alcohol consumption, including quantity or frequency, and subsequent frailty risk among middle-aged or older population in the community. Randomised controlled trials, reviews, conference abstracts, editorials and comments were excluded. When the same cohort was used by multiple studies, the study with the largest size was included. Titles, abstracts and full-texts of the studies identified by the systematic literature search were screened by two researchers of the review team (GK and AL) independently for eligibility. We solved any disagreement by discussion.
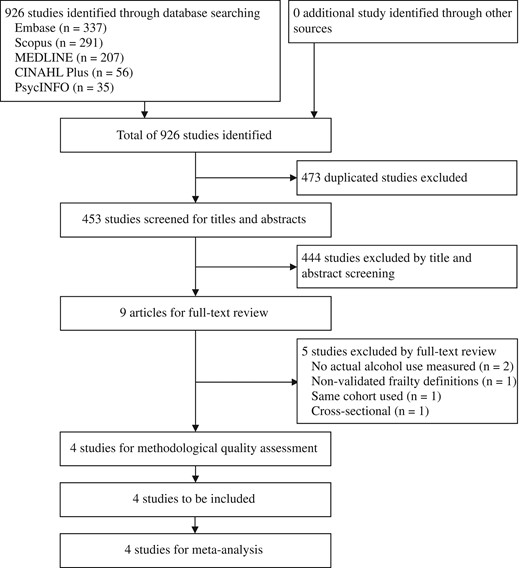
PRISMA flowchart.
Data extraction
The data extracted from each eligible study were first author, study cohort name if any, publication year, location, sample size, proportion of women, age (mean and range), alcohol measure, frailty criteria, follow-up period and findings, including an effect measure and covariates for adjustment. Alcohol consumption was calculated and converted to amount of pure alcohol in grams.
Methodological quality assessment
The studies considered as eligible through title, abstract and title screening were assessed for methodological quality using nine items of the Newcastle-Ottawa scale for cohort studies [19]. This scale is designed to evaluate methodological quality of a cohort study based on nine items over three domains: Selection (representativeness of the exposed cohort; selection of the non-exposed cohort; ascertainment of exposure; and demonstration that outcome of interest was not present at start of study), Comparability (comparability of cohorts on the basis of the design or analysis) and Outcome (assessment of outcome; was follow-up long enough for outcomes to occur; and adequacy of follow-up of cohorts). Although this scale has been widely used, it should be noted its inter-rater reliability has been questioned [20] and its external validation has yet to be examined [21]. A study meeting five items or more was considered to have adequate quality of methodology and was included in this review.
Statistical analysis
When two or more studies provided the same or equivalent effect measures, such as odds ratio (OR) or hazard ratio, alcohol variables and frailty outcomes, it was attempted to combine the effect measures to calculate pooled risk estimates. Necessary data were enquired for by contacting authors. The presence and degree of heterogeneity across the studies were examined using the chi-square test and I2 statistic, respectively. The I2 values of 25%, 50% and 75% were considered as low, moderate and high heterogeneity, respectively. The fixed-effects model assumes that there is one true effect size among all the included studies while the random-effects model assumes that the true effect size may vary from study to study. We used a random-effects model to calculated pooled risk estimates using the generic inverse variance method because included studies were expected to have different alcohol measurements, frailty definitions, populations, follow-up periods and covariates for adjustment. Publication bias was examined using Begg–Mazumdar's and Egger's tests.
The ORs of incident frailty were calculated based on the additional data provided by the authors of the original studies using StataSE 14 (StataCorp LP, College Station, Texas, USA). All meta-analyses were conducted using Review Manager 5 (version 5.2, The Cochrane Collaboration, Copenhagen, Denmark). P < 0.05 was considered as statistically significant.
Results
Selection process
The systematic search of the five databases yielded 926 citations. Of these studies, 473 duplicates were excluded and 444 studies were excluded by screening title and abstract, leaving nine studies for full-text review. Five of the nine studies were further excluded because they did not use measured alcohol consumption (n = 2), used a non-validated frailty definition (n = 1), used the same cohort with a smaller number of participants (n = 1) and was cross-sectional (n = 1) (Figure 1). All four studies used the CHS criteria [18] to define frailty with some modifications (see Appendix 2 in the supplementary data, available at Age and Ageing online). Each study was considered to have adequate methodological quality based on the Newcastle-Ottawa Quality Assessment Scale (mean score = 6.5, range = 5–8) [16, 22–24]. The selection and follow-up were considered to be the most important indicators for this review and were met by all the studies (see Appendix 3 in the supplementary data, available at Age and Ageing online).
Study characteristics
Table 1 presents the characteristics of the included studies, including 44,051 community-dwelling people aged at least 55 years, and findings of interest. Three studies [22–24] were published in recent years of 2014–16 and one study [16] was published in 2005. Three studies [22–24] were from European countries and one was from the US [16]. The study size ranged from 1057 [24] to 28,003 [16]. One study [16] included only women from the Women's Health Initiative Observational Study and the other three studies [22–24] used mixed cohorts with a female proportion of 52.2–57.3%. Age ranges of the participants were ≥55 years [23], >60 years [22], 65–70 years [24] and 65–79 years [16]. All four studies [16, 22–24] used modified versions of CHS criteria. Follow-up periods ranged from 2 [23] to 3.3 years [22]. One study [22] showed adjusted OR of incident frailty for alcohol quantity, and three studies [16, 23, 24] provided sufficient data, in the text or from the authors on request, to calculate crude OR of incident frailty for alcohol quantity [16, 24] or frequency [23].
Summary of studies examining associations between alcohol and frailty.
| Author/study | Year | Location | Sample sizea | Female (%)a | Age (range)a | Frailty criteria | Follow-up period | Alcohol measure | Findings |
|---|---|---|---|---|---|---|---|---|---|
| Ortola et al. ENRICA | 2016 | Spain | 2,086 | 52.2%b | 68.5b (≥60) | mCHS | 3.3 years | Usual consumption of alcoholic beverages in the previous year estimated with validated diet history | Logistic regression models for incident frailty adjusted for age, gender, education, smoking, time watching TV, leisure-time physical activity, household physical activity, Trichopoulou index, BMI, cardiovascular disease, diabetes, respiratory disease, osteomuscular disease, depression, IADL, SF-12 physical and mental component summary scores (non-drinker as reference)
|
| Etman et al. SHARE | 2014 | 11 European countriesc | 12,905 | 54.3% | 67.6 (≥55) | mCHS | 2 years | The number of days per week when participants were drinking alcohol during the last 6 months | Logistic regression models for worsening frailty compared with no change in frailty status adjusted for age, gender, education, baseline frailty and country (hardly ever/never drinker as reference, N = 14,082)
|
Unadjusted logistic regression models for incident frailty (calculated, non-drinker as reference, N = 12,905)
| |||||||||
| Seematter-Bagnoud et al. Lausanne cohort 65+ | 2014 | Switzerland | 1,057 | 57.3% | 67.0 (65–70) | mCHS | 3 years | The average number of standard drinks (wine, beer, spirits) consumed per week was estimated using the AUDIT-C questionnaire. | Unadjusted logistic regression models for incident frailty (calculated, non-drinker as reference)
|
| Woods et al. WHI-OS | 2005 | USA | 28,003 | 100.0% | − (65–79) | mCHS | 3 years | Self-report at baseline | Multinomial logistic regression models (non-drinker as reference)
|
Unadjusted logistic regression models for incident frailty (calculated, non-drinker as reference)
|
aCohort used for analysis of interest, or entire cohort.
bCalculated from available data.
cSweden, Denmark, Germany, the Netherlands, Belgium, Switzerland, Austria, France, Italy, Spain and Greece.
95%CI, 95% confidence interval; aOR, Adjusted odds ratio; ENRICA, El Estudio de Nutrición y Riesgo Cardiovascular en España; mCHS, Modified Cardiovascular Health Study criteria; OR, Unadjusted odds ratio; SHARE, Survey on Health, Ageing, and Retirement in Europe; WHI-OS, Women's Health Initiative Observational Study.
Ortola et al. used data of 2,086 community-dwelling men and women aged 60 and older in Spain to examine risk of incident frailty according to alcohol consumption [22]. Compared with non-drinkers, heavy drinkers (defined as consuming alcohol ≥40 g/day for men and ≥24 g/day for women) had a significantly lower risk of developing frailty over 3.3 years (OR = 0.24, 95%CI = 0.10–0.56) [22]. Incident frailty risks of moderate drinkers (defined as consuming alcohol <40 g/day for men and <24 g/day for women) and ex-drinkers compared with non-drinkers were non-significant (OR = 0.90, 95%CI = 0.65–1.25; OR = 1.04, 95%CI = 0.64–1.68, respectively) [22].
A large multinational study involving nationally representative samples aged 55 and older from 11 European countries classified the participants as frail, pre-frail and non-frail according to modified CHS criteria and examined risk of worsening in frailty status (from non-frail to pre-frail or frail, or from pre-frail to frail) over 2 years [23]. Compared with hardly ever/never alcohol use, consuming alcohol for 1–2 days, 3–4 days and 5–7 days per week was associated with 12–21% decreased risk of worsening frailty status (adjusted OR=0.84, 95%CI = 0.73–0.96; adjusted OR = 0.88, 95%CI = 0.73–1.06; and adjusted OR = 0.79, 95%CI = 0.71–0.88, respectively) although drinking for 3–4 days per week did not reach statistical significance [23].
The Women's Health Initiative Observational Study in the US followed 28,003 women aged 65–79 free of frailty at baseline for 3 years for incident frailty using a nominal multinomial logistic regression model [16]. Decreased risk was observed in women who consumed less than 1 drink per week (<2 g of alcohol/day) (OR = 0.87, 95%CI = 0.77–0.97) and 1–14 drinks per week (2–28 g of alcohol/day) (OR = 0.69, 95%CI = 0.61–0.77) while the risk of incident frailty was not significantly different in women who consumed more than 14 drinks per week (>28 g of alcohol/day) (OR = 0.93, 95%CI = 0.74–1.16), compared with non-drinkers [16].
In a prospective study from Switzerland, 840 robust community-dwelling older people in a narrow age range of 65–70 years without any of the five CHS criteria components at baseline were observed 3 years later for newly developing any of the five components [24]. Non-drinkers were found to have twice the risk of developing any of the five components (adjusted OR = 2.00, 95%CI = 1.02–3.91, P = 0.04) compared with light-to-moderate drinkers (men who consumed 12–168 g of alcohol per week and women who consumed 12–84 g of alcohol per week) [24]. Heavy drinkers, defined as consuming ≥144 g of alcohol per week for women and ≥240 g of alcohol per week for men, had no statistically significant lower risk (adjusted OR = 0.73, 95%CI = 0.34–1.58, P = 0.43), compared with the light-to-moderate drinkers [24]. These ORs were adjusted for a number of potential confounders, including age, gender, education, smoking, self-rated health, comorbidity, cognitive impairment, functional status, previous alcohol-related problem and significant changes in alcohol during the follow-up, which may have been over-adjustment and resulted in the non-significant association for the heavy drinkers [24].
Alcohol use and incident frailty risk
Three studies [16, 22, 24] measured alcohol consumption quantity and one study [23] used frequency measurement according to the number of days they were consuming alcohol. OR of incident frailty for the highest quantity of alcohol consumption or the most frequent alcohol use categories compared with no drinking was used for a meta-analysis. We initially pooled the OR of the three studies with the quantity alcohol measurements [16, 22, 24] using a random-effects model to show an almost significant reduced risk of incident frailty for the highest alcohol consumption (3 studies:pooled OR = 0.44, 95%CI = 0.19–1.00, P = 0.05). Adding another study [23] using frequency of alcohol use increased the OR from 0.44 to 0.61 and the association became statistically significant (4 studies:pooled OR = 0.61, 95%CI = 0.49–0.77, P < 0.001) (Figure 2).
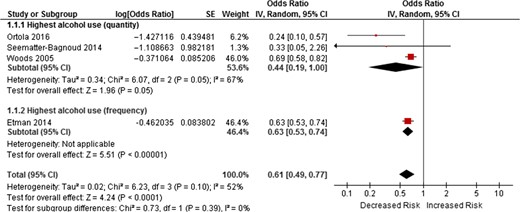
Forest plots of OR of incident frailty risk according highest alcohol use (quantity and frequency) compared with no alcohol use.
Begg–Mazumdar's and Egger's tests assessed publication bias among the four studies [16, 22–24] and showed no evidence of publication bias (P value > 0.10 for both tests).
Discussion
The current study has systematically searched the literature for currently available evidence and combined risk of incident frailty according to the alcohol consumption in community-dwelling middle-aged and older population (55 years and above). The findings of the included studies were mixed, showing that heavy alcohol consumption was significantly associated in three studies with decreased risk of incident frailty compared with those abstaining [16, 22, 23]. In contrast, heavy alcohol consumption was not associated with decreased risk of incident frailty in the remaining one study [24]. None of the included studies showed alcohol consumption significantly increased risk of incident frailty. The meta-analysis suggested that the highest quantity of alcohol consumption among the three studies [16, 22, 24] was associated with decreased risk of incident frailty with marginal statistical significance. After adding another study with alcohol drinking frequency [23], although the heaviest drinking groups defined by quantity and frequency may not be the same, the association changed to statistically significant. This change may be due to the large sample size of the forth study (n = 12,905) [23].
Possible U- or J-shaped associations were observed in two studies [16, 23]. One study created four groups based on the number of drinks per week, and moderate drinkers (1–14 drinks/week) had a lower frailty risk than non-drinkers, light drinkers (<1 drink/week) or heavy drinkers (>14 drinks/week) [16]. Another study used the number of days of drinking per week (hardly ever/never, 1–2 days/week, 3–4 days/week and 5–7 days/week) and showed that those drinking 1–2 days a week had the lowest risk of worsening frailty and those drinking 3–4 days a week had the lowest risk of incident frailty [23] (Table 1).
We included studies measuring alcohol consumption in quantity or frequency, however nature or patterns of alcohol consumption may also affect subsequent frailty status [25]. One of the included studies showed that a Mediterranean drinking pattern, defined as moderate alcohol intake (but no binge drinking) only with meals with ≥80% wine preference was significantly associated with lower incident frailty risks controlling for multiple confounders (OR = 0.68, 95%CI = 0.47–0.99) [22]. Another study examined trajectories of frailty over 8 years using the Frailty Index in 12,270 older people [26]. While this study did not measure alcohol quantity or frequency, it showed that those reporting concerns about alcohol use themselves or from relatives/friends were more likely to have worse frailty status at baseline and to belong to the worse frailty trajectory [26].
Alcohol consumption may have some theoretical benefits against frailty however, in general, there has been no evidence to support therapeutic use of alcohol for non-drinkers and it cannot be advocated that non-drinkers should start drinking, especially given the potential harms from alcohol [1]. The decreased risk of incident frailty with heavier consumption suggested in the meta-analysis of this study may be a biased finding as for methodological reasons the pooled estimate was based on the mostly unadjusted risk estimates. The important confounders would include age, gender, education, socioeconomic status, smoking, depressive symptoms and cognitive function. In addition, alcohol quantity cut-points used by the included studies to define the highest alcohol consumption groups varied: ≥40 g/day (men) and ≥24 g/day (women) [22], and >27 g/day [16, 24]. Binge drinkers, who may be at high risk of incident frailty and likely to be in the highest alcohol consumption categories, were not identified separately in any of the included studies. We therefore cannot draw any definite conclusions regarding the relationship of binge drinking to incident frailty, and this should be addressed in further research.
The underlying mechanisms for lower risk of incident frailty among the highest drinkers compared with non/past drinkers are not clear. Social components have been included in some multidimensional frailty criteria [27], and social vulnerability can negatively affect both mental and physical health, contributing to the development of frailty [28]. Alcohol is often consumed socially and moderate consumption was shown to facilitate social bonding [29], and may possibly help construct or reinforce social support or network and prevent social isolation. Another possibility is a ‘sick quitters’ effect that sick individuals who quit drinking or would not start drinking were classified as non-drinkers and healthier drinkers who continued to consume alcohol were classified as current drinkers, leading to an apparent lower risk of frailty among drinkers [24]. Other potential reasons would include residual confounding or survival bias. It should be also noted that the included studies are heterogeneous in terms of study populations, inclusion criteria and frailty assessment, therefore the results should be interpreted with caution. Casual analysis techniques of observational data, such as Mendelian randomisation analysis would be able to address at least some of these confounding factors and the issue of reverse causation (i.e. sick quitter hypothesis).
In terms of clinical implications, our findings would not support the reduction of alcohol consumption as an approach to reduce frailty risk. The research implications in light out of the findings of this review and the included studies are that further research in this area should both better define non-drinkers and heavy drinkers (e.g. those with harmful drinking levels) to tackle the potential heterogeneity of these two categories and explore reverse causality.
This study has some potential limitations. First, a relatively small number of studies were identified, probably because the association between alcohol and frailty has not yet been extensively studied. Especially given that we used a random-effect model, estimates of between-study variance may be less reliable based on the small number of studies [30]. Second, due to different cut-points or types of measurements of alcohol consumption employed by the studies, it was not possible to examine using a meta-analysis if there were U- or J-shaped associations between alcohol use and frailty like those between alcohol use and mortality. Third, while one study provided adjusted OR for incident frailty [22], the other three studies did not, therefore unadjusted OR was calculated and used in the meta-analysis [16, 23, 24]. The adjustment for potential confounders would attenuate the association and could even change the direction of the effect. Fourth, ‘non-drinkers’ were used as a reference group in the included studies. This group may include people who have stopped drinking for health reasons. Therefore there remains potential for a ‘sick-quitters’ effect. Fifth, the follow-up periods of the included studies were short, between 2 to 3.3 years. It may need longer time to observe the development of frailty among the drinkers. Due to these important limitations, especially the unadjusted OR and ‘sick-quitters’ effect, the results of this review must be interpreted with caution. Further research should address these points, by adjusting for important confounding factors, including better definition of ‘non-drinking’ group and using a different reference group.
The robust methodology in accordance with the PRISMA statement is a strength to the study. The systematic review of the literature was furthermore comprehensive and extensive and included searching five databases, screening of title, abstract and full-text by two independent researchers, assessments of heterogeneity, methodological quality and publication bias of the included studies. Furthermore, the meta-analysis was conducted to provide the pooled evidence.
Conclusion
This systematic review and meta-analysis study provides the first pooled evidence suggesting that heavier alcohol consumption is associated with lower incident frailty compared with no alcohol use among community-dwelling middle-aged and older people. This might be explained by reverse causality (‘sick quitters’, with individuals reducing/stopping alcohol consumption as they start to become more frail) or omitted variables hypothesis (uncontrolled confounding variables that explain the relationship). Future research should both fully adjust for potential confounding factors and examine various measures of alcohol intake, such as quantity, frequency, type or patterns (including harmful drinking), in relation to frailty.
Some epidemiological studies have shown health benefits in moderate alcohol use.
The relationship of alcohol use to frailty is not clear.
This systematic review identified four studies examining alcohol consumption and subsequent frailty risk in community-dwellers.
The highest alcohol use was associated with lower incident frailty risk than no drinking (OR = 0.61, 95%CI = 0.49–0.77, P < 0.001).
Important limitations, such as unadjusted analyses or residual confounding, ‘sick-quitters’ effect or survival bias, as alternative explanations for this finding should be noted.
Supplementary data
Supplementary data mentioned in the text is available to subscribers in Age and Ageing online.
Acknowledgement
We are grateful to the authors for sharing the data [23, 24].
Conflicts of interest
None declared.
Funding
GK is funded by a University College London (UCL) Overseas Research Scholarship, which did not have any influence on the study design, the collection, analysis, and interpretation of data, the writing of the article or the decision to submit it for publication.

Comments