


Introduction
In the past 10 years the importance of emotion in understanding psychosis has been increasingly recognized (Birchwood, Reference Birchwood2003; Freeman & Freeman, Reference Freeman and Freeman2008). The divide between psychosis and neurosis has been narrowed. In particular, a close association between anxiety and paranoia has been demonstrated. Anxiety has repeatedly been found to be associated with paranoid thoughts (e.g. Martin & Penn, Reference Martin and Penn2001; Johns et al. Reference Johns, Cannon, Singleton, Murray, Farrell, Brugha, Bebbington, Jenkins and Meltzer2004) and persecutory delusions (e.g. Freeman & Garety, Reference Freeman and Garety1999; Startup et al. Reference Startup, Freeman and Garety2007). Anxiety is predictive of the occurrence of paranoid thoughts (Freeman et al. Reference Freeman, Slater, Bebbington, Garety, Kuipers, Fowler, Met, Read, Jordan and Vinayagamoorthy2003, Reference Freeman, Garety, Bebbington, Slater, Kuipers, Fowler, Green, Jordan, Ray and Dunn2005a; Valmaggia et al. Reference Valmaggia, Freeman, Green, Garety, Swapp, Antley, Prescott, Fowler, Kuipers, Bebbington, Slater, Broome and McGuire2007) and the persistence of persecutory delusions (Startup et al. Reference Startup, Freeman and Garety2007). There is also emerging evidence that paranoid thoughts build upon common social anxieties such as fear of rejection (Freeman et al. Reference Freeman, Garety, Bebbington, Slater, Kuipers, Fowler, Green, Jordan, Ray and Dunn2005a, Reference Freeman, Garety, Bebbington, Smith, Rollinson, Fowler, Kuipers, Ray and Dunnb). A key impetus of this research has been to normalize psychotic experience and make it understandable. Nonetheless, paranoia and social anxiety are distinct experiences and differences in their causes need to be identified.
Studying persecutory ideation
There is a growing consensus that psychotic symptoms such as delusions are on a continuum with normal experience (e.g. Strauss, Reference Strauss1969; Chapman & Chapman, Reference Chapman and Chapman1980; Claridge, Reference Claridge1997; Van Os & Verdoux, Reference Van Os, Verdoux, Murray, Jones, Susser, van Os and Cannon2003). This view is based upon three lines of empirical evidence: the results of epidemiological surveys demonstrating that delusional ideation is not confined to psychotic groups (e.g. Eaton et al. Reference Eaton, Romanoski, Anthony and Nestadt1991; Van Os et al. Reference Van Os, Hanssen, Bijl and Ravelli2000); evidence of ‘aetiological continuity’ between non-clinical and clinical experiences (Myin-Germeys et al. Reference Myin-Germeys, Krabbendam and van Os2003); and findings that the risk of clinical disorder is increased by the earlier presence of low-level symptoms (Chapman et al. Reference Chapman, Chapman, Kwapil, Eckbald and Zinser1994; Poulton et al. Reference Poulton, Caspi, Moffitt, Cannon, Murray and Harrington2000). Although complete discontinuity between clinical and non-clinical experiences is unlikely, the exact nature of a paranoia spectrum remains to be established. If delusions are caused by a number of interacting factors then it is unlikely that there will be a normal distribution in the general population (see Van Os & Verdoux, Reference Van Os, Verdoux, Murray, Jones, Susser, van Os and Cannon2003). Instead, the distribution in the general population is likely to be skewed, with many people not having any delusional experiences (i.e. quasi-continuous). At an individual level there may also be non-linear shifts into clinical disorder. Nonetheless, the important implication for researchers is that studying non-clinical delusional ideation can inform the understanding of clinical phenomena, just as studying anxious or depressive states can inform the understanding of emotional disorders.
The study of persecutory ideation is beset by the problem of justified suspicions (Freeman, Reference Freeman2008b). This is a particular problem in investigating non-clinical phenomena. Individuals can experience real hostility from others, and paranoia questionnaires cannot rule out thoughts that are grounded in reality. Even using an interview assessment, it can be very difficult to establish the truth of the claims underlying a suspicious thought. Therefore, an experimental method has been pioneered to study paranoid thinking (Freeman et al. Reference Freeman, Slater, Bebbington, Garety, Kuipers, Fowler, Met, Read, Jordan and Vinayagamoorthy2003; Freeman, Reference Freeman2008a). This makes use of human responses being consistent between real and virtual worlds (Sanchez-Vives & Slater, Reference Sanchez-Vives and Slater2005). Virtual reality is used to present individuals with neutral social environments (e.g. a library, train carriage). It has been found that individuals' interpretations of the same environment vary greatly, from the positive to the negative, providing a striking illustration of the importance of appraisals in the experience of events. The key advantage of this method is that any paranoid thoughts that occur are known to be unfounded because the computer characters are not programmed to be hostile and behave in ways deemed by consensus to be neutral. No matter what a person does, the characters remain neutral in their responses.
The psychological understanding of paranoia
In the first large-scale study of the virtual reality method we tested 200 non-clinical individuals broadly representative of the UK population (Freeman et al. Reference Freeman, Pugh, Antley, Slater, Bebbington, Gittins, Dunn, Kuipers, Fowler and Garety2008). Predictors of paranoia were examined based upon a cognitive model of persecutory delusions (Freeman et al. Reference Freeman, Garety, Kuipers, Fowler and Bebbington2002; Freeman, Reference Freeman2007; Garety et al. Reference Garety, Bebbington, Fowler, Freeman and Kuipers2007; Freeman & Freeman, Reference Freeman2008). In the model it is hypothesized that individuals prone to paranoid ideation are trying to make sense of feelings of oddness caused by internal anomalies (e.g. hallucinations, perceptual anomalies, arousal). The causes of anomalies of experience include core cognitive dysfunction (e.g. Hemsley, Reference Hemsley2005), impairment in early-stage sensory processing (e.g. Butler & Javitt, Reference Butler and Javitt2005), illicit drug use (e.g. D'Souza et al. Reference D'Souza, Perry, MacDougall, Ammerman, Cooper, Wu, Braley, Gueorguieva and Krystal2004), hearing impairment (e.g. Zimbardo et al. Reference Zimbardo, Andersen and Kabat1981) and dopamine dysregulation (e.g. Kapur, Reference Kapur2003). A persecutory interpretation of the anomalies is likely to be formed in the context of negative affect. Suspicious thoughts are often preceded by stressful events (e.g. difficult interpersonal relationships, bullying, isolation). The stresses tend to happen against a background of anxiety, worry and related interpersonal concerns. It is hypothesized that anxiety is central in the threat (mis)interpretation of the internal events. The final piece of the puzzle is reasoning. Ideas of a persecutory content are more likely to become of a delusional intensity when there are accompanying biases in reasoning such as reduced data gathering (‘jumping to conclusions’) (Garety & Freeman, Reference Garety and Freeman1999; Van Dael et al. Reference Van Dael, Versmissen, Janssen, Myin-Germeys, van Os and Krabbendam2006) and a failure to consider alternative explanations (Freeman et al. Reference Freeman, Garety, Fowler, Kuipers, Bebbington and Dunn2004). Thus, emphasized in the psychological understanding of persecutory ideation are: anomalous experiences, which may be caused by core cognitive dysfunction and street drug use; affective processes, especially anxiety, worry and interpersonal sensitivity; reasoning biases, particularly belief confirmation, jumping to conclusions and belief inflexibility; and social factors, such as isolation and trauma. In the virtual reality study, key factors in the model – anxiety, worry, perceptual anomalies and cognitive flexibility – were all shown to predict paranoid reactions.
The differential prediction of social anxiety and paranoia
Social anxiety caused by the neutral social situation was also assessed in the general population study. Participants completed the Social Avoidance and Distress Scale (SAD) in relation to their experience of the virtual environment (Watson & Friend, Reference Watson and Friend1969). In this paper we report the factors that differentially predict the occurrence of social anxiety and paranoid thoughts in virtual reality. Although similarities between the two experiences are becoming evident, differences are of equal theoretical and clinical interest. Based on the persecutory delusions model, there was an a priori prediction that anomalies of experience would distinguish the prediction of paranoia and social anxiety. Entering a social situation when anxious will produce anxiety, but entering a social situation when anxious and having anomalies of experience will increase the likelihood of paranoid thinking. By contrast, it was expected that anxiety, depression, worry, interpersonal sensitivity and negative beliefs about the self would not distinguish the prediction of social anxiety and paranoia (i.e. affective processes contribute to the occurrence of both experiences). It was also hypothesized that reasoning style might be a differential predictor, but that this may be difficult to detect in a non-clinical study where the ability to correct interpretations may be protective against the development of clinical experiences.
Method
The procedure for each participant involved completion of a comprehensive psychological assessment, 5 minutes in an underground train virtual environment, followed by assessment of the experience.
Participants
A sample of the adult local population was recruited. A leaflet advertising a study of ‘people's reactions in virtual reality’ at the university was sent to all households in local postcodes. Participants were not informed before testing that the study was of paranoia or social anxiety. The main inclusion criterion was that participants were aged ⩾18 years. Potential participants were asked whether they had ever had a mental illness, been admitted to a psychiatric hospital, or been prescribed medication for such problems. Individuals reporting a history of severe mental illness (e.g. schizophrenia, bipolar disorder, affective psychosis) were excluded from the study. Individuals with a history of epilepsy were also excluded because of potential side-effects of virtual reality. Seven individuals with a history of severe mental illness and two individuals with a history of epilepsy were excluded. One hundred male and 100 female participants were recruited. They were paid £20 for their time. The occupationally based National Statistics Socio-economic Classification was used to categorize participants (Office for National Statistics, 2005). The study had received approval from the local research ethics committee.
Virtual reality
The head-mounted display used was a Virtual Research VR1280, which has a resolution of 1280×1024 in each eye, a 60° diagonal field of view and a refresh rate of 60 Hz. The tracking system used for the scenario was the Intersense IS900. The tracker uses a hybrid of inertial and ultrasonic sensors to determine the orientation and position of the user during the simulation. The sensors were laid out in a ceiling constellation grid above the user. The tracker data were accessed by a Virtual Reality Peripheral Network (VRPN) IS900 server.
The virtual reality environment comprised a 5-minute journey between two stops on an underground train that was populated by computer characters (see Fig. 1). The Distributed Immersive Virtual Environment (DIVE) software platform was used to create the overall scenario (Frecon et al. Reference Frecon, Smith, Steed, Stenius and Stahl2001). Both the train shell and the computer characters (‘avatars’) were created using 3D Studio Max. The avatar motions were made using an optical motion capture system. Each avatar had its own background motion that repeated throughout the scenario. Each avatar had one motion that approximated their breath and another motion that randomized the direction of their gaze. In addition, several of the avatars responded to participants' gaze by looking in their direction. One avatar would occasionally smile at the user when looked at. The audio for the scene, comprising background tube noise and low-level snippets of conversation, was rendered in stereo, without spatialization, using a Creative sound card.

Fig. 1. The virtual reality underground train.
Measures
Before entering the virtual environment participants completed a battery of assessments.
Intellectual functioning
Wechsler Abbreviated Scale of Intelligence (WASI; Wechsler, Reference Wechsler1999)
The WASI is a nationally standardized short and reliable measure of intelligence linked to the Wechsler Adult Intelligence Scale – Third Edition (WAIS-III; Wechsler, Reference Wechsler1997). The Vocabulary and Matrix Reasoning subtests were used in the current study.
Emotional processes
Depression Anxiety Stress Scales (DASS; Lovibond & Lovibond, Reference Lovibond and Lovibond1995)
The DASS is a 42-item instrument with three subscales measuring current symptoms of depression, anxiety and stress. Each of the subscales consists of 14 items with a 0–3 scale (0=did not apply to me at all, 3=applied to me very much). Higher scores indicate higher levels of emotional distress. The scale has been shown to be reliable and valid in a large UK non-clinical population (Crawford & Henry, Reference Crawford and Henry2003). The anxiety and depression subscales were used in the current study.
Penn State Worry Questionnaire (PSWQ; Meyer et al. Reference Meyer, Miller, Metzger and Borkovec1990)
The PSWQ is the most established measure of trait worry style and has been used in non-clinical and clinical populations (see review by Startup & Erickson, Reference Startup, Erickson, Davey and Wells2006). It assesses the tendency to worry but not the content of the thoughts. Each of the 16 items is rated on a five-point scale. Higher scores indicate a greater tendency to worry.
Worry Domains Questionnaire (WDQ; Tallis et al. Reference Tallis, Eysenck and Mathews1992)
The WDQ assesses the occurrence of a range of common (non-paranoid) worries (i.e. in contrast to the PSWQ, the scale assesses content). It has good psychometric properties (see Startup & Erickson, Reference Startup, Erickson, Davey and Wells2006). The scale contains 25 items using a five-point rating scale (from not at all to extremely). Higher scores indicate greater levels of worry.
Catastrophizing interview (Vasey & Borkovec, Reference Vasey and Borkovec1992)
The catastrophizing interview is an experimental assessment of worry style (see review of procedures by Davey, Reference Startup, Erickson, Davey and Wells2006). Individuals are asked what worries them about their main worry and this question is repeated for all their subsequent answers. The procedure is terminated when no further responses are given (i.e. the person can think of no more worries in the chain). Each answer is counted as a catastrophizing step. Increasing numbers of catastrophizing steps indicate a greater worry style.
Brief Core Schema Scales (Fowler et al. Reference Fowler, Freeman, Smith, Kuipers, Bebbington, Bashforth, Coker, Gracie, Dunn and Garety2006)
This measure, developed with non-clinical and psychosis groups, has 24 items each rated on a five-point scale (0–4). Four subscale scores are derived: negative beliefs about self, positive beliefs about self, negative beliefs about others and positive beliefs about others. Higher scores reflect greater endorsement of items.
Interpersonal Sensitivity Measure (Boyce & Parker, Reference Boyce and Parker1989)
This 36-item scale was designed to assess interpersonal sensitivity defined as undue and excessive awareness of, and sensitivity to, the behaviour and feelings of others. Self-statements are rated on a four-point scale (1=very unlike self, 2=moderately unlike self, 3=moderately like self, 4=very like self). High scores indicate greater interpersonal sensitivity. The psychometric properties of the scale were tested in non-clinical individuals, general practice attenders, and psychiatric patients.
Reasoning
Cognitive flexibility (Martin & Rubin, Reference Martin and Rubin1995)
This is a 12-item self-report scale assessing awareness that in any given situation there are options and alternatives, and the willingness and confidence to be flexible. Items are scores on a six-point scale (strongly agree to strongly disagree). Higher scores indicate greater levels of flexibility. Reliability and validity were established in a non-clinical sample.
Probabilistic reasoning (Garety et al. Reference Garety, Freeman, Jolley, Dunn, Bebbington, Fowler, Kuipers and Dudley2005)
Jumping to conclusions was assessed with a probabilistic reasoning task known as the ‘beads task’. Participants are shown a jar with 60 black beads and 40 yellow beads (‘the mainly black jar’) and a jar with 40 black beads and 60 yellow beads (‘the mainly yellow jar’). The jars are then hidden from view and the participant told that one of the jars has been selected by the experimenter. The participant is asked to request as many coloured beads as they would like before deciding from which of the two hidden jars the beads are drawn. The key variable used here is the number of beads requested before making a decision.
Anomalous experience
Cardiff Anomalous Perceptions Scale (CAPS; Bell et al. Reference Bell, Halligan and Ellis2006)
This 32-item questionnaire, developed in both non-clinical and psychosis groups, assesses perceptual anomalies such as changes in levels of sensory intensity, distortion of the external world, sensory flooding, and hallucinations. A higher score represents the reporting of a greater number of perceptual anomalies. The scale also has three factor scores. The first factor, temporal lobe experience, contains items such as ‘Do you ever think that everyday things look abnormal to you?’ and ‘Do you ever see shapes, lights, or colours even though there is nothing really there?’ The second factor, chemosensation, contains items such as ‘Do you ever notice that food or drink seems to have an unusual taste’ and ‘Do you ever smell everyday odours and think that they are unusually strong?’ The third factor, clinical psychosis, contains items such as ‘Do you ever hear your own thoughts spoken aloud in your head, so that someone near might be able to hear them?’ and ‘Do you ever hear voices commenting on what you are thinking or doing?’
Maudsley Addiction Profile (MAP; Marsden et al. Reference Marsden, Gossop, Stewart, Best, Farrell, Lehmann, Edwards and Strang1998)
The MAP was developed with a large sample from a substance abuse clinic. Respondents are asked directly about the use over the past month of illicit drugs, including cannabis, cocaine powder, crack cocaine, heroin, amphetamines and methadone.
Social
Life Stressor Checklist (Wolfe & Kimerling, Reference Wolfe, Kimerling, Wilson and Keane1997)
The checklist asks respondents about the occurrence of a range of severe life events (e.g. serious accident, physical attack, sexual abuse). If the respondent reports the occurrence of an event, subsequent questions ask when the event happened, whether the person thought at the time serious harm or death could result, and whether feelings of intense helplessness, fear or horror occurred. Only events that reached the severity criterion related to post-traumatic stress disorder diagnosis were scored. The total number of traumatic events, the total number of victimization events, the number of childhood traumatic events, and the number of traumatic events in the past year were recorded. The psychometric properties of the measure are reported by McHugo et al. (Reference McHugo, Caspi, Kammerer, Mazelis, Jackson, Russell, Clark, Liebschutz and Kimerling2005).
Social Support Questionnaire (SSQ; Sarason et al. Reference Sarason, Sarason, Shearin and Plerce1987)
The short-form of the well-established SSQ (Sarason et al. Reference Sarason, Levine, Basham and Sarason1983) was used. Each of the seven items has two parts. The first part assesses the number of people the respondent believes they can turn to in times of need (e.g. ‘Whom can you really count on to be dependable when you need help?’). The second part measures the degree of satisfaction with that support. Two scores are derived: the number or perceived availability score and the satisfaction score. Higher scores indicate greater perceptions of social support.
Social and Emotional Loneliness Scale for Adults (DiTommaso & Spinner, Reference DiTommaso and Spinner1993)
This 37-item self-report questionnaire, developed in a non-clinical sample, has three subscales: romantic, family, and social loneliness. Each item is rated on a seven-point scale (ranging from strongly disagree to strongly agree). Higher scores indicate greater levels of loneliness.
Measures of the virtual reality experience
After being in the virtual environment, participants completed self-report measures of persecutory thinking and social anxiety and visual analogue rating scales.
State Social Paranoia Scale (SSPS; Freeman et al. Reference Freeman, Pugh, Green, Valmaggia, Dunn and Garety2007)
The SSPS has 10 persecutory items each rated on a five-point scale (e.g. ‘Someone stared at me in order to upset me’, ‘Someone was trying to isolate me’, ‘Someone was trying to make me distressed’). The items conform to a recent definition of persecutory ideation (Freeman & Garety, Reference Freeman and Garety2000). Scores can range from 10 (no paranoia) to 50. The SSPS has excellent internal reliability, adequate test–retest reliability, convergent validity with both independent interviewer ratings and self-report measures, and divergent validity with regard to measures of positive and neutral thinking. In the current study the internal reliability of the questionnaire was high (Cronbach's α=0.90). A person was classified as having (at least some) paranoid thinking if they endorsed one of the paranoid items (i.e. scored 11 or above).
Social Avoidance and Distress Scale (SAD; Watson & Friend, Reference Watson and Friend1969)
The SAD was designed to assess social anxiety. A True–False format is used for each item. Higher scores indicate higher levels of social anxiety. Participants were asked to fill in the questionnaire with reference to their experience in the virtual room. SAD items were reworded where necessary. For example, the item ‘I usually feel relaxed when I am with a group of people’ was changed to ‘I felt relaxed with the group of people’. Based upon the original paper it was decided a priori that a score >7 (which was the median) would indicate the presence of social anxiety.
Visual analogue rating scales (VAS)
To check the validity of the post-virtual reality assessments, participants also marked on two separate 10-cm lines the degree to which the people on the tube were experienced as hostile and how socially anxious the participant felt. Higher ratings indicated greater endorsement of the characteristic.
Analysis
Analyses were carried out using Stata version 9 (StataCorp, 2005). To look at differences in predictors of the occurrence of paranoia and social anxiety, two binary outcomes were created for each participant from the SSPS and the SAD: the presence of paranoia (>10 SSPS score) and the presence of social anxiety (>7 SAD score). Binary outcomes were created due to the skewed distributions of the dependent variables. The data file was structured so that there were two records for each participant. The first contained all of the covariate information together with the binary indicator of paranoia. The second contained the same covariate information together with the binary indicator of social anxiety. The binary outcomes indicating paranoia and anxiety shared the same variable name but a further variable (Type) was created to indicate whether the record corresponded to paranoia or to anxiety (Type=1 for paranoia and Type=2 for anxiety). To analyse such a binary bivariate outcome, the marginal modelling technique bivariate logistic regression was used (Fitzmaurice et al. Reference Fitzmaurice, Laird, Zahner and Daskalakis1995; Dunn, Reference Dunn2000), linking the two records for each participant by a cluster variable specified to be the participant's ID number. The main advantage of the bivariate logistic design is that a single regression model is fitted, instead of two separate regression models being used, which would create separate coefficients that are not easily comparable and would not allow for the regressions being measured on the same individual.
In the analysis each predictor was modelled separately as an interaction with the indicator variable Type. This is the key test for the study and indicates whether the effect of the given putative predictor is different for social anxiety and paranoia. Within the Type variable paranoia was always set as the reference category, hence the interaction value represents the interaction with social anxiety, or the change in effect between social anxiety and paranoia. In each case the direct (unadjusted) effects are first reported. The unadjusted analysis will show the direct relationship between the predictor and the outcome; however, these direct relationships may be caused by an extraneous variable or confounder. Confounders are variables that are associated with the predictors and also influence the outcome (response). Failure to allow for this in the statistical analysis leads to distortions (bias) in the estimate of the effect of the predictors. Therefore, also reported are the adjusted effects for a set of constant covariates, which comprised age, sex, ethnicity, IQ, education, use of computer games, use of the London underground, socio-economic status, PSWQ, catastrophic worry interview, cognitive flexibility, anomalous experiences, illicit drug use, and ‘Jumping to Conclusions’. The covariates were deemed a priori to be clinically important predictors of paranoia and/or social anxiety. To achieve a set of fully adjusted effects the model included the main effects of each confounder and their interaction with Type effect. All hypothesis testing was two-tailed. Odds ratios (ORs) and 95% confidence intervals (CIs) are reported.
Results
Demographic and clinical data
The average age of the participants was 37.5 years (s.d.=13.3, minimum=18, maximum=77). The mean IQ score was 104.6 (s.d.=12.0, minimum=69, maximum=133). Further basic information on the participants is presented in Table 1. There is a spread of participants across socio-economic categories, and the proportion in each category is broadly representative of the UK population. Table 2 shows that there is a good range in the symptom scores of the participant group.
Table 1. Demographic data

Table 2. Assessment scores
s.d., Standard deviation.
Social anxiety and paranoia
The visual analogue ratings were used to validate the classifications from the SSPS and SAD. Individuals with social anxiety (mean=4.4, s.d.=2.8) scored higher on the VAS of social anxiety than individuals without social anxiety (mean=1.2, s.d.=1.6, t=–7.6, df=57.2, p<0.001). Individuals with paranoia (mean=2.3, s.d.=1.9) scored higher on the VAS of hostility by the computer characters than the individuals without paranoia (mean=0.8, s.d.=1.4, t=5.9, df=170.6, p<0.001). Ninety-three people had no paranoia or social anxiety, 59 people had paranoia and social anxiety, 36 people had paranoia without social anxiety and 12 people had social anxiety without paranoia.
Differential predictors
The differential predictor analysis is reported in Table 3. For the interpretation of the results it should be noted that for continuous scales the ORs refer to 1-point changes; if the OR for a unit change in the independent variable is, for example, 1.10 then the OR for a 10-point increase is 1.10 raised to the power of 10 (i.e. 2.59). For unadjusted effects, only one variable had a significant interaction, Positive Self (p value=0.006). As positive self increases by 1 unit the odds decrease by 0.97 for paranoia and 0.87 (0.97×0.90) for social anxiety.
Table 3. The differential prediction of anxiety and paranoia
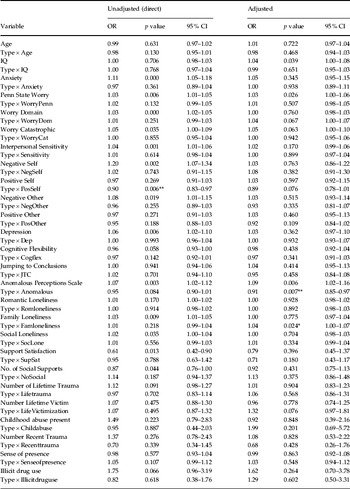
OR, Odds ratio; CI, confidence interval.
Interaction effects: * p<0.05, ** p<0.01.
The unadjusted effects do not take into account any confounding caused by other factors and hence true effects may be masked or misleading. Table 3 also displays the effects produced for each predictor when adjusted for the set of potential confounders. Two clinical variables, anomalies of experience and family loneliness, significantly differed in their relationships with paranoia and social anxiety. Anomalies of experience is highly statistically significant (p=0.007), indicating that the effect of anomalous experience is different for paranoia and social anxiety. The effect is represented as an OR for paranoia of 1.09 but for social anxiety 0.99 (1.09×0.91). This means that, within paranoia, the odds increase by 1.09 as the anomalies of experience scale increases by 1 unit; however, within social anxiety the odds decrease by 0.99 as the scale increases by 1 unit. An increase on the family loneliness scale does not affect the occurrence of paranoia but increases the odds of social anxiety by 1.04.
The CAPS assesses a wide range of phenomena, from subtle perception distortions to auditory hallucinations. It was of interest to determine whether it was only the presence of clinical psychosis-like symptoms that separated the two experiences. In a post hoc analysis, the analysis was repeated using the three factors of the scale (temporal lobe epilepsy, chemosensation, clinical psychosis) and also a variable that comprised items that could not be thought of as psychosis-like symptoms (items 1, 15, 16, 17, 18, 20, 21, 22, 23, 25, 26, 30). Table 4 shows that the differential relationship is not simply explained by the presence of clinical psychosis symptoms. The unadjusted affects do show a relationship for the subscale Chemosensation (p value=0.041). In this case the OR is calculated to be 1.14 within paranoia but 0.97 (1.14×0.85) within the social anxiety group.
Table 4. Differential prediction using the subscales of the anomalous perceptual experiences scale

OR, Odds ratio; CI, confidence interval.
Interaction effects: * p<0.05.
Discussion
This is the first study to examine rigorously the differential prediction of social anxiety and persecutory ideation. Using a sophisticated statistical analysis, the relationships of psychological and social variables to well-established measures of paranoia and social anxiety were tested in a non-clinical population. The results are intriguing. Foremost, it was the assessment of perceptual anomalies that differentially predicted paranoid and social anxiety reactions. Individuals with paranoid reactions were prone to internal anomalous experience, whereas individuals with social anxiety reactions were less prone to internal anomalous experience. It was not simply psychosis-like anomalies but a wide range of perceptual experiences, from the mild to the severe, that predicted psychological reactions. For instance, items in the chemosensation subscale, which mainly relate to olfactory and gustatory experiences, include: ‘Do you ever smell everyday odours and think that they are unusually strong?’, ‘Do you ever think that food or drink tastes much stronger than it normally would?’, ‘Do you ever find that your skin is more sensitive to touch, heat or cold than usual?’ The importance of perceptual anomalies to paranoia is consistent with the cognitive model of paranoia. Having odd internal feelings in social situations may lead to delusional ideas through a sense of ‘things not seeming right’. However, an important caveat is that the nature of the association of paranoia and perceptual anomalies was not established in the study. Anomalies at the time of testing were not assessed. A causal role can only be established in a study that manipulates anomalies of experience, in a randomized controlled design similar to the report by Zimbardo et al. (Reference Zimbardo, Andersen and Kabat1981). Such causal designs are now indicated in research on the psychology of psychosis.
The emphasis in the report has been on identifying differences between anxious and suspicious thinking. However, the absence of differences for the majority of the variables is a striking finding. Participants' levels of anxiety, depression, worry and interpersonal sensitivity had similar relationships to both social anxiety and paranoia. This very much confirms recent ideas about the contribution of anxiety to paranoid experience, but challenges the more traditional view of clear-cut distinctions between psychotic and emotional problems. Paranoia can be conceptualized as a type of anxious fear. The clinical implication is that approaches used to treat anxiety disorders, suitably modified, will also be of benefit to people with paranoia (Freeman et al. Reference Freeman, Freeman and Garety2006). This is an emerging research strategy that focuses on experiences such as paranoid thoughts, not on diagnoses such as schizophrenia, and treats problems as on a continuum of severity in the population.
There were a number of limitations to the study that should be kept in mind. Multiple hypothesis testing was carried out, raising the likelihood of the occurrence of Type I errors, although the results were broadly consistent with the current theoretical understanding of paranoia. Furthermore, the dependent variables had considerable skew, leading to their dichotomization and a reduction in statistical power. Inevitably the identification of paranoid thinking and social anxiety depends on self-report. The study therefore relied on people being able to report their thoughts from the time spent in virtual reality. The participants were volunteers, responding to a leaflet distributed to local postcodes, who did not know beforehand that they were taking part in a study of paranoia. They were broadly representative of the UK in terms of employment status. However, this recruitment method is unlikely to have resulted in a truly representative sample of the population being tested. It is also clear that this is a study of low-level persecutory and anxious thinking. Similar studies looking at differential prediction in more severe instances would be of great interest.
Acknowledgements
This research was supported by a Wellcome Trust Fellowship awarded to D. F.
Declaration of Interest
None.


 Open access