


Abstract
Denosumab, a human monoclonal antibody against RANKL, reversibly inhibits osteoclast‐mediated bone resorption and has been developed for use in osteoporosis. Its effects on bone histomorphometry have not been described previously. Iliac crest bone biopsies were collected at 24 and/or 36 months from osteoporotic postmenopausal women in the FREEDOM study (45 women receiving placebo and 47 denosumab) and at 12 months from postmenopausal women previously treated with alendronate in the STAND study (21 continuing alendronate and 15 changed to denosumab at trial entry). Qualitative histologic evaluation of biopsies was unremarkable. In the FREEDOM study, median eroded surface was reduced by more than 80% and osteoclasts were absent from more than 50% of biopsies in the denosumab group. Double labeling in trabecular bone was observed in 94% of placebo bones and in 19% of those treated with denosumab. Median bone‐formation rate was reduced by 97%. Among denosumab‐treated subjects, those with double labels and those with absent labels had similar levels of biochemical markers of bone turnover. In the STAND trial, indices of bone turnover tended to be lower in the denosumab group than in the alendronate group. Double labeling in trabecular bone was seen in 20% of the denosumab biopsies and in 90% of the alendronate samples. Denosumab markedly reduces bone turnover and also reduces fracture numbers. Longer follow‐up is necessary to determine how long such low turnover is safe. © 2010 American Society for Bone and Mineral Research.
Introduction
Postmenopausal bone loss results from increased bone resorption relative to formation, which is the product of reduced estrogen levels and a consequent loss of inhibition of bone resorption.1 As a result, the most widely used therapies for osteoporosis have been antiresorptives, initially estrogen itself and more recently bisphosphonates. Bisphosphonates bind to bone surfaces, from which they are taken up by osteoclasts, reducing their ability to resorb bone.2 Reduced bone turnover, increased bone mineral density (BMD), and fewer fractures result from the clinical use of these drugs in osteoporosis,3, 4 and they also have been used in oncology to prevent skeletal‐related events. Long‐term adherence with oral bisphosphonate therapy has been suboptimal, limiting their effectiveness.5 Intravenous preparations, administered at 3‐ or 12‐month intervals, have been developed to address this problem but are not acceptable to all patients because of the possibility of an acute‐phase response (a flulike illness occurring in about 30% of subjects after the first dose of bisphosphonate), lack of facilities for intravenous infusions in some physicians' practices, and concern about reversibility of drug action.
An alternative strategy for inhibiting bone resorption in both osteoporosis and oncology is to block endogenous factors that stimulate osteoclast recruitment. Key among these is RANK ligand (RANKL), which is essential for the formation, function, and survival of osteoclasts.6–10 Denosumab is a fully human monoclonal antibody against RANKL that binds RANKL and prevents its interaction with RANK on osteoclasts and osteoclast precursors. Thus denosumab reversibly inhibits osteoclast‐mediated bone resorption. In previous trials, subcutaneous denosumab 60 mg every 6 months has been shown to reduce bone turnover and increase BMD,11–14 and it also has been shown to reduce fracture risk in the FREEDOM study, a randomized, double‐blind trial in postmenopausal women with osteoporosis. Vertebral fractures were reduced by 68%, hip fractures by 40%, and all nonvertebral fractures by 20%.15 Denosumab thus shows promise as a therapy for osteoporosis.
For a new bone‐active medication to come into clinical use, it must be shown to be both safe and effective. Both safety and efficacy are judged principally from clinical outcomes, supplemented by assessments of BMD (a surrogate efficacy endpoint in osteoporosis studies), bone turnover markers (to give insight into the mechanism of action), and bone histology and histomorphometry, which address both safety and mechanism of action. The key information provided by bone biopsies is an assessment of the quality of bone tissue, including mineralization and microstructure, which are essential safety parameters. In addition, histomorphometry provides a detailed direct assessment of bone remodeling.
This article presents the first report of histology and quantitative histomorphometry findings with denosumab. In addition, micro–computed tomography (µCT) has been performed on some of these biopsies, permitting assessment of bone microarchitecture and density in three dimensions. The trials contributing biopsies to this analysis were FREEDOM, a comparison of denosumab and placebo in osteoporotic postmenopausal women, and STAND,16 a study of denosumab use in women previously treated with alendronate. Together these studies provide biopsy material after 12, 24, and 36 months of denosumab use.
Materials and Methods
Study populations
Subjects included in this report were enrolled in one of two phase 3 clinical trials, FREEDOM15 or STAND,16 both of which have been described in detail elsewhere.
The Fracture REduction Evaluation of Denosumab in Osteoporosis every 6 Months (FREEDOM) study was a 36‐month randomized, double‐blind, placebo‐controlled phase 3 trial. Participants were randomized to receive either denosumab 60 mg administered as a subcutaneous injection every 6 months or placebo. Participants were ambulatory postmenopausal women from 60 to 90 years of age with a bone mineral density (BMD) T–score of less than –2.5 at the lumbar spine or total hip and greater than –4.0 at both sites. Women were excluded if they had used oral bisphosphonates for more than 3 years or if they had taken oral bisphosphonates for more than 3 months and the last dose was within 1 year of enrollment.
The Study of Transitioning from AleNdronate to Denosumab (STAND) was a 12‐month randomized, double‐blind, double‐dummy, active‐comparator phase 3 trial.16 It was carried out to determine whether switching directly from long‐term alendronate treatment to denosumab caused any specific problems, including development of abnormalities in bone histology. Subjects received either a subcutaneous denosumab 60‐mg injection every 6 months plus an oral placebo tablet once weekly or a placebo injection every 6 months plus a weekly oral alendronate tablet (Fosamax 70 mg, Regional Bone Center, Merck). Subjects were ambulatory postmenopausal women 55 years of age or older with BMD T‐scores of between –2.0 and –4.0 at the lumbar spine or total hip. All participants had 6 months or more of prior alendronate treatment.
Subjects in both studies were provided with daily calcium and vitamin D supplements. Both studies excluded women who had a disease or condition known to affect bone metabolism, as well as patients with prior intravenous bisphosphonate use. At study centers involved in the bone biopsy substudies, all enrolled subjects were invited to have biopsies, other than those unable to take tetracycline drugs. The studies were approved by the ethics committees at each study site, and subjects provided written informed consent.
Bone biopsy procedure
Subjects underwent bone biopsies in the 56 days before the month 24 and/or month 36 visits in the FREEDOM study and in the 30 days before the month 12 visit in the STAND. All subjects scheduled for biopsy followed a double‐tetracycline labeling procedure as follows: tetracycline hydrochloride for the first 3‐day cycle, a 14‐day interval without tetracycline, demeclocycline for a second 3‐day cycle, followed by biopsy 5 to 14 days after the last dose of demeclocycline. If only one tetracycline derivative was available in a center, it was used for both the first and second cycles. The dose of tetracycline was 250 mg four times a day for 3 days, and the dose of demeclocycline was 150 mg four times a day for 3 days. Subjects were instructed to take each dose 1 to 2 hours before a meal or 2 hours after a meal. Urine samples for tetracycline measurements were collected within 24 hours of the last dose of the first tetracycline labeling period to confirm compliance.
Transiliac bone biopsies were obtained from the anterior iliac crest using a Bordier/Meunier trephine (diameter 7 to 8 mm). Specimens were stored and shipped in 70% ethanol and then dehydrated and embedded in glycol methacrylate at the Bone Histomorphometry Laboratory of the Mayo Clinic (Rochester, MN, USA), where histomorphometric analyses were performed. All analyses were prespecified in study procedures for the respective trials and were carried out without knowledge of the subject's treatment allocation.
µCT
The embedded samples from the FREEDOM study were sent to (Thousand Oaks, CA, USA) Amgen before histomorphometry was carried out for µCT measurements using a GE eXplore Locus SP scanner (GE Healthcare, London, Ontario, Canada). Scans were performed at 0.5‐degree rotations for 200 degrees (80 kVp, 80 µA) with a resolution of 18 µm. The reconstructed images were downsampled to 27 µm, Gaussian smoothed (1 pixel radius), and reoriented to align the axes with one cortex (GE MicroView, Version 2.1.2, GE Healthcare). Separate regions of interest (ROIs) were drawn within the trabecular region and around each cortex using the semiautomated contouring algorithm. The trabecular ROI was analyzed for volumetric bone mineral density (vBMD) and other trabecular parameters at a threshold of 350 mg/cc. Trabecular vBMD was generated with and without thresholding, corresponding to “tissue” and “regional” vBMD values. Cortical volume was determined for each cortex using a threshold of 530 mg/cc but including internal pores less than 9 pixels in diameter. Cortical porosity was calculated as the percent of the cortical volume with density below 530 mg/cc. Cortical thickness was determined by dividing the cortical volume by the area of a cortical slice oriented along the midplane axis of the cortex. Cortical vBMD also was calculated from the cortical volume after thresholding. All cortical parameters are reported as an average of the data from both cortices.
Histomorphometry
Biopsies were cut at 10‐µm sections to expose a reproducible sampling area, after which 5‐µm sections were cut for analysis. The first of these was examined unstained for tetracycline fluorescence in trabecular bone. If this was present, adjacent sections were stained with Goldner's trichrome for measurement of static histomorphometric parameters and with hematoxylin and eosin and toluidine blue for qualitative assessment by a hematopathologist. Unstained sections that contained tetracycline labels were used for measuring dynamic histomorphometric parameters. Three sets of slides, 250 µm apart, were similarly assessed. Quantitative histomorphometry was based on a total assessed tissue area of 20 mm2 from these three levels.
If the first unstained section did not show tetracycline fluorescence, then every tenth section was examined until tetracycline fluorescence was found. This section was used as the index slide, and the three groups of slides just described were prepared at 250‐µm intervals. Examination at 50‐µm intervals was continued throughout the entire biopsy, if necessary, to identify tetracycline labels (extended label search).
Histomorphometric analysis was performed using a light microscope interfaced with an image‐analysis system (OsteoMetrics, Decatur, GA, USA). Histomorphometric parameters were calculated using OsteoMeasure software, Version 4.10, employing the ASBMR nomenclature.17
Statistical analysis
Analysis included data from all subjects who received one or more doses of investigational product and had one or more evaluable biopsies during the study. For biopsies with only single labels in trabecular bone within the measurement field of 20 mm2, a value of 0.3 µm/day was imputed for mineral apposition rate and used to derive other dynamic parameters, as recommended by Hauge and Foldes.18, 19 Biopsies with single and/or double labels that were located only in cortical bone or were outside the measurement field in trabecular bone were excluded from these analyses. Between‐group treatment differences for histomorphometric and µCT variables were evaluated using the Wilcoxon rank‐sum test.
Role of the funding source
A steering committee consisting of a majority of investigators who were not employed by the study sponsor planned the analyses for the article, and two investigators (IRR and DWD) wrote the first draft of the manuscript. The committee members and authors approved the manuscript and vouch for the accuracy of the data. Analyses were performed by the sponsor, and the authors received all analyses they requested. The sponsor designed the protocol with advice from external investigators and was responsible for the management and quality control of data collected by the clinical sites.
Results
FREEDOM
One‐hundred and three women (placebo 51, denosumab 52) enrolled in the bone biopsy substudy, of whom 92 had at least one biopsy. Their demographic data were comparable with those of the total trial cohort, except that in the placebo group the biopsied women were slightly younger and the proportion who were white was lower (Table 1). There were no differences in the denosumab group between those who had biopsies and the whole denosumab group. Sixty‐eight subjects (placebo 37, denosumab 31) had biopsies at 24 months, 47 (placebo 25, denosumab 22) had biopsies at 36 months, and 23 (placebo 17, denosumab 6) had biopsies at both time points. Thus 115 biopsies were obtained from 92 subjects, although not all biopsies were adequate for all evaluations, so the number of results for each endpoint vary. All but one of the denosumab subjects had received all doses of study drug at the time of the biopsies. One woman biopsied at 36 months received only the first three doses of denosumab. All subjects complied with tetracycline dosing, and this was confirmed by positive tests for tetracycline in all urine samples—one subject from each group did not provide a urine sample, but their biopsy data are included in the analyses.
Demographic Data of the Women in the FREEDOM Trial
| Bone biopsy substudy | Total trial cohort | ||||
| Placebo (n = 45) | Denosumab (n = 47) | Placebo (n = 3906) | Denosumab (n = 3902) | p* | |
| Age (years) | 70.0 ± 6.3 | 72.0 ± 5.2 | 72.3 ± 5.2 | 72.3 ± 5.2 | .03 |
| Years since menopause | 23.0 ± 8.1 | 24.9 ± 7.3 | 24.2 ± 7.5 | 24.2 ± 7.4 | .6 |
| Body mass index | 26.1 ± 4.0 | 26.2 ± 4.2 | 26.0 ± 4.2 | 26.0 ± 4.1 | .8 |
| Ethnicity (% white) | 82 | 89 | 93 | 92 | .03 |
| Bone mineral density T‐score | |||||
| Lumbar spine | −2.9 ± 0.5 | −2.9 ± 0.5 | −2.8 ± 0.7 | −2.8 ± 0.7 | .8 |
| Total hip | −1.8± 0.8 | −2.0 ± 0.8 | −1.9 ± 0.8 | −1.9 ± 0.8 | .4 |
| Femoral neck | −2.0 ± 0.7 | −2.3 ± 0.7 | −2.2 ± 0.7 | −2.2 ± 0.7 | .1 |
Data are mean ± SD
ANOVA across all four groups.
Qualitative evaluation of biopsies disclosed normal lamellar bone, normal mineralization (ie, absence of osteoid accumulation), and absence of marrow fibrosis in all subjects. There was a qualitative absence of osteoid in five denosumab‐treated subjects, but three of these biopsies showed tetracycline labels. In a denosumab subject, “lymphoid aggregates” were noted at month 24 but were absent at month 36, and there was no other laboratory or clinical evidence of a bone marrow abnormality in this woman.
Histomorphometric indices were tabulated for the 24‐ and 36‐month samples separately (Table 2). There were no significant differences within the denosumab group between 24 and 36 months, so the data have been pooled to provide greater statistical power (Table 2A). Structural indices assessing the amount of bone showed no differences between treatment groups. In addition to the indices shown, trabecular thickness, separation, and number also were similar between groups. Static measures of bone formation were reduced, although wall thickness was similar between groups. Consistent with the reduced turnover, median eroded surface was reduced by more than 80% in the denosumab‐treated subjects, and osteoclasts were absent from more than half the denosumab biopsies.
Histomorphometric Indices at 24 or 36 Months in Women in the FREEDOM Study
| A. Data Pooled for Both Time Points | |||||
| Index | Placebo (n = 45) | Denosumab (n = 47) | |||
| n | n | pa | |||
| Structural | |||||
| Trabecular bone volume (BV/TV, %) | 38 | 12.5 (9.4–17.4) | 38 | 13.5 (10.3–15.9) | .67 |
| Cortical width (mm) | 43 | 0.765 (0.536–1.099) | 47 | 0.658 (0.444–1.068) | .24 |
| Formation | |||||
| Osteoid surface (%) | 38 | 6.81 (3.61–10.10) | 38 | 0.39 (0.16–1.22) | <.0001 |
| Osteoid width (µm) | 38 | 8.70 (6.36–11.0) | 38 | 5.44 (4.36–7.43) | <.0001 |
| Osteoid volume | 38 | 0.83 (0.46–1.33) | 38 | 0.05 (0.01–0.11) | <.0001 |
| Wall thickness (µm) | 38 | 47.5 (39.6–56.1) | 38 | 43.6 (39.4–53.5) | .38 |
| Dynamic | |||||
| Mineralizing surface (%) | 37 | 3.08 (1.73–6.29) | 7 | 0.12 (0.12–0.32) | <.0001 |
| Mineral apposition rate (MAR, µm/day) | 37 | 0.75 (0.66–0.83) | 7b | 0.30 (0.30–0.50) | .0003 |
| Bone–formation rate, volume‐based (%/year) | 37 | 14.6 (8.6–21.8) | 7 | 0.4 (0.2–0.8) | <.0001 |
| Formation period (day) | 37 | 114 (66–178) | 7 | 459 (197–1581) | .02 |
| Activation frequency (year−1) | 37 | 0.200 (0.120–0.330) | 7 | 0.002 (0.001–0.004) | <.0001 |
| Resorption | |||||
| Eroded surface (ES/BS, %) | 38 | 1.04 (0.55–1.88) | 38 | 0.15 (0.00–0.69) | <.0001 |
| Osteoclast number, length‐based (mm−1) | 38 | 0.08 (0.04–0.12) | 38 | 0.00 (0.00–0.04) | <.0001 |
| B. Data at Individual Time Points | ||||||||||
| Month 24 | Month 36 | |||||||||
| Placebo (n = 37) | Denosumab (n = 31) | pa | Placebo (n = 25) | Denosumab (n = 22) | pa | |||||
| Index | n | n | n | n | ||||||
| BV/TV (%) | 32 | 12.9 (10.4, 19.4) | 26 | 12.8 (9.9, 15.2) | .33 | 22 | 12.1 (9.4, 17.4) | 18 | 15.1 (9.8, 16.8) | .51 |
| Cortical width (mm) | 36 | 0.658 (0.536, 0.910) | 31 | 0.763 (0.546, 1.071) | .41 | 24 | 0.762 (0.481, 1.080) | 22 | 0.594 (0.444, 1.068) | .36 |
| Osteoid surface (%) | 32 | 7.68 (4.23, 10.20) | 26 | 0.70 (0.11, 1.57) | <.0001 | 22 | 6.54 (4.05, 10.36) | 18 | 0.31 (0.19, 1.22) | <.0001 |
| Osteoid width (µm) | 32 | 9.09 (6.86, 10.69) | 26 | 5.44 (4.36, 6.62) | <.0001 | 22 | 8.72 (6.62, 13.06) | 18 | 5.56 (4.52, 8.07) | .0017 |
| Osteoid volume | 32 | 1.16 (0.65, 1.44) | 26 | 0.08 (0.01, 0.12) | <.0001 | 22 | 0.72 (0.39, 1.27) | 18 | 0.03 (0.01, 0.11) | <.0001 |
| Wall thickness (µm) | 32 | 43.6 (38.6, 49.8) | 26 | 40.4 (37.0, 50.5) | .48 | 22 | 52.5 (47.0, 57.6) | 18 | 47.3 (41.4, 53.6) | .24 |
| Mineralizing surf (%) | 31 | 4.73 (2.81, 8.12) | 5 | 0.12 (0.12, 0.22) | .0019 | 22 | 3.43 (1.69, 5.20) | 3 | 0.32 (0.12, 0.71) | .0084 |
| MAR (µm/day) | 31 | 0.73 (0.63, 0.82) | 5 | 0.30 (0.30, 0.30) | .0392 | 22 | 0.76 (0.66, 0.91) | 3 | 0.50 (0.30, 0.67) | .0445 |
| Bone form rate (%/year) | 31 | 16.5 (11.5, 34.6) | 5 | 0.3 (0.2, 0.8) | .0034 | 22 | 12.2 (7.7, 18.9) | 3 | 0.4 (0.4, 2.2) | .0066 |
| Formation period (days) | 31 | 92 (60, 149) | 5 | 914 (59, 1581) | .38 | 22 | 120 (93, 170) | 3 | 229 (197, 459) | .0405 |
| Activation frequency (year−1) | 31 | 0.270 (0.160, 0.580) | 5 | 0.001 (0.001, 0.002) | .0042 | 22 | 0.200 (0.090, 0.260) | 3 | 0.004 (0.002, 0.030) | .0064 |
| ES/BS (%) | 32 | 1.65 (0.70, 2.83) | 26 | 0.23 (0.07, 1.45) | .0005 | 22 | 0.81 (0.57, 1.31) | 18 | 0.17 (0.00, 0.38) | .0025 |
| Osteoclast n (mm−1) | 32 | 0.09 (0.06, 0.14) | 26 | 0.00 (0.00, 0.03) | <.0001 | 22 | 0.07 (0.04, 0.12) | 18 | 0.00 (0.00, 0.06) | .0137 |
Data are median (interquartile range). In part A, where individuals had samples from both 24 and 36 months, only the 36‐month sample has been included. Indices measured are the same in both parts, but some names have been abbreviated in part B.
Wilcoxon rank‐sum test.
Imputed as 0.3 µm/day in 5 subjects with single labels only. One other subject had not received study drug for 24 months at the time of biopsy.
The upper panel of Table 3 sets out the tetracycline labeling status of the biopsies after the extended search procedure. Some tetracycline labeling was present in all placebo biopsies but in only 64% of the denosumab group. Double labeling in trabecular bone was observed in 94% of placebo bones and in 19% of those treated with denosumab. As a result, tetracycline‐based indices could be calculated only in seven denosumab subjects, and in five of them, the value for mineral apposition rate was imputed from single labels. These data demonstrate a reduction in median bone‐formation rate of more than 97% (Table 2A). If the unlabeled biopsies are assigned zero values, then the medians and interquartile ranges are all zero for mineral apposition rate, bone‐formation rate, and activation frequency at both 24 and 36 months in the denosumab group. The median formation period was prolonged from 114 to 459 days.
Tetracycline Labeling Status of Biopsies in FREEDOM and STAND Trials
| Trabecular | Cortical | Trabecular or cortical | |||||
| Control* | Denosumab | Control* | Denosumab | Control* | Denosumab | ||
| FREEDOM | |||||||
| Evaluable biopsies | 62 | 53 | 62 | 53 | 62 | 53 | |
| Any label | 61 (98) | 18 (34) | 62 (100) | 30 (57) | 62 (100) | 34 (64) | |
| Double label | 58 (94) | 10 (19) | 61 (98) | 16 (30) | 62 (100) | 21 (40) | |
| Single label only | 3 (5) | 8 (15) | 1 (2) | 14 (26) | 0 | 13 (25) | |
| No label | 1 (2) | 35 (66) | 0 | 23 (43) | 0 | 19 (36) | |
| STAND | |||||||
| Evaluable biopsies | 21 | 15 | 21 | 15 | 21 | 15 | |
| Any label | 21 (100) | 9 (60) | 21 (100) | 11 (73) | 21 (100) | 12 (80) | |
| Double label | 19 (90) | 3 (20) | 21 (100) | 8 (53) | 21 (100) | 9 (60) | |
| Single label only | 2 (10) | 6 (40) | 0 | 3 (20) | 0 | 3 (20) | |
| No label | 0 | 6 (40) | 0 | 4 (27) | 0 | 3 (20) | |
Control group = placebo in FREEDOM study and alendronate in STAND study. Data are n (%).
To gain further insight into the significance of the absent labels, circulating bone turnover markers at the time of the biopsy were compared according to labeling status (Fig. 1). Individuals with double labels and those with absent labels had similar levels of biochemical markers of bone turnover. Incident fracture according to label status also was assessed. Nine subjects from this substudy had fractures, six in the placebo group (all with double labels) and three receiving denosumab—one with single labels only and two with no labels. The fractures in the denosumab‐treated group showed a normal healing time.
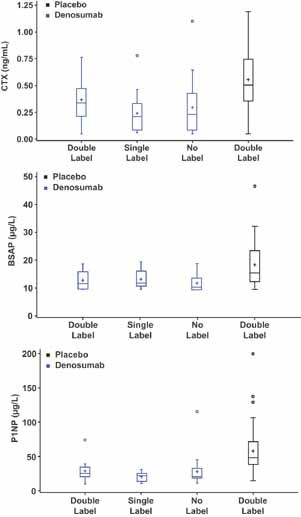
Bone turnover markers according to treatment allocation and tetracycline marker status. Data are shown as box‐and‐whisker plots with the interquartile range as the box, the median as a line, the mean as +, and the range of the nonoutlier observations as whiskers. Outliers are indicated as circles and were defined as observations 1 to 5 times the interquartile range above the third quartile or below the first quartile. Labeling status refers to label in either cortical or trabecular bone. In individuals with samples from both 24 and 36 months, only the 36 month sample was included. There were no differences in any marker according to labeling status.
µCT provides another way of assessing structural indices, and the results from those analyses are set out in Table 4. The findings are consistent with those for histomorphometric structural indices in that there are few between‐groups differences. However, at 24 months, denosumab biopsies showed reduced porosity and increased vBMD in cortical bone.
Structural Indices in FREEDOM Assessed by µCT
| Index | Month 24 | Month 36 | ||||||
| Placebo (n = 37) | Denosumab (n = 31) | Placebo (n = 25) | Denosumab (n = 22) | |||||
| n | n | n | N | |||||
| Trabecular | ||||||||
| Bone volume (BV/TV, %) | 29 | 19.1 (13.9, 24.3) | 24 | 19.1 (15.8, 21.2) | 19 | 16.2 (14.0, 23.6) | 16 | 25.2 (16.9, 26.8) |
| Connectivity density (/mm3) | 29 | 3.11 (2.04, 3.39) | 24 | 2.99 (2.35, 3.79) | 19 | 2.96 (1.87, 3.76) | 16 | 2.84 (2.16, 4.46) |
| Degree of anisotropy | 29 | 1.50 (1.40, 1.62) | 24 | 1.51 (1.38, 1.67) | 19 | 1.45 (1.26, 1.57) | 16 | 1.46 (1.29, 1.54) |
| Volumetric BMD (mg/cm3) | 29 | 192 (152, 236) | 24 | 191 (156, 212) | 19 | 148 (129, 215) | 16 | 221 (156, 243) |
| Structure model index | 29 | 0.95 (0.55, 1.78) | 24 | 0.90 (0.55, 1.32) | 19 | 1.42 (0.81, 1.84) | 16 | 0.73 (0.34, 1.68) |
| Trabecular number (/mm) | 29 | 1.37 (1.10, 1.53) | 24 | 1.31 (1.21, 1.46) | 19 | 1.31 (1.10, 1.42) | 16 | 1.46 (1.17, 1.70) |
| Trabecular separation (mm) | 29 | 0.591 (0.502, 0.787) | 24 | 0.614 (0.551,0.673) | 19 | 0.634 (0.550,0.766) | 16 | 0.520 (0.428,0.723) |
| Trabecular thickness (mm) | 29 | 0.155 (0.130, 0.185) | 24 | 0.145 (0.110,0.181) | 19 | 0.144 (0.110,0.216) | 16 | 0.157 (0.137,0.191) |
| Cortical | ||||||||
| Thickness (mm) | 35 | 0.720 (0.603, 0.972) | 31 | 0.890 (0.591,1.093) | 24 | 0.710 (0.554,0.959) | 21 | 0.565 (0.472,0.855) |
| Porosity (%) | 35 | 4.58 (3.57, 6.64) | 31 | 3.64*(2.95, 4.49) | 24 | 3.91 (2.83, 5.49) | 21 | 4.13 (2.66, 5.44) |
| Volumetric BMD (mg/cm3) | 35 | 851 (798, 869) | 31 | 866† (845, 919) | 24 | 864 (825, 1883) | 21 | 875 (833, 902) |
Data are median (interquartile range). BMD = bone mineral density. Significant differences from placebo, *p = .011; †p = .018. For all other comparisons, there were no significant differences between groups (Wilcoxon rank‐sum test).
STAND
Thirty‐nine women (alendronate 21, denosumab 18) enrolled in the bone biopsy substudy, of whom 36 successfully had a biopsy. All denosumab subjects had received two doses of study drug, and average compliance with alendronate/placebo was 99%. All subjects complied with tetracycline dosing, confirmed by uniformly positive urine samples—one subject in the alendronate group did not provide a sample, but her biopsy data are included in the analyses. Their demographic data were comparable with those of the total trial cohort (Table 5). All biopsies were qualitatively normal, with the exception of one alendronate subject whose biopsy showed evidence of marrow fibrosis without associated clinical or biochemical abnormalities. The tetracycline labeling status of the biopsies is shown in Table 3. Some tetracycline labeling was present in all biopsies from the alendronate group but only in 80% of the biopsies from the denosumab group. Double labeling in trabecular bone was seen in 90% of the alendronate biopsies and in 20% of those from denosumab subjects.
Demographic Data of the Women in the STAND Trial
| Bone biopsy substudy | Total trial cohort | |||
| Alendronate (n = 21) | Denosumab (n = 15) | Alendronate (n = 251) | Denosumab (n = 253) | |
| Age (years) | 68.2 ± 7.5 | 65.1 ± 6.3 | 68.2 ± 7.7 | 66.9 ± 7.8 |
| Years since menopause | 21.2 ± 10.6 | 16.0 ± 7.3 | 19.9 ± 9.9 | 18.8 ± 9.2 |
| Ethnicity (% white) | 90 | 93 | 92 | 94 |
| Body mass index | 24.3 ± 4.2 | 24.2 ± 2.7 | 24.7 ± 4.0 | 24.2 ± 3.8 |
| T‐score | ||||
| Lumbar spine | –2.4 ± 0.8 | –3.1 ± 0.5 | –2.6 ± 0.8 | –2.6 ± 0.8 |
| Total hip | –1.7 ± 0.7 | –1.7 ± 0.9 | –1.8 ± 0.7 | –1.8 ± 0.8 |
| Femoral neck | –2.2 ± 0.7 | –1.8 ± 1.0 | –2.1 ± 0.7 | –2.1 ± 0.8 |
Data are mean ± SD.
Of the 36 biopsies obtained, 34 were evaluable by histomorphometry (alendronate 21, denosumab 13; Table 6). Indices of bone structure and volume showed no differences between groups, including trabecular number, separation, and thickness (data not shown). Median eroded surface was 82% lower in the denosumab biopsies compared with alendronate. Osteoid indices tended to be lower in the denosumab group, but wall thicknesses were comparable. Tetracycline‐based indices were available in fewer subjects in the denosumab group. Despite the absent values, mineral apposition rate still was significantly lower in the denosumab subjects compared with those continuing on alendronate, although the other parameters were not significantly different. If the biopsies without labels are assigned zero values, then the medians and interquartile ranges for denosumab are mineral apposition rate 0.0 (0.0, 0.3) µm/day, bone‐formation rate 0.0 (0.0, 3.8) percent/year, and activation frequency 0.00 (0.00, 0.01) per year.
Histomorphometric Indices at 12 Months in Women in the STAND Trial
| Alendronate (n = 21) | Denosumab (n = 15) | ||||
| Index | n | n | pa | ||
| Structural | |||||
| Trabecular bone volume (BV/TV, %) | 21 | 12.4 (10.6, 16.9) | 13 | 16.5 (10.9, 19.0) | .30 |
| Cortical width (mm) | 18 | 0.672 (0.588, 0.786) | 13 | 0.651 (0.476, 0.803) | .98 |
| Formation | |||||
| Osteoid surface (%) | 21 | 2.93 (1.33, 4.12) | 13 | 1.07 (0.44, 3.86) | .10 |
| Osteoid width (µm) | 21 | 6.82 (5.73, 8.44) | 13 | 5.54 (4.75, 6.03) | .003 |
| Osteoid volume | 21 | 0.32 (0.13, 0.67) | 13 | 0.08 (0.02, 0.36) | .04 |
| Wall thickness (µm) | 21 | 45.8 (39.1, 54.9) | 13 | 51.9 (36.8, 58.6) | 1.00 |
| Dynamic | |||||
| Mineralizing surface (%) | 21 | 0.48 (0.19, 1.28) | 6 | 2.08 (0.17, 3.03) | .21 |
| Mineral apposition rate (µm/day) | 21b | 0.55 (0.35, 0.81) | 6c | 0.30 (0.30, 0.45) | .02 |
| Bone‐formation rate, volume‐based (%/year) | 21 | 3.1 (0.4, 4.8) | 6 | 4.0 (0.3, 4.7) | .95 |
| Formation period (day) | 21 | 353 (263, 1111) | 6 | 378 (179, 773) | .93 |
| Activation frequency (year−1) | 21 | 0.040 (0.003, 0.070) | 6 | 0.015 (0.005, 0.030) | .38 |
| Resorption | |||||
| Eroded surface (ES/BS, %) | 21 | 1.88 (0.75, 2.69) | 13 | 0.34 (0.09, 1.48) | .03 |
| Osteoclast number, length‐based (mm−1) | 21 | 0.10 (0.04, 0.22) | 13 | 0.04 (0.00, 0.09) | .14 |
Data are median (interquartile range).
Wilcoxon rank‐sum test.
Imputed as 0.3 µm/day in two subjects with single labels only.
Imputed as 0.3 µm/day in four subjects with single labels only.
Discussion
These data document maintenance of qualitatively normal bone histology after up to 3 years of treatment with denosumab. Normal trabecular and cortical microarchitecture is maintained, mineralization is normal (ie, there is no evidence of osteomalacia), and bone marrow is unremarkable to the extent that it can be examined by this technique. Despite the substantial increases in BMD produced by denosumab in the FREEDOM study,15 structural parameters assessed by histomorphometry and µCT do not show clear‐cut effects, although cortical porosity was decreased at 24 months. A similar discrepancy between BMD assessment and that from histomorphometry also has been noted in most20–22 but not all23 studies of bisphosphonates. This may reflect the much greater precision of BMD measurement by dual‐energy X‐ray absorptiometry, smaller numbers and absence of baseline samples in most biopsy studies, and differences in response between the ilium (from where biopsies are obtained) and skeletal sites where BMD is measured. The phase 3 study of zoledronate did find a significant effect on trabecular bone volume but had at total of 111 evaluable biopsies at 3 years, so it was better powered to find a significant effect.23
Bone histomorphometry also provides important insights into the mechanism of action of bone‐active agents. Our data demonstrate a marked reduction in indices of both bone resorption (eg, eroded surface) and formation with denosumab. These appear to be greater than are seen with the commonly used bisphosphonates, and this is supported by the data from the STAND,16 which directly compare the histomorphometric effects of continuing alendronate or transitioning to denosumab. Some, but not all, of the parameters of formation and resorption are significantly lower with denosumab than with alendronate, and this difference becomes more marked when zeros are imputed for the biopsies with absent tetracycline labels. These findings are consistent with the biochemical marker data from the STAND16 and from the phase 2 denosumab study,13 both of which show significantly greater decreases in turnover with denosumab compared with alendronate. Reductions in eroded surface may be particularly important because erosions may weaken bone locally and lower the threshold for crack initiation. Thus a reduction in eroded surface should, in the absence of other treatment effects, result in improved bone strength.24
While the comparison of static formation and resorption indices among treatment groups is straightforward, that for the tetracycline‐based indices is complicated by the fact that the very low turnover levels associated with denosumab treatment resulted in the absence of quantifiable tetracycline labeling in cancellous bone in the majority of subjects. We have addressed this by imputing mineral apposition rates from single labels and by providing results both with and without absent data points assigned a value of zero, as recommended by Hauge.19 Most bisphosphonate studies have not followed this practice20, 21, 23 and may have overestimated the tetracycline‐based dynamic indices as a result. The decreases in activation frequency and mineral apposition rate are profound, but wall thickness is unaffected by denosumab.
A bone biopsy samples only a tiny fraction of the skeleton, and at low levels of turnover, it may become an inaccurate indicator of the global bone‐formation rate. This possibility is supported by the finding that biochemical markers of bone formation, which are derived from the entire skeleton, were no lower in subjects with unlabeled biopsies than in those with double labels. The number of fractures in the biopsied cohort is small, so it does not permit us to address the relationship between label status and fracture risk in denosumab users. While it is widely believed that substantial reductions in bone remodeling sustained over long periods ultimately will have an adverse effect on bone strength, there are no data from human studies that document what combination of turnover reduction and duration is necessary to produce adverse outcomes. In fact, the available clinical data point in the opposite direction, indicating that, in untreated subjects, high turnover is associated with increased fracture risk25 and that in denosumab users greater degrees of suppression of turnover result in larger increases in BMD26 and greater antifracture efficacy.27 Data from cynomolgus monkeys treated with denosumab support this contention, showing greater bone strength in animals with fewer fluorescent labels and less eroded surfaces.28 The fracture data from the FREEDOM study are particularly important with respect to this issue, showing substantial reductions in fractures in the same cohort of patients in whom there is such clear histologic evidence of reduced bone turnover. Thus these data can be taken as extending the range of what is known to be a safe reduction in bone turnover over a period of 3 years. Fracture rates beyond 3 years are unknown and will be a critical factor to be monitored in the extension to the FREEDOM study.
While denosumab and bisphosphonates are both antiresorptive agents, their modes of action are completely different, the bisphosphonates accumulating within bone and thereby exerting a long‐term inhibition of bone cell activity, even after their administration is discontinued. In contrast, denosumab exerts its actions entirely from within the extracellular fluid and therefore has a relatively rapid offset of action at about 6 months when its circulating levels drop below a critical level.29 Thus withdrawal of denosumab therapy at 24 months results in a rapid increase in markers of bone formation and bone resorption.14 This would suggest that if there are adverse tissue effects from prolonged low bone turnover, these would be reversed during any break in drug therapy. Indeed, the individual in the FREEDOM study who had been untreated for 24 months at the time of biopsy showed histomorphometric indices consistent with a return toward those seen in the placebo group.
In conclusion, this first description of bone histomorphometry with denosumab use confirms that this agent produces a potent and sustained inhibition of bone turnover. Denosumab maintains normal bone microarchitecture without evidence of adverse effects on mineralization or the formation of lamellar bone. Taken in the context of its demonstrated antifracture efficacy, our data provide further evidence for the safety of denosumab over 3 years of use. The histomorphometry from the STAND trial indicates that this denosumab regimen produces greater inhibition of turnover than occurs with alendronate 70 mg per week but that there is no evidence of any untoward interaction when patients transition from alendronate to denosumab. Longer follow‐up is necessary to determine for how long such low turnover is safe.
Disclosures
IRR has received consulting fees or participated on paid advisory boards for Amgen, Merck, and Novartis and received lecture fees from Novartis and Merck. He also has received grant support from Amgen, Novartis, Merck, and Procter & Gamble. IRR contributed to study design and data collection, wrote the statistical analysis plan, wrote the first draft of manuscript, was responsible for the final version of manuscript, had full access to study data, and had final responsibility for the decision to submit the manuscript. PDM has received consulting fees from Procter & Gamble, Sanofi‐Aventis, Roche, Eli Lilly, Merck, Novartis, Amgen, NPS, and GlaxoSmithKline. He has received lecture fees and reimbursement of travel expenses from Procter & Gamble, Sanofi‐Aventis, Roche, Eli Lilly, Merck, Novartis, Amgen, and GlaxoSmithKline. He also has received honoraria from Procter & Gamble, Sanofi‐Aventis, Roche, Eli Lilly, Amgen, and Merck and grant support from Procter & Gamble, Sanofi‐Aventis, Roche, Eli Lilly, Merck, Novartis, and Amgen. PDM contributed to data collection, data interpretation, and critical revision of the manuscript. JPB has received consulting fees from Amgen, Sanofi‐Aventis, Eli Lilly, Merck Frosst, Novartis, and Procter & Gamble and grant support from Amgen, Sanofi‐Aventis, Eli Lilly, Merck Frosst, Novartis, Pfizer, Procter & Gamble, Servier, and Roche. He also has received honoraria and lecture fees from Amgen, Sanofi‐Aventis, Eli Lilly, Merck Frosst, Novartis, Procter & Gamble, and Servier. JPB contributed to data collection, data interpretation, and critical revision of the manuscript. DLK has received grant support from Merck, Amgen, Eli Lilly, Novartis, Procter & Gamble, GlaxoSmithKline, Pfizer, Roche, Biosante, and Wyeth; honoraria from Merck, Amgen, Eli Lilly, Servier, Nycomed, and Wyeth; and reimbursement for travel expenses from Amgen. He also has served as a consultant for Merck, Amgen, Eli Lilly, Novartis, Wyeth, and Nycomed and as a speaker for Merck, Amgen, Eli Lilly, Novartis, Procter & Gamble, and Pfizer. DLK contributed to data collection, data interpretation, and critical revision of the manuscript. AF‐P has received grant support from Roche and honoraria from Eli Lilly, Daiichi Sankyo, Merck, Novartis, Servier, Roche, and Amgen. She also has received lecture fees and reimbursement of travel expenses from Amgen, Daiichi Sankyo, Eli Lilly, Merck, Novartis, Servier, Roche, Sanofi‐Aventis, and Nycomed. AF‐P contributed to data collection, data interpretation, and critical revision of the manuscript. IV has served as an investigator for Amgen. IV contributed to data collection, data interpretation, and critical revision of the manuscript. KM has no conflicts of interest. KM contributed to data collection, data interpretation, and critical revision of the manuscript. MB has received honoraria, payment for development of educational materials, and reimbursement of travel costs from Amgen. MB contributed to data collection, data interpretation, and critical revision of the manuscript. GW has received grant support from Amgen, Eli Lilly, Pfizer, GlaxoSmithKline, Merck, Forest, and Wyeth. He also has received honoraria from Amgen and Eli Lilly. GW contributed to data collection, data interpretation, and critical revision of the manuscript. HB has served as a board member for Merck and as a consultant for Merck, Amgen, Zelos, Pfizer, Takeda, and Osteologix. He also has received grant support from Amgen, Takeda, Eli Lilly, Merck, and Nordic Bioscience; reimbursement for travel expenses from Amgen and Merck; honoraria from Novartis; payment for manuscript preparation from Schering‐Plough; and lecture fees from Amgen and Novartis. HB contributed to data collection, data interpretation, and critical revision of the manuscript. BD is employed by and owns stock or stock options in Amgen. BD contributed to data analysis and interpretation and critical revision of the manuscript. RBW is employed by and owns stock or stock options in Amgen. RBW contributed to study supervision, data collection and interpretation, and critical revision of the manuscript. JSM is employed by and owns stock or stock options in Amgen. JSM contributed to study design and supervision, data interpretation, and critical revision of the manuscript. MSO is employed by and owns stock or stock options in Amgen. MSO contributed to data collection, data interpretation, and critical revision of the manuscript. DWD has served as a consultant and received reimbursement of travel expenses from Amgen and Merck. He also has participated on a paid advisory board for Amgen and has served as a board member and received honoraria and lecture fees from Merck. DWD contributed to data interpretation, wrote the first draft of the manuscript, and provided critical revision of the manuscript.
Acknowledgements
We are grateful to the subjects who participated in the bone biopsy substudies of these trials; to Dr Theresa Hefferan, Dr Robert Wermers, Dr Michael J Yaszemski, Donna Jewison, Glenda Evans, and Julie Burgess of the Bone Histomorphometry Laboratory of the Mayo Clinic, who performed the histomorphometry analyses; to Frank Asuncion of Amgen for help with the µCT analyses; and to Amy Foreman‐Wykert, PhD, of Amgen for project management support and creating the figure.
The studies were funded by Amgen, Inc., Thousand Oaks, CA, USA. Clinical Trial Registration: NCT00089791, registered August 13, 2004 (FREEDOM), and NCT00377819, registered September 14, 2006 (STAND).
References
Author notes
These data were presented in part as an abstract and oral presentation at the 31st Annual Meeting of the American Society for Bone and Mineral Research, Denver, CO, USA, September 11–15, 2009
